http://www.ijcmph.com pISSN 2394-6032 | eISSN 2394-6040
Original Research Article
Nutritional status assessment of children aged 0-5 years and its
determinants in a tribal community of Coimbatore district
S. K. Senthilkumar
1*, Thomas V. Chacko
2, K. Suvetha
2INTRODUCTION
Malnutrition among children in India is a well known public health problem due to inadequate nutrition. According to WHO, malnutrition is defined as a “pathological state resulting from a relative or absolute deficiency or excess of one or more essential nutrients”.1 Malnutrition is the biggest contributor to child mortality where 70%, 26% and 4% of malnourished children live in Asian, Africa and Latin America respectively.2 The nutritional status of under-five children is causing great concern among social scientists and planners nowadays
because child is the principal victim of interaction of nutritional, social, economical and also health related factors that lead to malnutrition. On an average, a child dies every 5 seconds as a direct or indirect result of malnutrition –700 every hour –16,000 each day –6 million every year.3 Assessment of growth not only serves as a method of evaluating the health and nutritional status of children, but also it provides an alternative method of assessment of the quality of life of the entire community.4 Death due to common childhood illness is more common in a malnourished child when compared with an adequately nourished child.5 Under-five children are the most at risk segment in any
ABSTRACT
Background: Nutritional assessment in children is very important to prevent nutritional disorders and to decrease the
morbidity and mortality. The present study was undertaken to assess the prevalence and determinants of malnutrition among children aged 0-5 years in a tribal community of Coimbatore district. Anaikatty and Palamalai tribal areas of Perianaikenpalayam block (population=347062) was selected for our study.
Methods: A total of 206 children aged 0-5 years were included in the study after implementing the exclusion criteria.
Results: Overall prevalence of malnutrition found to be 51%. These 51% (105) malnourished children consisted of
41.3% underweight, of which 11.2% were severely underweight. Prevalence of stunting was 32.5%, of which 6.3% were severely stunted. About 21.8% children were wasted and 6.8% were severely wasted among them. Socio-demographic factors like total number of family members exceeding four, mother’s educational status, father’s educational status, mother’s occupational status, socio-economic status, alcohol usage by any family member, and mother’s nutritional status were found to be significantly associated with malnutrition on univariate analysis.
Conclusions: The problems of low standard of living, hunger, starvation, malnutrition, agricultural illiteracy, poor antenatal care, disease, poor sanitary and housing facilities, etc. has to be improved totally by implementation of policy that already exists.
Keywords: Nutrition, Prevalence, Determinants, Under five aged children
Department of Community Medicine, 1Coimbatore Medical College, 2PSG Institute of Medical Sciences, Coimbatore, Tamil Nadu, India
Received: 02 August 2017
Revised: 16 May 2018
Accepted: 18 May 2018
*Correspondence:
Dr. S. K. Senthilkumar,
E-mail: [email protected]
Copyright: © the author(s), publisher and licensee Medip Academy. This is an open-access article distributed under
the terms of the Creative Commons Attribution Non-Commercial License, which permits unrestricted non-commercial use, distribution, and reproduction in any medium, provided the original work is properly cited.
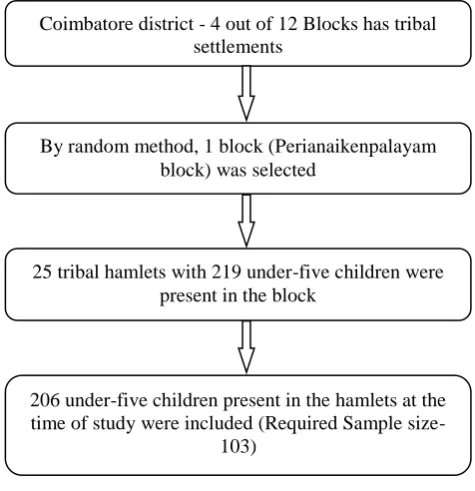
By random method, 1 block (Perianaikenpalayam block) was selected
population and their nutritional status is a sensitive indicator of their health status and nutrition.6 Malnourished children are more likely to become malnourished adults and they face increased risks of morbidity and mortality.7,8 It is essential to pay more attention to correlate between children’s nutritional status and their capability to attain the required physical growth and mental development.9 In South India, only few tribal based studies to determine the prevalence of malnutrition among under-five children has been carried out, with paucity of data regarding prevalence of malnutrition obtained as community based study in tribal areas of Tamilnadu. Hence this community based study was undertaken to assess the prevalence of malnutrition and its association with selected known risk factors among children aged 0-5 years in the tribal hamlets of Periyanaickenpalayam of Coimbatore.
METHODS
Study design
Cross sectional study
Study population
The study included 206 children aged 0-5 years, from 25 tribal hamlets in Anaikatty and Palamalai tribal areas of Perianaikenpalayam block of Coimbatore district, Tamil Nadu. Mothers of all these children were interviewed and anthropometric measurements were taken for the children and their mothers who were included for analysis.
Sample size determination
With an estimated prevalence of 55% from earlier studies10 and 20% allowable error, sample size was calculated using the formula,
( )
n=82
Where, n=Number of samples required; p=Prevalence; q=100–p; d=allowable error.
Non response rate = 20%
= 103
Study period
Home-visits were carried out from December 2013 to August 2014.
Figure 1: Study protocol.
Inclusion criteria
All the children of age 0-59 months who were permanent
residents in the 25 tribal hamlets of
Periyanaickenpalayam block.
Exclusion criteria
Under-five children who were not present at home even after three consecutive visits.
Data collection tools
Physical instruments and well-structured questionnaire were used fordata collection.
Physical instrument
The physical instrument used in the study included a weighing scale, a Salter scale, retractable metal measuring tape and an infantometer. All the instruments were calibrated by the Department of Biometrics, PSGIMS&R validated through Best Standard Technologies Private Ltd Chennai (Certificate No: BSM-012501-12) prior to the study.
Questionnaire
A Pre-tested semi structured questionnaire was presented in the Department for critical review, following which necessary changes were made in the questionnaire, it was translated into Tamil and back translated to eliminate loss of meaning. Data was collected using this pre-tested semi structured questionnaire by interview technique. The parents of children of age group 0-59 months were
Coimbatore district - 4 out of 12 Blocks has tribal settlements
25 tribal hamlets with 219 under-five children were present in the block
206 under-five children present in the hamlets at the time of study were included (Required Sample
informed about the study and each question was explained to gather the data about socio-demographic factors, environmental factors, birth history and feeding practices, recent illness, availability of health facilities and their utilization. Simultaneously height and weight of the child and mother were measured.
Steps in data collection
After getting approval from the institutional ethics committee, the study was started.
Pilot study
Pilot study was carried out in a rural area, Neelambur, Coimbatore, which is located outside the field practice area of the Rural Health Training Center of the Community Medicine department, PSG IMSR to identify problems in eliciting the data using the prevalidated instruments.
Data collection for study
Consent for the participation in the study was obtained from mother using questionnaire.
Anthropometric measurements
Weight and height of all 206 children and their mothers who participated in the study were measured based on WHO recommended procedure.11
Measurement of weight
The weight of the children were measured using the conventional standard weighing scale and Salter spring balance for children aged less than two years. These scales were calibrated before commencement of data collection. These scales are widely used in epidemiological studies. With light clothing and without any footwear, children were asked to stand on the platform of weighing scale with body weight evenly distributed between both feet and weight was measured to nearest 0.5 kg. Zero error was set after each measurement.11
Measurement of height
Height was measured using a retractable metal measuring tape. Children whose height has to be measured stood on the floor in an erect position without any foot wear with his / her back against the wall. He / she was asked to put their feet together and move back till their heels touched the bottom of the wall and stretch upwards to the fullest extent with their arms hanging on the side. The head was held in such a way that lower rim of the orbit and auditory canal were in horizontal plane. The height appears in the read off area and measured to nearest 0.5 cm. The supine length was measured in children <than 2 years of age using an infantometer. The child was placed
on board with head positioned firmly against the fixed head board, the knees extended by firm pressure and the feet fixed at right angles to the lower legs. Then the up right foot piece was moved to obtain firm contact with the heels and the length was measured to the nearest 0.5 cms.11
Assessment of nutritional status using anthropometry method
The 2006 WHO Growth Standards for Preschool Children were used for the determination of nutritional status of preschool children. Standard deviation of scores (Z-scores) for for-age, height-for-age and weight-for-height were calculated. The Z-score (SD score) is calculated as follows. The Z-score is defined as the deviation of the value observed for an individual from the median of the reference population, divided by the standard deviation (SD) of the reference population.
Z score = (individual value-median value of reference population)/ SD value of reference population.
For each of the anthropometric indicators of malnutrition a cutoff point of-2 standard deviations (-2 SD) below the median of that of the WHO reference population was used. Deviation of Z-scores less than – 3SD put children in the severe under nutrition category.
24-hour food recall method
It is a retrospective assessment method in which the respondent is prompted to recall and describe all foods and beverages consumed in the preceding 24 hours or the preceding day. Portion size estimating aides were carried to assist the respondent to recall amounts consumed. Total Energy and Proteins in terms of calories and grams consumed was calculated for 24 h period. Percentage of Energy and Proteins consumed in comparison to recommended daily allowance (RDA) by NIN was calculated and the results were analyzed.12
Statistical analysis
Body Mass Index (BMI) was computed for all mothers using the following formula:
BMI (Kg/m2) = Weight (Kg) / Height (m2)
The WHO AnthroII. PC software of WHO was used for analyzing the nutritional status of children.
RESULTS
Of the 206 children studied, 106 were boys and 100 were girls. The mean (SD) height of the boys was 89.7 cm (12.29) and mean (SD) weight of the boys was 12.2 kg (3.32). Similarly for girls, the mean (SD) height was 89.6 cm (12.72) and mean (SD) weight is 12.2 kg (3.44). The mean (SD) BMI of the mothers was 20.2 (2.69).
Table 1: Hamlet-wise distribution of study subjects.
S.N Name of Hamlet Number of children
1. Alamaramedu 9
2. Arnatkadu 15
3. Jammukundi 5
4. Kandivalli 6
5. Kilurpathy 5
6. Kondanur 13
7. Kondanurpudur 5
8. Koodanur 13
9. Kunjurpathy 6
10. Kuttupulikadu 2
11. Mangarai 2
12. Manguli 8
13. Melurpathy 3
14. Palamalai 10
15. Panapalli 13
16. Pasumani 6
17. Pasumanipudur 9
18. Perukupathy 8
19. Perumpathy 3
20. Rayarurpathy 12
21. Sembukarai 3
22. Thirumalur 31
23. Thumanur 5
24. Thuvaipathy 11
25. Milagayampathy 2
Total 206
Prevalence of malnutrition
The child is considered as “Malnourished” if he/she is underweight or wasted or stunted. The overall prevalence of malnutrition was found to be 51% and 49% of the children was found to be “Normal” anthropometrically. Of these 105 malnourished children, 41.3% were underweight, 32.5% were stunted and 21.8% had wasting.
Low weight-for-age is termed underweight. This is a composite measure of malnutrition. There is no statistically significant gender difference in the prevalence of underweight in any of the age-groups. (p=0.33) (Table 2).
Low weight-for-height is termed wasting. Wasting reflects a state of acute (short-term) under nutrition. There is no statistically significant gender difference in prevalence of wasting among different age-groups (p=0.75). Prevalence of wasting increases as the age of the children increases.
Low height-for age is termed stunting. Stunting is indicative of chronic (long-term) under nutrition. There is no statistically significant gender difference in the prevalence of stunting among different age-groups (p=0.07). Higher prevalence of malnutrition was observed among the lower socio-economic classes (p<0.001).
The study revealed, 81% of malnourished children are consuming <50% of the RDA of energy. Forty two% of normal children according to anthropometry are consuming <50% 0f the RDA of energy. No child in the malnourished category is consuming >90% of recommended allowance and only 3 children are consuming >70% of the RDA of energy.
Table 2: Age sex distribution of underweight children.
Age group (months)
Male Female Total
Total Moderate
(%)
Severe
(%) Total
Moderate (%)
Severe
(%) Total
Moderate (%)
Severe (%)
0-12 9 4 (44.4) 1 (11.1) 10 4 (40) 2 (20) 19 8 (42.1) 3 (15.8)
13-24 16 5 (31.3) 3 (18.8) 16 5 (31.3) 3 (18.8) 32 10 (31.3) 6 (18.8)
25-36 26 10 (30.3) 4 (15.4) 19 7 (36.8) 1 (5.3) 45 17 (37.8) 5 (11.1)
37-48 26 6 (230.1) 2 (7.7) 28 7 (25) 2 (7.1) 54 13 (24.1) 4 (7.4)
49-60 29 8 (27.6) 3 (10.3) 27 6 (22.2) 2 (7.4) 56 14 (25) 5 (8.9)
Total 106 33 (31.1) 13 (12.3) 100 29 (29) 10 (10) 206 62 (30.1) 23 (11.2)
Statistically significant gender difference in the prevalence of underweight is p ≤ 0.33)
Univariate analysis was done to explore the association of malnutrition with socio-demographic characteristics of the child. The risk factors that were significantly associated with malnutrition were: Parents being illiterate, mother not working outside, total family
members >4, child belonging to Class IV and Class V SES according to modified Prasad’s classification, The children mainly taken care by any other family member other than mother is also not a significant risk factor for malnutrition (Table 3).
Table 3: Socio-demographic characteristics associated with malnutrition among under-five children.
Factors Category Total Malnourished Unadjusted
odds ratio 95% CI* P value
N %
Age of child
≤1 year 19 (9.2) 11 57.9 1
0.28 – 1.91
0.5
>1 year 187 (90.8) 94 50.3 0.735
Sex Male 106 (51.5) 54 50.9 1 0.58 – 1.73
0.9
Female 100 (48.5) 51 51 1.1
Main care- taker
Mother 203 (98.5) 102 50.2 1
0.27 – 74.64
0.6
Other 3 (1.5) 3 100 2.94
Any alcoholic No 35 (17) 5 14.3 1 3.12 – 22.84
<0.001
Yes 171 (83) 100 58.5 8.45
Mother’s educational status
Literate 119 (57.8) 46 38.7 1
1.86-5.98 <0.001
Illiterate 87 (42.2) 59 67.8 3.34
Father’s educational status
Literate 144 (69.9) 49 34 1
7.28-44.94 <0.001
Illiterate 62 (30.1) 56 90.3 18.09
Mother’s occupation status
Home maker 148 (71.8) 88 59.5 1
0.15 – 0.54 <0.001
Working 58 (28.2) 17 29.3 0.283
Total family members
≤4 102 (49.5) 34 33.3 1
2.4 – 7.7 <0.001
>4 104 (50.5) 71 68.3 4.3
SES Class I, II, III 35 (17) 3 8.6 1 4.64 – 33.52 <0.001
Class IV, V 171 (83) 102 59.6 15.76
Mother’s BMI
Normal and
above 145 (70.4) 58 40 1 2.54 – 9.97 <0.001
Under weight 61 (29.6) 47 77 5.03
Table 4: Household characteristics associated with malnutrition among under-five children.
Factors Category Total Malnourished Unadjusted
odds ratio 95% CI* P value
N %
Type of house
Pucca 53 (25.7) 18 34 1
1.20–4.95
<0.01
Semi pucca 144 (69.9) 80 55.6 2.43
Kutcha 9 (4.4) 7 77.8 6.81 1.11–53.41
Water source Piped water 196 (95.1) 96 49 1 1.18–101.29 <0.05
Well water 10 (4.9) 9 90 9.38
Toilet Private/public 36 (17.5) 5 13.9 1 3.28–23.90 <0.001
Open air 170 (82.5) 100 58.8 8.85
The association of semi-pucca house and kutcha house as risk factors relating the house-hold environment with malnutrition found to be significant compared with pucca house. Source of drinking water other than piped water supply and the practice of open air defecation were also found to be significant risk factors for malnutrition (Table 4).
Mother’s age less than 20 years during this child birth, deliveries other than institutional deliveries, preterm delivery of this child, and low birth weight were found to be significant risk factors for malnutrition. Birth order of the child was not a significant risk factor (Table 5).
Correct feeding practices of infant and young child are very essential to the nutritional status of any child.
Initiation of breastfeeding more than an hour, breastfeeding the child exclusively for a period less than 6 months, breastfeeding the child for a period less than 1 year, not giving any milk supplements to children above 6 months, consumption of <50% of the RDA of calories and proteins are significant risk factors for malnutrition. More than 90% of the children were fed with colostrum after birth. Avoiding colostrum does not turn out to be a risk factor for malnutrition in our study (Table 6).
It is evident from Table 7 that under-five children who suffered from any illness in the past month and those children who were not treated for those illnesses were more prone for malnutrition.
Table 5: Birth history associated with malnutrition among under-five children.
Factors Category Total Malnourished Unadjusted
odds ratio 95% CI* P value
N %
Mothers age at child birth
<20 31 (15) 24 77.4 1
0.10 – 0.61 <0.05
≥20 175 (85) 81 46.2 0.25
Place of birth
Hospital/health
centre 184 (46.7) 86 46.7 1 2.06 – 25.23 <0.001
Home 22 (10.7) 19 86.4 7.21
Term of delivery
Term 188 (91.3) 91 48.4 1
1.18 – 11.75 <0.05
Pre term 18 (8.7) 14 77.8 3.73
Birth weight Normal 124 (60.2) 41 33.1 1 3.78 – 13.69 <0.001
LBW 82 (39.8) 64 78 7.19
Birth order ≤2 191 (92.7) 95 49.7 1
0.66 – 6.13 0.2
>2 15 (7.3) 10 66.7 2.02
Table 6: Infant and young child feeding practices associated with malnutrition among under-five children.
Factors Category Total Malnourished Unadjusted
odds ratio 95% CI* P value
N %
Colostrum given
No 16 (7.8) 11 68.8 1
0.14-1.1.33 0.1
Yes 190 (92.2) 94 49.5 0.44
Breast feeding initiation
≤1 hr 171 (83) 71 41.5 1
6.40-98.0 <0.001
>1 hr 35 (17) 34 97.1 47.88
Exclusive breast-feeding
6 months 73 (35.4) 19 26 1
2.76-9.73 <0.001 > or <6
months 133 (64.6) 86 64.7 5.20
Total breast feeding in children more than 1yr
≥12 months 191 (92.7) 93 48.7 1
1.06-19.48 <0.05
<12 months 15 (7.3) 12 80 4.22
Other milk in children >6months
Yes 60 (30.5) 11 18.3 1
3.73-10.74 <0.001
No 137 (69.5) 89 65 8.26
Calorie
consumption(% of RDA)
≥50 83 (40.3) 24 28.9 1
2.59-8.66 <0.001
<50 123 (59.7) 81 65.9 4.74
Protein
consumption(% of RDA)
≥50 149 (72.3) 65 61.9 3.04
1.58-5.84 <0.05
<50 57 (27.7) 40 38.1 1
Table 7: Illness in the past month associated with malnutrition among under-five children.
Factors Category Total Malnourished Unadjusted
odds ratio 95% CI* P value
N %
Illness present in the last month
No 110 (53.4) 39 35.5 1
2.23-7.16 <0.001
Yes 96 (46.6) 66 68.8 4.00
Illness treated among morbid children
Yes 64 (66.7) 39 60.9 1
1.07-11.83 <0.05
No 32 (33.3) 27 84.4 3.46
Table 8 shows the health service availability, its utilization and the association of these factors with malnutrition among the tribal children. Availability of health facility within a radius of 3 km is not associated with malnutrition and so show that it is protective against getting malnourished.
Children who are not immunized appropriate for age are at significant risk of malnutrition. It is interesting to see that children who are not attending the ICDS centers are having better nutritional status according to anthropometric measurements.
Table 8: Health service availability and utilization associated with malnutrition among under-five children.
Factors Category Total Malnourished Unadjusted
odds ratio 95% CI* P value
N %
Distance of health facility
≤3 kms 76 (36.9) 43 56.6 1
0.39-1.23 0.218
>3 kms 130 (63.1) 62 47.7 0.70
Immunization status
Appropriate 187 (90.8) 88 47.1 1
1.53-2.36 <0.001
Not appropriate 19 (9.2) 17 89.5 1.90
Attending ICDS Yes 123 (59.7) 77 62.6 1 0.38-0.75 <0.001
No 83 (40.3) 28 33.7 0.54
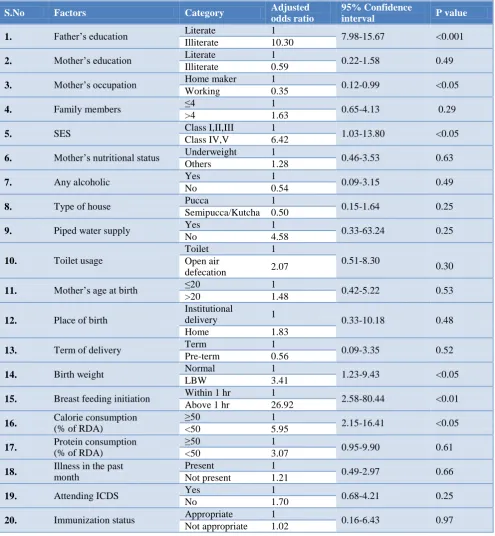
Table 9: Multivariate logistic regression analysis of determinants of malnutrition among under-five children.
S.No Factors Category Adjusted
odds ratio
95% Confidence
interval P value
1. Father’s education Literate 1 7.98-15.67 <0.001
Illiterate 10.30
2. Mother’s education Literate 1 0.22-1.58 0.49
Illiterate 0.59
3. Mother’s occupation Home maker 1 0.12-0.99 <0.05
Working 0.35
4. Family members ≤4 1 0.65-4.13 0.29
>4 1.63
5. SES Class I,II,III 1 1.03-13.80 <0.05
Class IV,V 6.42
6. Mother’s nutritional status Underweight 1 0.46-3.53 0.63
Others 1.28
7. Any alcoholic Yes 1 0.09-3.15 0.49
No 0.54
8. Type of house Pucca 1 0.15-1.64 0.25
Semipucca/Kutcha 0.50
9. Piped water supply Yes 1 0.33-63.24 0.25
No 4.58
10. Toilet usage
Toilet 1
0.51-8.30
0.30 Open air
defecation 2.07
11. Mother’s age at birth ≤20 1 0.42-5.22 0.53
>20 1.48
12. Place of birth
Institutional
delivery 1 0.33-10.18 0.48
Home 1.83
13. Term of delivery Term 1 0.09-3.35 0.52
Pre-term 0.56
14. Birth weight Normal 1 1.23-9.43 <0.05
LBW 3.41
15. Breast feeding initiation Within 1 hr 1 2.58-80.44 <0.01
Above 1 hr 26.92
16. Calorie consumption
(% of RDA)
≥50 1
2.15-16.41 <0.05
<50 5.95
17. Protein consumption
(% of RDA)
≥50 1
0.95-9.90 0.61
<50 3.07
18. Illness in the past
month
Present 1
0.49-2.97 0.66
Not present 1.21
19. Attending ICDS Yes 1 0.68-4.21 0.25
No 1.70
20. Immunization status Appropriate 1 0.16-6.43 0.97
Not appropriate 1.02
Table 9 explored the factors identified from univariate analysis and confirmed those truly associated with malnutrition through multivariate logistic regression analysis. This reveals that:
1. The risk of malnutrition is 10.3 times higher in under-five children of illiterate fathers when compared to literate fathers, but there is no association with the educational status of mother. 2. Occupational status of mothers show significant
association with malnutrition of under-five children, where the factor that mothers employed for salary is 65% protective against malnutrition when compared to home-makers.
3. Socio-economic status is significantly associated with malnutrition after logistic regression. Under-five children belonging to Class IV and Class V
families according to Modified Prasad’s
classification have 6.42 times more risk of malnutrition when compared to Class I, Class II and class III families.
4. Low birth weight babies have 3.41 times more risk of suffering from malnutrition when compared to babies who are born normal or overweight.
5. Earlier initiation of breastfeeding, less than an hour after birth is protective for malnutrition in under-five children. Babies who are initiated with breastfeeding after the first hour after birth are 2.9 times more prone for malnutrition.
6. Consumption of calories less than 50% of the RDA proved to be a significant risk factor from the above analysis and protein consumption did not show any statistical association. Children who consume < 50% of recommended calories are nearly 6 times at risk of malnutrition.
Figure 2: Map showing the tribal areas in Periyanaickenpalayam block.
DISCUSSION
The study is to assess prevalence of malnutrition among 206 under-five children in 25 tribal hamlets of
Periyanaickenpalayam block, Coimbatore and to ascertain the determinants of malnutrition among them.
The possible risk factors selected in our study associated with malnutrition are age, sex, number of family members, mother’s education, father’s education, mother’s occupational status, father’s occupational status, socio-economic status, alcohol usage by family members, mother’s nutritional status, mother’s age at pregnancy, place of delivery of the child, term of delivery of the child, birth order of the child, birth weight of the child, time of initiation of feeding, exclusive breast-feeding, total breast-breast-feeding, energy and protein consumption of the child, Immunization status, ICDS utilization by the child, distance of health facility, recent illness, treatment for the illness, type of house, source of drinking water and toilet usage.
Data was collected using Pre tested semi structured Questionnaire by interview technique. The mothers of children of age group 0-59 months were informed about the study and each question was explained to gather the data and simultaneously height and weight of the child
and mother were measured. Anthropometric
measurements of the children and mothers like height and weight were measured using standardized calibrated instruments as per WHO recommendations.13
Prevalence of malnutrition
The study revealed overall prevalence of malnutrition was 51% and 49% of the children studied were “Normal” anthropometrically according to WHO classification. These 105 malnourished children consisted of 41.3% underweight, of which 11.2% are severely underweight. Prevalence of stunting is 32.5%, of which 6.3% are severely stunted. About 21.8% children are wasted and 6.8% are severely wasted among them.
The overall prevalence of underweight, Stunting and Wasting are 55%, 54% and 28% respectively among under-five children of tribal population in India according to NFHS-3 data.10 Our study showed a lower prevalence of all three indicators of malnutrition when compared with nationwide statistics.
In a study conducted among tribal under-five children in 9 states of India in 2007-08 among a total of 14,587 children by NIN, Hyderabad it was found that the overall prevalence of underweight was about 49%, of which 19% were severely underweight.14 The extent of overall stunting was about 51%, and of them, about 24% were severely stunted. About 22% of children had wasting, of which 7% had severe wasting. Only the degree of wasting is comparable to our study in this context, which may be due to acute causes of malnutrition.
Rao et al in a study conducted for Regional Medical Research Center for Tribals (ICMR study), Jabalpur, India revealed that 61.6% of preschool children were underweight, 51.6% were stunted and 32.9% were wasted.16 The study also revealed that severe degree (below -3 SD) of underweight, stunting and wasting in 27.8%, 30.3% and 6.5% children respectively.
According to Bisai et al, in a study conducted among pre-school children of Lodha tribal community of West Bengal, the Overall prevalence of underweight, stunting
and wasting was 33.9%, 26.1% and 19.4%,
respectively.17 Of these, 9.1%, 9.7% and 3.6% children were found to be severely underweight, stunted and wasted. These findings show a slightly lower prevalence when compared to our study.
Risk factors for malnutrition
Age of the child and malnutrition
No statistically significant association between different age groups of the under-five children and malnutrition. The findings are in variance to Meshram et al who has reported that there is increased risk of malnutrition in older children when compared with infants, whereas the results of Bisai et al is contradictory showing more risk of malnutrition in early childhood (1-3 years) when compared to older children (3-6 years).14,17
Sex of the child and malnutrition
There is no statistically significant difference in prevalence of malnutrition among both the sexes in our study. Meshram et al has concluded that male under-five children are more prone for underweight, stunting and wasting when compared to girl children.14 He had also reported an increased risk of malnutrition in boys when compared with girls, in a study conducted in Maharashtra.15
Number of family members and malnutrition
If the total number of family members exceeds 4 members, it acts as a risk factor for malnutrition in univariate analysis, not so in regression analysis. Meshram et al in India and Mekonnen et al in Ethiopia, the odds for malnutrition is increased in large families (>4 members) when compared to small families (≤4 members).14,18 Also there is no association between the main care-taker of the child whether it is the child’s mother or others in our study, and this finding correlates with the findings of Seetharaman, in a study done among slum under-five children in a part of South India.
Mother’s education and malnutrition
The unadjusted odd’s ratio for malnutrition and mother’s educational status shows that there is significant risk if the child’s mother is an illiterate in our study. Nationwide shows that maternal education has a strong inverse
relationship with all three measures of nutritional status according to NFHS-3, also Meshram et al al has reported increased risk of malnutrition in children of illiterate mothers.10,14
Father’s education and malnutrition
Illiteracy state of fathers came as very significant risk for malnutrition in under-five children in our study. The adjusted odds of malnutrition were 10.3 times more for children living with illiterate fathers. The results of our study was consistent with study done by Meshram et al in India and Islam et al in Bangladesh.14,19
Mother’s occupational status and malnutrition
The factor that mother’s working for salary came as a protective factor for malnutrition when compared to home-makers on logistic regression from our study. In our study all the fathers were waged workers and we could not elicit the association of malnutrition with father’s occupational status.
Socio-economic status and malnutrition
Children of families belonging to lower SES were at increased risk of malnutrition when compared to children of higher SES. The results were similar to studies done by Harishankar et al and Reddy et al in Uttar Pradesh.20,21
Alcohol consumption by any family member and malnutrition
The association of any member being an alcoholic in the family is not a significant risk factor according to the study. But a study done in Nairobi, Kenya involving 170 households has reported that a high percentage (38.1%) of children from alcohol consuming households were underweight, compared to children from non-alcohol consuming households (14.3%).
Mother’s nutritional status and malnutrition
Rayhan et al in Bangladesh shows that there is an increased risk of undernutrition in children of mothers
belonging to underweight category by BMI
classification.22 In contradiction to their findings our study shows that there is no significant association between mother’s nutritional status and children’s undernourishment by logistic regression.
Household characteristics and malnutrition
in univariate analysis but it did not turn out to be a risk factor after regression analysis.
A study done by Yadav et al concluded that severe and moderate levels of malnutrition was much higher among those with poor housing conditions even with the same level of dietary intake, whereas in spite of lower dietary intake. Birth order of the child and malnutrition.23
No significant association between birth order and malnutrition was observed in our study. According to NFHS-3 data, children of higher birth orders are much more likely to be underweight than children of lower birth orders.10
Birth weight of the child and malnutrition
The association of Low Birth Weight with malnutrition is very much significant in our study with an adjusted odd’s ratio of 3.41. Our findings are concordant with NFHS-3 which reveals that children with a history of low birth weight (<2.5 kg) are much more likely to be malnourished than other children (≥2.5 kg).10
Mother’s age at child birth and malnutrition
Mother’s age ≤20 during child delivery is not a significant risk factor for malnutrition taking into account of adjusted odd’s ratio in our study, but Sonowal, in a study conducted in Maharashtra has reported that prevalence of malnourishment in children delivered by mothers before 20 yrs is high (>12%) when compared to children delivered after 20 years (<8%).14
Place of child birth and malnutrition
Home deliveries, when compared to institutional deliveries are reported as a significant risk factor for malnutrition by Biswas et al in a community based study done in West Bengal.25 Home delivery children had 13 times greater risk to be underweight, 5 times greater risk to be stunted and 6 times greater risk to be wasted than their Institutional delivery counterparts. In our study this factor does not turn out to be a risk factor.
Term of delivery of the child and malnutrition
Under-five children from preterm delivery are not at risk of malnutrition when compared to children from normal or postterm delivery after logistic regression in our study. These results are contradictory to study done by Moster et al in Norway, who has reported that risk of poor physical and social growth is high in preterm children.26
Infant and young child feeding practices and malnutrition
Exclusive breast-feeding duration less than 6 months in children aged more than 6 months, total breast feeding duration less than 12 months in children aged more than 12 months, not giving other milk or milk substituent in
children >6 months and consumption of <50% of the recommended amount of calories and protein were significant risk factors for malnutrition according to our study.
Hien et al found that duration of exclusive breast feeding <6 months is a significant risk factor to underweight (OR=4.41) and stunting (OR=3.58) and time of initiation of breast feeds was significantly related to underweight (OR=2.54).27 His results are in consistency with our study. Results regarding total breast feeding duration by Majlesi et al in their study in rural Khorambad Province were also consistent with our study.28 10.5% of children breast fed for ≤1 year were underweight whereas only 4.5% of the children breast fed for 1-2 years were underweight as reported by them.
Precedent illness in the child and malnutrition
Suffering from any illness in the past fortnight and not treating the illness, both were significantly associated with under nutrition in our study. Meshram et al from Maharashtra, India reported that children who had suffered any illness in the past fortnight is at more risk for under nutrition.15
Immunization status and malnutrition
The factors that the child is not appropriately immunized for age and malnutrition are not significantly associated if we take into account of adjusted odd’s ratio in our analysis. Studies done by Devi et alin Andhra Pradesh, India and Mekonnen et al of Fogera District, Northwest Ethiopia has shown that under-five children who are appropriately immunized for age were protected against under nutrition.18,29
ICDS attendance and malnutrition
Statistically significant association between of ICDS utilization and malnutrition was obsreved our study, and non- utilization of ICDS services is found to be a protective factor for malnutrition.
Alim et al in a study conducted in Aligarh, Uttar Pradesh, has reported that out of 23.6% children who did not receive supplementary nutrition from ICDS, majority 14.3% of the total children were underweight.30 On the other hand, out of 76.4% children, who received supplementary nutrition from ICDS majority 62.7% of children were having normal weight for age and these results are in variance to our study.
CONCLUSION
improved totally by implementation of policy that already exists.
Funding: No funding sources Conflict of interest: None declared
Ethical approval: The study was approved by the Institutional Ethics Committee
REFERENCES
1. Jelliffe DB. The assessment of nutritional status of the community, WHO Monograph. 1966: 53. 2. Yigit EK, Tezcan S. Infant feeding practices and
children’s and women’ nutritional status. Ankara; 2004: 141-155.
3. Food and Agriculture Organization Staff. The State of Food Insecurity in the World, 2002: Food Insecurity: When people Live with Hunger and Fear Starvation. Food and Agriculture Organization of the United Nations 2002; 6.
4. World health organization, global database on malnutrition. Available at: http://www.who.int/ nutgrowthdb/en/. Accessed on 3 August 2017. 5. The Silent Emergency. State of World’s Children
1998. Focus on Nutrition. UNICEF.
6. Sachdev HPS. Assessing child malnutrition-some basic issues. Bull Nutr Foundations India. 1995;16:1-5.
7. Haq MN. Age at menarche and the related issue: A pilot study on urban school girls. Journal of Youth and Adolescence. 1984;13(6):559–67.
8. Karim A, Chowdhury AKMA, Kabir M. Nutritional status and age at secondary sterility in rural Bangladesh. J Biosocial Sci. 1985;17(4):497–502.
9. Onis MD, Frongillo EA, Blossner M. Is
malnutrition declining? An analysis of changes in levels of malnutrition since 1980. Bulletin of WHO, 2000;78 (10):1222-33.
10. National Family Health Survey (NFHS-3), 2005-06, National Report, International Institute of Population Sciences, Mumbai.
11. Deshmukh PR, Dongre AR, Gupta SS, Garg BS.
Newly developed WHO growth standards;
Implications for demographic surveys and child health programs. Indian J Pediatr. 2007;74;987-90. 12. Dietary Guidelines for Indians - A Manual. National
Institute of Nutrition, Hyderabad; 2011: 89-90. 13. Physical status: The use and interpretation of
anthropometry – Report of WHO expert committee, Geneva: World Health Organization; 1995: 263-308.
14. Meshram II, Arlappa N, Balakrishna N, Rao M K, Laxmaiah A, Brahmam GN. Trends in the prevalence of undernutrition, nutrient and food intake and predictors of undernutrition among under five year tribal children in India. Asia Pac J Clin Nutr. 2012;21(4):568-76.
15. Meshram II, Arlappa N, Balakrishna N,
Mallikharjuna Rao K, Laxmaiah A, Brahmam GN. Prevalence and Determinants of Undernutrition and
its Trends among Pre-School Tribal Children of Maharashtra State, India. J Trop Pediatr. 2012;58(2):125-32.
16. Rao VG, Yadav R, Dolla CK, Kumar S, Bhondeley MK, Mahendra U. Under nutrition and childhood morbidities among tribal pre-school children. Indian J Med Res. 2005;122(7):43-7.
17. Bisai S, Bose K, Ghosh A. Prevalence of Undernutrition of Lodha Children Aged 1-14 Years of Paschim Medinipur District, West Bengal, India. Iranian J Pediatr. 2008;18:323-9.
18. Mekonnen HT, Tadesse and Kisi T. Malnutrition and its Correlates among Nutr Disorders Ther S. 2013;12:2161-509.
19. Islam MM, Alam M, Tariquzaman M, Kabir MA, Pervin R, Begum M, et al. Predictors of the number of under-five malnourished children in Bangladesh: application of the generalized poisson regression model. BMC Public Health. 2013;13:1.
20. Harishankar. Nutritional Status of Children under 6 years of Age. Indian J Prev Soc Med. 2004;35:3-4. 21. Reddy DCS, Singh K, Tiwari IC. Epidemiology of
Nutritional deficiency disorders among tribal pre-school children around Manikpur, Banda district, Uttar Pradesh. Indian J Prevent Social Med. 1984;15(1-2):57-62.
22. Rayhan MI, Khan MSH. Factors Causing
Malnutrition among under Five Children in Bangladesh. Pakistan J Nutr. 2006;5(6):558-62. 23. Yadav RJ, Singh P. Nutritional status and dietary
intake in tribal children of Bihar. Indian Pediatr. 1999;36:37-42.
24. Sonowal CJ. Factors Affecting the Nutritional Health of Tribal Children in Maharashtra Ethno Med. 2010;4(1):21-36.
25. Biswas S, Bose K. Association between place of delivery and under nutrition. Nutritional Segment: 2011.
26. Moster D, Lie RT, Markestad T. Long-Term Medical and Social Consequences of Preterm Birth. N Engl J Med. 2008;359:262-73.
27. Hien, Ngoc N, Hoa NN. Nutritional status and determinants of malnutrition in children under three years of age in Nghean, Vietnam. Pakistan J Nutr. 2009;8(7):958-64
28. Majlesi F, Nikpoor B, Golestan B. Growth chart study in children under 5 years old in rural area of Khoramabad province. Iranian J Public Health. 2001;30;(3):107-10.
29. Yasoda DP, Geervani P. Determinants of nutrition status of rural preschool children in Andhra Pradesh, India. Birth. 1994;36:24-6.
30. Alim F, Jahan F. Assessment of Nutritional Status of Rural Anganwadi Children of Aligarh under the ICDS (Integrated Child Development Services) and Rural Health. Stud Home Com Sci. 2012;6(2):95-8.
Cite this article as: Senthilkumar SK, Chacko TV,