Using MATLAB Graphical User Interface for
Signal Acquisition and Stream Processing
Agostino Giorgio1* & Alessio Melibeo2
1&2Dipartimento di Ingegneria Elettrica e dell’Informazione – Politecnico di Bari – Digital Electronics Lab
(eledigilab), Via E. Orabona, 4 70125 Bari, ITALY
*Corresponding Author E-mail: [email protected]
Abstract: In this paper, we will describe how to build a MATLAB Graphical User Interface (GUI) for Data Acquisition from an arbitrary signal, and Stream Processing. The GUI allows easy data acquisition from devices connected to the PC, stream processing (live visualization on virtual oscilloscope and storage into a file), and playback over audio devices if it is an audio signal. The data exchange with signal sources was achieved using the Data Acquisition Toolbox™, the stream processing with the DSP System Toolbox™, and the creation of the Graphical User Interface with GUIDE™.
Keywords: Data Acquisition, DSP System Toolbox, Graphical User Interface, GUI, MATLAB
I. INTRODUCTION
This paper deals with the signal acquisition and processing using MATLAB® from The Mathworks, Inc, used in many electronic fields (e.g. safety systems, motor vehicles, interplanetary spacecrafts, medical devices, robot control, data acquisition and processing).
The aim is to learn basic concepts about the design of a GUI (Graphical User Interface) in Matlab environment for:
a) data acquisition
b) data stream processing, especially
- real-time plot visualization of the acquired data;
- storage of the acquired samples into a text file;
c) post-processing operations
- data transmission over I/O devices;
- storage of the acquired data into a file.
Therefore, the focus is especially on three toolboxes of MATLAB:
a) Data Acquisition Toolbox™, for data exchange with external hardware;
b) DSP System Toolbox™, for stream processing;
c) GUIDE™, for the building of a Graphical User Interface (GUI).
II. DATAACQUISITIONTOOLBOX™:REMINDERS
Data Acquisition Toolbox™ [1] allows a bi-directional data exchange between MATLAB® and many Input / Output devices, such as USB, PCI, PXI devices from National Instruments, Digilent, DirectSound, and Analog Devices.
- data acquisition from Input devices;
- data transmission over Output devices.
A. Building of a Session
The first thing we should do is to get a list of the acquisition hardware connected to the PC typing a daq.get Devices command [2]:
B. Data acquisition
1) Add input channels
The first step to acquire data is to add input channels linked to the desired device. It is necessary to specify the device ID, the channel ID and the measurement type
2) Acquisition start
After adding channels, we can really start the acquisition. We have 2 options:
- Foreground acquisition [6];
- Background acquisition [7].
a) Foreground acquisition
This is an exclusive priority task, which means that no other code line can be read in the meanwhile.
b) Background acquisition
The Foreground acquisition obviously does not allow a real-time control. For example, it is not possible to show a live plot of the acquired data. Moreover, it exclusively occupies MATLAB®, which is a problem in case of a great amount of data.
After adding a listener, the acquisition can start in 2 ways:
- limited acquisition;
- continuous acquisition.
C. Data transmission
1) Add output channels
The first step is again to add channels over which we want to send data:
2) Transmission Start
To start a transmission, we have to queue data (stored into a matrix) [12].
We have 2 transmission ways:
- Foreground transmission [13];
- Background transmission [14].
a) Foreground Transmission
b) Background Transmission
If we should do other operations in the meanwhile (e.g. stop the transmission) we need a Background transmission.
D. Summary
In this sub-section, there are example codes and a table summarising the most significance commands and their meaning.
1) Examples
a) Foreground audio data acquisition and transmission
This example code acquires audio data in Foreground from the Microphone for 6 seconds and then sends data over the PC Speakers:
% Session setup
s=daq.createSession('directsound'); % Input channels
addAudioInputChannel(s,'Audio1',1:2); % Acquisition duration
s.DurationInSeconds=6;
% The acquisition starts typing ‘1’ i=input('Press 1 to start recording\n');
if i==1
disp('Starting...');
% Data stored into a matrix ‘audio’ audio=startForeground(s);
disp('Done');
end
% The transmission starts typing ‘1’ i=input('Press 1 to play\n');
if i==1
% Output channels
addAudioOutputChannel(s,'Audio4',1:2); % Queue data
s.queueOutputData(audio); disp('Starting...');
% Foreground transmission startForeground(s);
disp('Done');
end
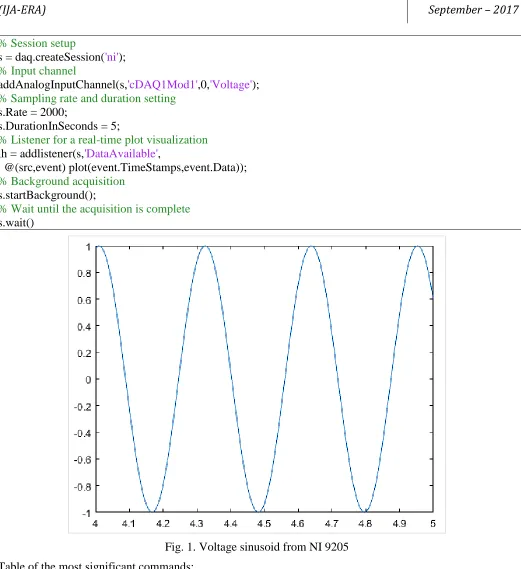
b) Voltage data acquisition from the device NI 9205
% Session setup
s = daq.createSession('ni'); % Input channel
addAnalogInputChannel(s,'cDAQ1Mod1',0,'Voltage'); % Sampling rate and duration setting
s.Rate = 2000;
s.DurationInSeconds = 5;
% Listener for a real-time plot visualization lh = addlistener(s,'DataAvailable',
@(src,event) plot(event.TimeStamps,event.Data)); % Background acquisition
s.startBackground();
% Wait until the acquisition is complete s.wait()
Fig. 1. Voltage sinusoid from NI 9205
Table of the most significant commands:
daq.createSession
Syntax s = daq.createSession(‘vendor’)
Description Creation of an acquisition session to exchange data with a device from the manufacturer vendor.
Syntax addAnalogInputChannel(s,devID,chID, measureType)
Description Adds input channels (chID) to acquire measureType data from the device called devID.
addAudioInputChannel
Syntax addAudioInputChannel(s,devID,chID)
Description Adds input channels (chID) to acquire audio data from the device called devID. DurationInSeconds
Syntax s.DurationInSeconds = t Description The session will run for t s. Default Value 1 s
Rate
Syntax s.Rate = f
Description Sampling rate of f samples per second.
Default Value It depends on the acquired data type. An audio session, for example, acquires 44100 samples/s.
IsContinuous
Syntax s.IsContinuous = true/false
Description Defines if the acquisition is continuous or not. Default Value false
addAnalogOutputChannel
Syntax addAnalogOutputChannel(s,devID,chID, measureType)
Description Adds output channels (chID) to transmitt measureType data over the device called devID.
addAudioOutputChannel
Syntax addAudioOutputChannel(s,devID,chID)
Description Adds output channels (chID) to transmitt audio data over the device called devID. queueOutputData
Syntax s.queueOutputData(data)
Description Preliminar operation for data transmission: we add to the session s a matrix/array data to send.
startForeground
Syntax startForeground(s)
Description Starts the Foreground operations for the session s. startBackground
Syntax startBackground(s)
Description Starts the Background operations for the session s. Requires a listener. addlistener
Syntax l=addlistener(s,event,@function)
Description Adds a listener to the session s which executes a function when an event occurs. Wait
Description It stops the reading of the following code lines until the Background session operations are done.
Anonymous Function
Syntax @(src,event) % Operations
Description
It is defined into a listener. It needs 2 input variables: src = the session which the listener is linked to; event = structure with 3 fields:
Data, matrix MxN (num. of samples x num. of channels) with the incoming data; TimeStamps, array Mx1 with all the sampling instants;
TriggerTime, absolute time of triggering.
III. DSPSYSTEMTOOLBOX™:REMINDERS
The DSP System Toolbox™ [16] is specialized in data Stream Processing [17]. A. Stream Processing
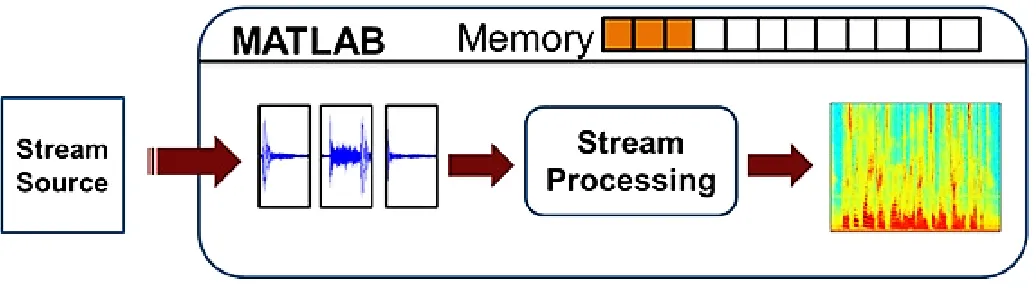
In many applications, it is required a live monitoring of data, so we need the Stream Processing procedure, which means to:
- divide the incoming data into frames;
- acquire and store only a single frame at a time;
- process the acquired frame before the next one arrives.
Fig. 2 shows the scheme of the stream processing
Fig. 2. Stream-processing main scheme
Thus, the Stream Processing procedure allows a real-time control over the data. For example, we may want a real-time plot visualization of the ECG of a patient. We can do that dividing the signal into packets and visualize on screen one packet at a time.
In addition, there is an advantage in the memory usage: in fact, only a single frame is acquired and it is fully processed before the next one arrives. In this way, only a small amount of data should be handled at a time.
B. System Objects™
a text/audio file, or turning MATLAB® into a virtual oscilloscope for a real-time plot or a spectrum visualization.
C. Example codes
1) Example n. 1
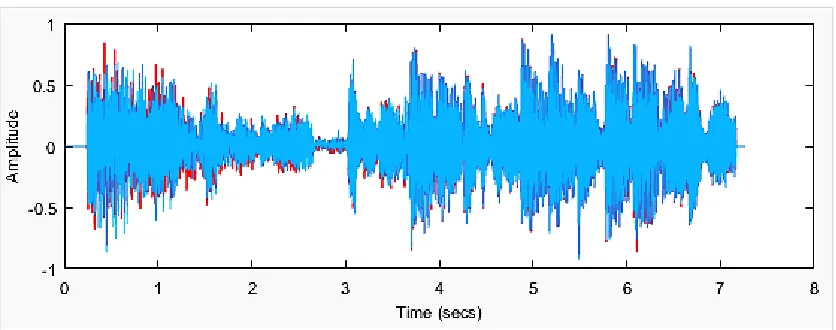
The following code imports an audio.mp3 file into a matrix called data, it stores the acquired data into an audio.txt file and shows a real-time plot on a virtual oscilloscope (Fig. 3). Then, it reads the samples from the audio.txt file and generates an audio.wav file:
% System Objects creation
AudioReader=dsp.AudioFileReader('Filename', 'audio.mp3');
TxtWriter=dspdemo.TextFileWriter('Filename', 'audio.txt');
TxtReader=dspdemo.TextFileReader('Filename', 'audio.txt');
TimeScope=dsp.TimeScope('YLimits',[-1,1],
'TimeSpan',4,'SampleRate',AudioReader.SampleRate); TimeScope.BufferLength=2*TimeScope.SampleRate*...
TimeScope.TimeSpan;
AudioWriter=dsp.AudioFileWriter('Filename', 'audio.wav');
% Importing of 'audio.mp3', generation of 'audio.txt' and TimeScope visualization
while (~isDone(AudioReader))
data=step(AudioReader); step(TxtWriter,data); step(TimeScope,data);
end
release(TxtWriter); release(TimeScope); release(AudioReader); % Reading of 'audio.txt' and storage of
'audio.wav'
while (~isDone(TxtReader))
data=step(TxtReader); step(AudioWriter,data);
end
Fig. 3. Real-time plot on virtual oscilloscope
2) Example n. 2
In this example, 2 sinusoids (having frequencies respectively of 50Hz e 60Hz) are generated using the dsp. Sine Wave [23] System Object™, the samples are stored into a sin.txt file; then, the file sin.txt is read and the acquired data is shown on a virtual oscilloscope (Fig. 4) [24].
% TxtWriter
TxtWt=dspdemo.TextFileWriter('Filename','sin.txt'); % Sinusoid with dsp.SineWave S.O.
fs=8000; f=[50,60]; frameLength=32;
SinWv=dsp.SineWave('Frequency',f,'SampleRate',fs, 'SamplesPerFrame',frameLength);
% Run a number of iterations to create .txt file tmax=10; t=(0:1/fs:tmax-1/fs)'; N=length(t); numCycles=N/frameLength;
for k=1:numCycles
dataFrame=step(SinWv); step(TxtWt,dataFrame);
end
% Release
release(TxtWriter); release(SineWave); % TxtReader and TimeScope
TxtRd=dspdemo.TextFileReader('Filename','sin.txt', 'SamplesPerFrame',frameLength);
TimeScope=dsp.TimeScope('YLimits',[-1,1],...
'TimeSpan',0.05,'SampleRate',fs, ...
'ShowGrid',true);
% Read from .txt and visualize TimeScope
while (~isDone(TxtRd))
dataFrame=step(TxtRd); step(TimeScope,dataFrame);
end
Fig. 4. Real-time plot of the generated sinusoids
IV. GUIDESIGNWITHMATLABGUIDE™
In many applications, it may be required to build a Graphical User Interface (GUI) with GUIDE™ MATLAB tool, to make the product easily accessible to the final user [25].
A. GUIDE™ Overview
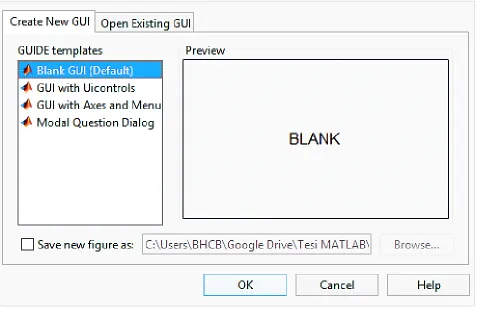
The first step is to open GUIDE™ typing guide on the MATLAB Command Window. Now we have to choose among various templates, as fig. 5 shows:
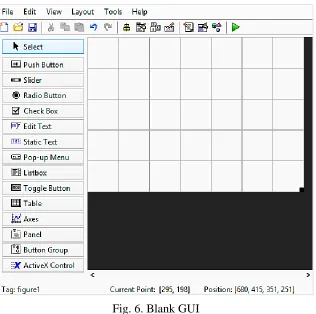
For example, if we choose a Blank template, we will get the situation in Fig. 6:
Fig. 6. Blank GUI
In Fig. 6, we can see on the left all the items that can be used to build a GUI. In this section, we will describe some general features of a GUI and its items.
B. Main features
Each item included in GUIDE™ has a list of properties, accessible by a double-click on it, as fig. 7 shows. We can notice:
Fig. 7. Main properties of a pushbutton
- String, the text written into/next to the selected item;
- Style, the type (pushbutton, checkbox, editable text box, etc);
Clicking on the Save button, the source code is automatically generated. This code is divided into many functions:
- a GUI automatically generated function; do not edit:
function varargout = Example_GUI(varargin)
% Begin initialization code - DO NOT EDIT
- opening function, usually where variables and System Objects™ are defined:
% Executes just before Example_GUI is made visible.
function Example_GUI_OpeningFcn(hObject,
eventdata, handles, varargin) handles.output = hObject; % handles update
guidata(hObject, handles);
- output function:
% Outputs
function varargout=Example_GUI_OutputFcn(hObject,
eventdata, handles)
varargout{1} = handles.output;
- functions associated to the GUI items (here we can see a pushbutton function):
% --- Executes on button press in pushbutton1.
function pushbutton1_Callback(hObject, eventdata, handles)
1) Focus: hObject and handles
Each function has some input variables: hObject, handles, eventdata. However, we will focus on hObject and handles, because eventdata has not been implemented until the R2016b release of MATLAB®.
a) hObject
Every GUI item has an associated function in the source code; we will use the hObject syntax to refer to the selected object into its own function.
We need 2 commands to achieve a bi-directional interaction with an object: get and set. For example, let’s consider the syntax to get or set the content of an editable text box:
get, acquires the object’s state
get(hObject,’String’) ans =
Duration set, defines a custom state for the object
set(hObject,’String’,’Ciao’)
b) handles
With the handles structure it is possible to share data among callbacks.
get, acquires the object’s state
get(handles.edit1, ’String’)
ans = Duration set, defines a custom state for the object
set(handles.edit1,’String’, ’Ciao’)
The handles structure has another important application. In fact, when we define a new variable into a function, we cannot use it in other callbacks. In order to share variables (or even System Objects™ and sessions) among callbacks it is necessary to store them into the handles structure:
handles.a=5
handles.s=daq.createSession(‘ni’) handles.TimeScope=dsp.TimeScope
Storage of a variable, an acquisition session or a System Object™ into the handles structure.
guidata(hObject,handles)
Update of the handles structure, in order to use the stored data into other callbacks.
Let’s consider the following simple example. Button 1 generates a random number between 0 and 10, it stores it into the rand1 cell of the handles structure, Button 2 doubles it:
function pushbutton1_Callback(hObject, eventdata,handles)
handles.rand1=10*rand; a = handles.rand1
guidata(hObject,handles);
function pushbutton2_Callback(hObject, eventdata,handles)
b = (handles.rand1)*2
a = 9.0579 b = 18.1158
2) Pop-up Menu
A Pop-up Menu is used when the user should choose something among various options. The automatically generated code consists into 2 functions:
a) popupmenu1_CreateFcn: list initialization;
we can define the various choices typing a set command; this example shows how to generate a list with 2 options, Choice1 and Choice2:
function popupmenu1_CreateFcn(hObject, eventdata,
handles)
if ispc && isequal(get(hObject,'BackgroundColor'),...
get(0,'defaultUicontrolBackgroundColor')) set(hObject,'BackgroundColor','white');
end
% List generation
b) popupmenu1_Callback: operations done after a choice has been made; cellstr and contents commands together allow to get the choice made by the user and store it into the variable choice; the following if
defines a specific function associated to each choice:
function popupmenu1_Callback(hObject, eventdata, handles)
% Get the choice made and store into 'choice' contents = cellstr(get(hObject,'String')); choice=contents{get(hObject,'Value')};
if (strcmp(choice,'Choice1')) % Operations for Choice1
elseif (strcmp(choice,'Choice2')) % Operations for Choice2
end
3) Editable Text Box
It is used to allow the user to manually set some parameters:
- if we are into the edit1 associated function; get, acquires the object’s state
get(hObject,’String’) ans = Duration set, defines a custom state for the object
set(hObject,’String’,’Ciao’)
- if we are into another callback; get, acquires the object’s state
get(handles.edit1, ’String’)
ans = Duration set, defines a custom state for the object
set(handles.edit1,’String’, ’Ciao’)
4) Static Text
This text box cannot be modified by the user on the GUI. Its state can only be defined into the .m source Matlab code:
get, acquires the object’s state
get(handles.txt1, ’String’)
ans = Static Text Example set, defines a custom state for the object
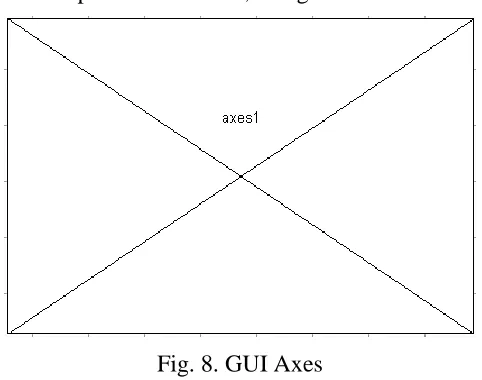
5) Axes
It simply reserves a GUI section for a plot visualization, as fig. 8 shows:
Fig. 8. GUI Axes
6) Checkbox
Using checkboxes we can do different operations depending on which they are selected or not. A checkbox (box1) has 2 properties, Value and String:
get → Value,acquires the logic state of the object (selected or not) get(handles.box1,’Value’)
ans = 0 (not selected) ans = 1 (selected) get → String, acquires the text shown next to the checkbox
get(handles.box1,’String’)
ans = Check Box set → Value, defines a custom logic state for the object (selected or not)
set(handles.box1,’Value’,0) set(handles.box1,’Value’,1)
set → String, defines a custom text to be shown next to the checkbox set(handles.box1,’String’,’Ciao’)
7) Pushbutton
The callback of a pushbutton is executed when the user clicks on it. In this example code, Button 1 generates a random number between 0 and 10:
function pushbutton1_Callback(hObject, eventdata, handles)
n=10*rand;
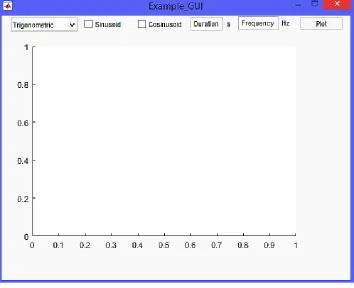
C. Example code to design a GUI
Fig. 9. Example GUI
1) GUI specifications
This interface gives the chance to plot various signals. In particular the user has to:
a) choose which type of signal he wants to plot, between:
- trigonometric (sinusoid, cosinusoid or both);
- other signals (sawtooth wave, square wave or both);
b) set the desired duration and frequency for the signals.
The GUI opening function defines Trigonometric as the default signal type, using an auxiliary variable handles.type:
function Example_GUI_OpeningFcn(hObject, eventdata,
handles,varargin) % Default settings handles.type='Trig'; handles.output = hObject; % handles update
guidata(hObject, handles);
2) Pop-Up Menu, Checkbox, Editable Text Box
function popupmenu1_CreateFcn(hObject, eventdata, handles)
if ispc && isequal(get(hObject,'BackgroundColor'),...
get(0,'defaultUicontrolBackgroundColor')) set(hObject,'BackgroundColor','white');
end
% List generation
set(hObject,'String',{'Trigonometric','Other'});
Now we have to setup the GUI according to the choice made. In case of Trigonometric, we will initialize 2 checkboxes Sinusoid e Cosinusoid; choosing Other, we will define 2 checkboxes Sawtooth and Square (square wave).
function popupmenu1_Callback(hObject, eventdata,
handles)
% Get the choice made and store into 'choice' contents = cellstr(get(hObject,'String')); choice=contents{get(hObject,'Value')};
% Set the checkboxes according to the choice made
if (strcmp(choice,'Trigonometric')) % In case of ‘Trigonometric’ handles.type='Trig';
set(handles.box1,'String','Sinusoid'); set(handles.box1,'Value',0);
set(handles.box2,'String','Cosinusoid'); set(handles.box2,'Value',0);
elseif (strcmp(choice,'Other')) % In case of ‘Other’ handles.type='Oth';
set(handles.box1,'String','Sawtooth'); set(handles.box1,'Value',0);
set(handles.box2,'String','Square'); set(handles.box2,'Value',0);
end
% Update the handles structure guidata(hObject,handles);
According to the choice made, the checkboxes are:
Trigonometric
Other
3) Pushbutton
The plot of the chosen signals appears when we click on the pushbutton Plot.
a) Preliminary phase
Firstly, we should acquire the duration (tmax) and the frequency (f) of the signal specified by the user into the editable text boxes; then, we will setup an array with all the sampling instants (every 0.01 seconds from 0 to tmax):
% Get duration and frequency
tmax=str2double(get(handles.edit1,'String')); f=str2double(get(handles.edit2,'String'));
t=(0:0.01:tmax); % Array with sampling instants
b) Acquisition of the choice made and generation of the signals
If the choice is Trigonometric we need to generate a sinusoid and a cosinusoid; if the choice is Other we should generate a sawtooth wave and a square wave, according to the following code:
% In case of Trigonometric
if (strcmp(handles.type,'Trig'))
% Generation of a sinusoid and of a cosinusoid a=sin(2*pi*f*t); b=cos(2*pi*f*t);
elseif (strcmp(handles.type,'Oth')) % Other
% Generation of sawtooth wave and of a square wave a=sawtooth(2*pi*f*t); b=square(2*pi*f*t);
c) Checkboxes state acquisition and plot generation
% Checkboxes state
c1=get(handles.box1, 'Value'); c2=get(handles.box2, 'Value');
if (c1==1 & c2==1)%Both subplot(2,1,1); plot(t,a); ylabel('Sinusoid'); subplot(2,1,2); plot(t,b); ylabel('Cosinusoid');
elseif (c1==1 & c2==0) % Sinusoid
subplot(1,1,1); plot(t,a);
ylabel('Sinusoid');
elseif (c1==0 & c2==1) % Cosinusoid
subplot(1,1,1); plot(t,b);
ylabel('Cosinusoid');
end
% Checkboxes state
c1=get(handles.box1, 'Value'); c2=get(handles.box2, 'Value');
if (c1==1 & c2==1)%Both subplot(2,1,1); plot(t,a); ylabel('Sawtooth'); subplot(2,1,2); plot(t,b); ylabel('Square Wave');
elseif (c1==1 & c2==0) % Sawtooth
subplot(1,1,1); plot(t,a);
ylabel('Sawtooth');
elseif (c1==0 & c2==1) % Square Wave
subplot(1,1,1); plot(t,b);
ylabel('Square Wave');
Thus, the whole function executed clicking on Plot is:
function pushbutton1_Callback(hObject, eventdata,
handles)
% Get the parameters from the text boxes tmax=str2double(get(handles.edit1,'String')); f=str2double(get(handles.edit2,'String')); t=(0:0.01:tmax);
if (strcmp(handles.type,'Trig')) % Sinusoid and cosinusoid a=sin(2*pi*f*t); b=cos(2*pi*f*t); c1=get(handles.box1,'Value'); c2=get(handles.box2,'Value'); if (c1==1 & c2==1) % Both signals subplot(2,1,1);
plot(t,a); ylabel('Sinusoid'); subplot(2,1,2);
plot(t,b); ylabel('Cosinusoid'); elseif (c1==1 & c2==0) % Sinusoid subplot(1,1,1);
plot(t,a); ylabel('Sinusoid');
elseif (c1==0 & c2==1) % Cosinusoid subplot(1,1,1);
plot(t,b); ylabel('Cosinusoid'); end
elseif (strcmp(handles.type,'Oth')) % Sawtooth and Square wave
a=sawtooth(2*pi*f*t); b=square(2*pi*f*t); c1=get(handles.box1,'Value');
c2=get(handles.box2,'Value'); if (c1==1 & c2==1) % Both signals subplot(2,1,1);
plot(t,a); ylabel('Sawtooth'); subplot(2,1,2);
plot(t,b); ylabel('Square Wave'); elseif (c1==1 & c2==0) % Sawtooth subplot(1,1,1);
plot(t,a); ylabel('Sawtooth');
elseif (c1==0 & c2==1) % Square Wave subplot(1,1,1);
plot(t,b); ylabel('Square Wave'); end
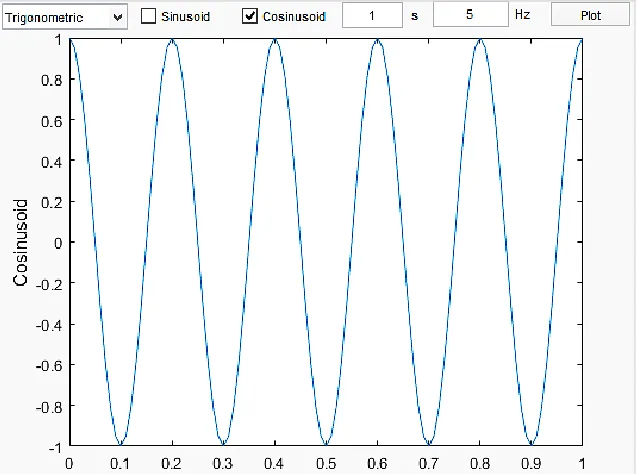
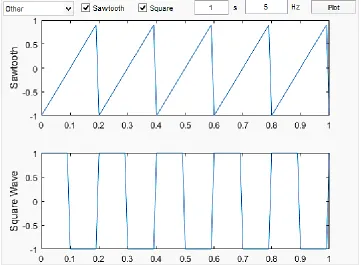
4) Screenshots (Duration 1s, Frequency 5Hz)
The resulting plots are shown in the following figures where the correspondence between the selected options and the plotted signals appears.
Trigonometric signals
a. Sinusoid:
Fig. 10. Plot of a sinusoid signal from the designed GUI
b. Cosine:
c. Both trigonometric signals:
Fig. 12. Plot of both of them sinusoid and cosine signals, from the GUI
Other signals
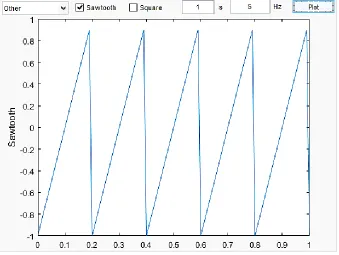
a. Sawtooth wave:
b. Square wave:
Fig. 14. Plot of the square wave form the GUI
c. Both:
V. CONCLUSIONS
In this tutorial paper have been described the main tools of MATLAB to design a GUI to perform data acquisition and processing. The focus is on the MATLAB GUIDE plug-in, DSP toolbox and Data acquisition toolbox. The design of a GUI is very useful to develop information systems for many consumer application and for research purposes [27].
Conflict of interest: The authors declare that they have no conflict of interest
Ethical statement: The authors declare that they have followed ethical responsibilities
REFERENCES
[1] Available at: https://www.mathworks.com/products/daq.html
[2] Available at: https://it.mathworks.com/help/daq/ref/daq.getdevices.html [3] Available at: https://it.mathworks.com/help/daq/ref/daq.createsession.html [4] Available at: https://it.mathworks.com/help/daq/ref/addanaloginputchannel.html [5] Available at: https://it.mathworks.com/help/daq/ref/addaudioinputchannel.html [6] Available at: https://it.mathworks.com/help/daq/ref/startforeground.html#bt960af-2 [7] Available at: https://it.mathworks.com/help/daq/ref/startbackground.html#bt9z7gd-3 [8] Available at: https://it.mathworks.com/help/daq/ref/dataavailable.html
[9] Available at: https://it.mathworks.com/help/daq/ref/iscontinuous.html
[10] Available at: https://it.mathworks.com/help/daq/ref/addanalogoutputchannel.html [11] Available at: http://it.mathworks.com/help/daq/ref/addaudiooutputchannel.html [12] Available at: https://it.mathworks.com/help/daq/ref/queueoutputdata.html
[13] Available at: https://it.mathworks.com/help/daq/ref/startforeground.html#bt960af-3 [14] Available at: https://it.mathworks.com/help/daq/ref/startbackground.html#bt9z7gd-4
[15] Available at: https://it.mathworks.com/help/daq/examples/acquire-continuous-and-background-data-using-ni-devices.html
[16] Available at: https://it.mathworks.com/products/dsp-system.html
[17] Available at: https://it.mathworks.com/discovery/stream-processing.html [18] Available at:
https://it.mathworks.com/help/dsp/gs/what-are-system-objects.html?searchHighlight=system%20objects
[19] Available at: https://it.mathworks.com/help/dsp/gs/system-objects-methods.html [20] Available at: https://it.mathworks.com/help/dsp/ref/dsp.audiofilereader-class.html [21] Available at: https://it.mathworks.com/help/dsp/ref/dsp.audiofilewriter-class.html
[22] Available at: https://it.mathworks.com/help/dsp/ref/dsp.timescope-class.html#zmw57dd0e292591 [23] Available at: https://it.mathworks.com/help/dsp/ref/dsp.sinewave-class.html
[24] Available at: https://it.mathworks.com/help/dsp/examples/creating-new-kinds-of-system-objects-for-file-input-and-output.html#zmw57dd0e386
[25] Available at: https://it.mathworks.com/discovery/matlab-gui.html
[26] Available at: https://it.mathworks.com/videos/handles-and-other-inputs-to-guide-callbacks-97328.html [27] A. Giorgio, “Design of an FPGA-based Embedded System for a reliable loading of multichannel data in the