Genetic diversity in a Poincianella pyramidalis
(Tul.) L.P. Queiroz population assessed by
RAPD molecular markers
K.S. Belarmino, M.M. Rêgo, R.L.A. Bruno, G.D.A. Medeiros, A.P. Andrade and E.R. Rêgo
Centro de Ciências Agrárias, Universidade Federal da Paraíba, Campus II, Areia, PB, Brasil
Corresponding authors: K.S. Belarmino / M.M. Rêgo E-mail: karialane@hotmail.com / mailsonrego@icloud.com
Genet. Mol. Res. 16 (3): gmr16039663 Received March 7, 2017
Accepted April 11, 2017 Published August 31, 2017
DOI http://dx.doi.org/10.4238/gmr16039663
Copyright © 2017 The Authors. This is an open-access article distributed under the terms of the Creative Commons Attribution ShareAlike (CC BY-SA) 4.0 License.
ABSTRACT. Poincianella pyramidalis (Tul.) L.P. Queiroz is an
endemic Caatinga (Brazilian savannah biome) species that has been exploited for different purposes, although information is necessary about still existing natural populations. The objective of this study was to evaluate the genetic diversity among 20 P. pyramidalis individuals occurring in a population localized in the Caatinga biome of Paraíba State, aiming at seed collection, using RAPD markers. For the DNA
extraction, young shoots of the individuals were used, and amplification
was carried out using 20 primers. The obtained markers were converted to a binary matrix, from which a genetic dissimilarity matrix was built
using the arithmetic complement of Jaccard’s coefficient, and the dendrogram was built by the UPGMA analysis. No amplified fragment
high genetic diversity, originating twelve groups from the UPGMA hierarchical cluster analysis. Based on the results, individuals 09 and 17 can provide plant material for the evaluation of the physiological performance of P. pyramidalis seeds, and the set of individuals of this population has a high genetic diversity that characterizes them as adequate matrices for projects of restoration and conservation of the seed species.
Key words: Catingueira; Forest species; Molecular analysis; Variability
INTRODUCTION
Considered the largest and most important ecosystem of the Brazilian Northeast, the Caatinga biome occupies approximately 60% of its area, extending across semi-arid climate regions. It can be found in part of the States of Ceará, Rio Grande do Norte, Paraíba, Pernambuco, Alagoas, Sergipe, Piauí, Bahia, and a small portion of northern Minas Gerais
(Andrade et al., 2005). Scientific research has shown that this ecosystem has a significant
number of endemic species that should be considered biological heritage of inestimable value (Sampaio et al., 2002).
Among the various Caatinga species, many of which are used in forest exploration, is Poincianella pyramidalis, a noteworthy xerophilic, deciduous plant belonging to the family Fabaceae, widely used for wood supply for timber and charcoal; herbage for cattle; in popular medicine; and for forest restoration (Maia, 2004).
Because of its many uses and ecological importance, P. pyramidalis was included by
the Brazilian Ministry of the Environment in the unified list of priority species for the Caatinga
biome (Pareyn, 2010). However, there is still a lack of information on several aspects related to this species, e.g., studies involving the genetic diversity of natural populations of the species that can provide a basis for seed conservation, genetic breeding, and seed collection programs.
With the exploitation of natural resources, especially tree species, and the opening of new areas for agriculture, native forests have undergone a fragmentation process and are being reduced to very small portions concerning their original areas (Rego et al., 2009). This fact leads to loss of biodiversity in these habitats and environmental imbalances such as ecological changes, interfering with the succession dynamics in these communities.
According to Turchetto-Zolet et al. (2012), some plant species are not uniformly distributed in a region, but rather dispersed across different areas. Therefore, studies involving such species contribute to a better understanding of the evolutionary history of a given region and its biodiversity. Moreover, they can provide information about their genetic structure,
helping to identify the barriers to the gene flow.
At present, there is a considerable number of molecular markers, and the choice of one or another depends on some factors. In cases when no access to technologies such as the previous sequencing of the genome are available, for instance, molecular markers of an arbitrary sequence can be fast and easily used to initiate the evaluation of genetic diversity of plant resources (Velasco-Ramírez et al., 2014).
(Fr. Allem.) A.C. Smith, Myracrodruon urundeuva (M. Allem.), Schinopsis brasiliensis Engl. (Santos et al., 2007), and Ziziphus joazeiro Mart. (Gois et al., 2014). However, studies in this
scientific field in Caatinga populations are still incipient, given the importance of conserving
their biodiversity due to the environmental degradation scenario that culminates in impaired genetic potential of its plant species.
Given the described situation, this study was carried out to evaluate the genetic diversity among P. pyramidalis individuals from a natural Caatinga population aiming at seed collection and forest restoration.
MATERIAL AND METHODS
Characterization of the collection area
Twenty P. pyramidalis were collected, selected, and then georeferenced by the tracking method. The individuals are localized in the municipality of Soledade, State of Paraíba, Brazil (7°7'22''S and 36°19'33''W, 535 m asl) (Figure 1). The area has a predominantly mildly undulating relief.
The climate of the region is hot and dry and, according to Köppen (1948), it is a semi-arid BS’h subtype. Average annual precipitation is 500 mm; maximum and minimum temperatures are 31° and 16.7°C, respectively, and air relative humidity varies slightly around 65%.
Figure 1. Scatter plot of 20 Poincianella pyramidalis individuals [Adapted from Lima (2014)].
Plant material conservation and DNA extraction
After collection, stakes were transferred to the Laboratory of Seed Analysis, Center
containers filled with water to induce shoot emergence. Upon collection, leaflets (shoots) were kept
in a freezer for better preservation and then transferred to the Laboratory of Plant Biotechnology for DNA extraction, following the methodology proposed by Doyle and Doyle (1990).
DNA purification
Samples of genomic DNA of P. pyramidalis individuals were incubated in a water bath at 37°C, with the DNA at a 1:1/2 RNAse (40 ng/mL; v:v) ratio, for 12 min. After that, 1:10 5 M NaCl was added, followed by 2/3 of the volume of cold isopropanol, and samples were kept at -20°C for 2 h. After the incubation period, samples were centrifuged for 10 min at 14,000 rpm. The supernatant was removed, and microtubes were washed twice with 70% and once with 95% ethanol and centrifuged at 14,000 rpm for 2 min per wash. Next, the supernatant was discarded carefully, and microtubes were kept at room temperature for total
evaporation of the ethanol; the precipitate was resuspended in 40 μL TE buffer.
DNA quantification
To estimate the amount and integrity of DNA, the material underwent a 0.8% agarose gel electrophoresis process. Aliquots of each DNA sample were applied to the gel wells, and the concentration of the samples was estimated by visually comparing the intensity of
fluorescence of DNA bands with that of the known standard. The run was performed in TAE
1X (0.04 M Tris-acetate and 1 mM EDTA) buffer at 80 V, and the gel, ethidium bromide-stained, was photographed under UV light in a Gel Logic 112 molecular imaging camera.
RAPD reaction
The DNA amplification reactions were performed using a final volume of 25 μL, composed of 23 μL Master Mix (1X buffer + 3 mM MgCl2 + 200 mM dNTP + 1 mM primer + 1 U Taq DNA polymerase) and 2 μL genomic DNA (50 ng) of the sample.
The following 20 decamer primers (Operon Technologies Inc., Alameda, CA, USA) were used to obtain the RAPD markers: OPAT-01, OPAT-02, OPAT-03, OPAT-04, OPAT-05, OPAT-06, OPAT-07, OPAT-08, OPAT-09, OPAT-10, OPAT-11, OPAT-12, OPAT-13, OPAT-14, OPAT-15, OPAT-16, OPAT-17, OPAT-18, OPAT-19, and OPAT-20. These primers were chosen
based on the polymorphism and their efficiency on studies of genetic diversity of two species
of the genus Aspidosperma (Apocynaceae) (Torezan et al., 2005; Bezerra, 2014).
Amplification reactions were performed in a thermocycler, with the following program:
initial denaturation at 94°C for 3 min; 40 cycles, each consisting of the following sequence:
15 s at 94°C, 30 s at 34°C, and 60 s at 72°C. After the 40th cycle, a final extension step was performed at 72°C for 7 min. The amplification products were separated by electrophoresis in
a horizontal chamber containing 0.5X TBE buffer for 1 h, on 1.5% agarose gel, at 80 V.
Genetic diversity
of Jaccard’s (1908) similarity coefficient. The matrix of genetic distances was used for the
cluster analysis by the dendrogram, using the UPGMA (unweighted pair group method with arithmetic mean) hierarchical clustering analysis. For the dendrogram cut, we adopted the criterion proposed by Mojena (1977), which is based on the relative size of the fusion levels
(distances) in the dendrogram. We also calculated the cophenetic correlation coefficient and
performed a principal component analysis, which was based on the matrix of genetic distances, arranging the individuals in a three-dimensional scatter plot. All analyses were performed using the Genes software (Cruz, 2016).
RESULTS
In the RAPD analysis, of the 20 primers used, 14 generated 846 amplified bands and
94 polymorphic loci, and the number of fragments per marker ranged from 2 (OPAT-04) to 9 (OPAT-02 and OPAT-11), averaging seven to eight loci per marker, e.g., OPAT-08 (Figure 2), resulting thus in 100% polymorphism in the loci of individuals from the studied population (Table 1). Primers OPAT-06, OPAT-10, OPAT-15, OPAT-17, OPAT-19, and OPAT-20 did not amplify any DNA fragment.
Table 1. RAPD markers, nucleotide sequence, total number of amplified bands, polymorphic and monomorphic loci, and total polymorphism in the Poincianella pyramidalis population.
Primer 5'→3' sequence Total No. of amplified bands No. of polymorphic loci No. of monomorphic loci Polymorphism (%)
OPAT-01 CAGTGGTTCC 66 8 0 100
OPAT-02 CAGGTCTAGG 94 9 0 100
OPAT-03 GACTGGGAGG 78 7 0 100
OPAT-04 TTGCCTCGCC 28 2 0 100
OPAT-05 ACACCTGCCA 83 8 0 100
OPAT-06 CCGTCCCTGA 0 0 0 0
OPAT-07 ACTGCGACCA 92 8 0 100
OPAT-08 TCCTCGTGGG 87 8 0 100
OPAT-09 CCGTTAGCGT 60 7 0 100
OPAT-10 ACCTCCGGTC 0 0 0 0
OPAT-11 CCAGATCTCC 69 9 0 100
OPAT-12 CTGCCTAGCC 60 6 0 100
OPAT-13 CTGGTGGAAG 44 4 0 100
OPAT-14 GTGCCGCACT 42 7 0 100
OPAT-15 TGACGCACGG 0 0 0 0
OPAT-16 CTCTCCGTAG 28 7 0 100
OPAT-17 AGCGACTGCT 0 0 0 0
OPAT-18 CCAGCTGTGA 15 4 0 100
OPAT-19 ACCAAGGCAC 0 0 0 0
OPAT-20 ACATCAGCCC 0 0 0 0
Total 846 94 0
Table 2 shows the dissimilarity matrix values based on the complement of Jaccard’s (1908) dissimilarity index used to develop the dendrogram by the UPGMA clustering analysis. The genetic distances among the 20 P. pyramidalis individuals ranged between 0.30 (individuals 09 and 17) and 0.97 (individuals 04 and 16); the mean genetic dissimilarity value observed in this population was 0.63 (63%).
Table 2. Genetic distance matrix among 20 Poincianella pyramidalis individuals.
Individuals 01 02 03 04 05 06 07 08 09 10 11 12 13 14 15 16 17 18 19 20 01 0 0.508 0.391 0.672 0.338 0.677 0.463 0.767 0.453 0.424 0.456 0.623 0.841 0.421 0.488 0.887 0.452 0.682 0.500 0.7422 02 0 0.462 0.653 0.582 0.659 0.545 0.725 0.569 0.579 0.586 0.615 0.864 0.594 0.600 0.878 0.615 0.667 0.556 0.721 03 0 0.700 0.426 0.660 0.467 0.740 0.456 0.397 0.479 0.667 0.808 0.486 0.571 0.885 0.500 0.690 0.507 0.759 04 0 0.612 0.610 0.678 0.639 0.578 0.638 0.614 0.627 0.703 0.623 0.629 0.977 0.625 0.591 0.517 0.641 05 0 0.656 0.471 0.781 0.400 0.500 0.385 0.680 0.815 0.368 0.476 0.894 0.419 0.642 0.405 0.738 06 0 0.709 0.552 0.708 0.667 0.714 0.714 0.677 0.687 0.764 0.912 0.694 0.659 0.677 0.647 07 0 0.788 0.500 0.424 0.539 0.667 0.852 0.420 0.472 0.885 0.543 0.754 0.529 0.736 08 0 0.774 0.769 0.829 0.778 0.680 0.788 0.809 0.926 0.783 0.618 0.787 0.733 09 0 0.394 0.410 0.634 0.846 0.373 0.423 0.908 0.309 0.672 0.343 0.730 10 0 0.466 0.629 0.811 0.406 0.458 0.865 0.415 0.758 0.471 0.692
11 0 0.608 0.843 0.380 0.427 0.900 0.387 0.623 0.329 0.754
12 0 0.800 0.597 0.603 0.837 0.638 0.640 0.582 0.628
13 0 0.821 0.769 0.963 0.759 0.722 0.803 0.679
14 0 0.372 0.846 0.392 0.671 0.378 0.708
15 0 0.848 0.356 0.597 0.365 0.712
16 0 0.847 0.923 0.869 0.935
17 0 0.656 0.386 0.695
18 0 0.641 0.658
19 0 0.721
20 0
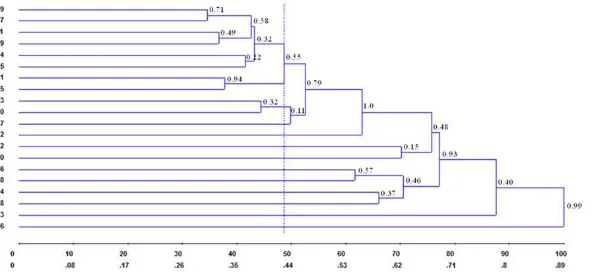
Cluster analysis by UPGMA based on the genetic matrices, the 20 P. pyramidalis individuals were allocated into twelve groups of genetic similarity. The cutoff point (41.98%)
was defined according to the criteria established by Mojena (1977); the consistency of
bifurcations generated by the dendrogram ranged from 11 to 100% among the assessed individuals (Figure 3), based on 100 bootstrap replicates.
The largest group was formed by individuals 01, 05, 09, 11, 14, 15, 17, and 19; within this group, greatest similarity was observed between individuals 09 and 17. The second group consisted of individuals 03 and 10, while the other clusters (ten) were formed separately, each containing only one individual (02, 04, 06, 07, 08, 12, 13, 16, 18, and 20). Forty percent of the individuals
were grouped in the first cluster, and despite being similar, they still have some genetic diversity.
The cophenetic correlation coefficient (Table 3), obtained from the genetic distance matrix and the cophenetic distance matrix, from the dendrogram, was high and significant (r = 0.94), demonstrating the consistency of the clusters. Cophenetic correlation coefficients
lower than 0.7 indicate the inadequacy of the cluster method (Rohlf, 1970). Distortion was 0.62%, and stress was 7.92%, both considered excellent values, according to the scale of
Kruskal (1964). These low distortion and stress level confirm the good representation of the
dissimilarity matrix in the form of the dendrogram.
Table 3. Cophenetic correlation coefficient between the distance matrix and the cluster method, generated from the analysis of genetic diversity among 20 Poincianella pyramidalis individuals via RAPD markers.
Cophenetic correlation Degrees of freedom t-value Distortion (%) Stress (%)
0.94** 188 39.95** 0.62 7.92
**Significant at P ≤ 0.01.
The three-dimensional distribution of the P. pyramidalis population via principal component analysis also evidences the large diversity existing in this population (Figure 4).
Seven groups were formed, the first and largest being composed of individuals 01, 03, 05, 07,
09, 10, 11, 14, 15, 17, and 19; the second 02; the third, 06 and 12; the fourth, 04 and 18; the
fifth 08 and 20; the sixth 13; and the seventh 16.
These results corroborate those obtained in the cluster analysis (UPGMA). The largest group originated by the dendrogram also remained clustered in the principal component analysis, except for the inclusion of three other individuals (03, 07, and 10); likewise, individuals 02, 13, and 16, which appeared separately in the cluster analysis, behaved in the same way when the principal component analysis was performed.
DISCUSSION
The population under study was characterized by having high genetic diversity. This high diversity level is of great relevance for the practice of selection, crossbreeding, and conservation and these plants can be used for the production of seedlings in forest restoration projects, whereby the most genetically divergent parents should be taken as the basis. High diversity indices were also reported by Zhang et al. (2013), who analyzed a population of Larix gmelinii and observed 97.35% polymorphic loci with the use of 23 RAPD markers.
The physiological quality of seeds originating from these same individuals in the studied population was evaluated by Lima (2014), who observed that higher germination percentages are achieved with seeds from plants 02, 03, 08, and 20 and also that greater vigor is obtained with seeds from plants 03 and 08. These individuals also displayed high genetic diversity both by the analysis of the genetic dissimilarity matrix and by the dendrogram generated by the UPGMA clustering analysis. This fact makes these plants important, and so they should be selected for their high genetic diversity coupled with ability to bear seeds with superior physiological quality, which will possibly result in individuals with great ability to respond to environmental changes, effective against competition with other plants, and with
efficient defense mechanisms against pests and/or pathogens.
Plants with desirable properties and genetically divergent in the population should be selected for seed collection since they are essential for the formation of lots with greater genetic diversity. Individuals considered genetically close can also have their seeds harvested and homogenized, forming single lots, and they can be used for the evaluation and comparison of physiological quality with other lots of seeds.
Individuals sharing the same group may be a reflection of the fragmentation process
that the Caatinga ecosystem has undergone, thus generating crosses among related individuals. One of the many factors contributing to the generation of unviable seeds and seedlings is inbreeding, especially in forest species, since most of them reproduce by cross-fertilization (Shimizu, 2007). Knowing the genetic variability existing in these populations affected by human activity can contribute to the development of an adequate management on these populations and recovery of degraded environments (Rabbani et al., 2012).
For the conservation and breeding of plants, it is essential that genetic variability is
present between individuals of the same species, between interspecific-cross groups, or even
between different species of the same genus. In this regard, knowledge of the genetic diversity is critical for the adoption of successful plant management and conservation strategies, especially in the case of a native species like P. pyramidalis (Mendes et al., 2014).
Researchers have been developing studies of genetic diversity in forest species, e.g., Gois et al. (2014) detected average genetic similarities of 54, 55, and 44%, in three populations of Ziziphus joazeiro Mart. with dendrograms generated by UPGMA, using 20 RAPD markers. Mendes et al. (2014) analyzed the genetic diversity between two species of the genus Poincianella through 11 RAPD markers and observed an average similarity of 59% among the ten accessions analyzed; the dendrogram construted allowed the separation of Poincianella into two major groups, where the accessions of P. pyramidalis were separated further into three subgroups.
09 was located far from both in the physical space, while 16 and 17 were side-by-side in the study area. A different case was observed for individuals 14, 15, and 17, which were spatially near and also shared the same genetic group, as also occurred for individuals 09 and 11. A distance of approximately 800 m separated individual 01 from 09 and 11, and, even so, according to the dendrogram analysis, they shared the same group. In summary, these trees were physically close and genetically dissimilar and physically distant and genetically similar; in other words, the population was characterized by individuals with different levels of relatedness, irrespective of the physical distance. This fact can be attributed mainly to the type of reproduction, seed dispersal mode, and types of pollination occurring in this species.
The P. pyramidalis flower is a hermaphrodite, and its reproductive apparatuses are
self-incompatible, with fruits formed only by manual cross-pollination and natural pollination; i.e., this species is characterized by the presence of strong cross-fertilization. Its main pollinators are bees (genera Xylocopa and Centris), occasionally butterflies, and uncommonly birds of the
species Coereba flaveola. This bird, just as the species Xylocopa and Centris, likely has a long
flight distance, dislocating across individuals with greater frequency and promoting gene flow
via pollen (Leite and Machado, 2009).
Based on the results, individuals 09 and 17, as well as 11 and 19, showed to be the most genetically similar, which means they can provide plant material for the creation of homogeneous lots of P. pyramidalis seeds. The set of individuals from the population is characterized by high genetic diversity, and the seeds generated by them are indicated for seedling production in restoration and conservation projects.
ACKNOWLEDGMENTS
The authors thank the Graduate Program in Agronomy at the Federal University
of Paraíba; Conselho Nacional de Desenvolvimento Científico e Tecnológico (CNPq), and Coordenação de Aperfeiçoamento de Pessoal de Nível Superior (CAPES) for financially
supporting this study.
REFERENCES
Andrade LA, Pereira IM, Leite UT and Barbosa MRV (2005). Análise da cobertura de duas fitofisionomias de caatinga, com diferentes históricos de uso, no município de São João do Cariri, Estado da Paraíba. Rev. Cerne 11: 253-262. Bezerra AKD (2014). Qualidade fisiológica de sementes e diversidade genética em uma população de Aspidosperma
pyrifolium Mart. Tese de Mestrado. Universidade Federal da Paraíba, Areia.
Cruz CD (2016). Genes software-extended and integrated with the R, Matlab and Selegen. Acta Sci. Agron. 38: 547-552.
https://doi.org/10.4025/actasciagron.v38i3.32629
Doyle JJ and Doyle JL (1990). Isolation of plant DNA from fresh tissue. Focus 12: 13-15.
Gois IB, Ferreira RA, Silva-Mann R, Pantaleão SM, et al. (2014). Variabilidade genética em populações naturais de Ziziphus joazeiro Mart. por meio de marcadores moleculares RAPD. Rev. Arvore 38: 621-630. https://doi.org/10.1590/S0100-67622014000400005
Jaccard P (1908). Nouvelles recherches sur la distribution florale. Bull. Soc. Vaud. Sci. Nat. 44: 223-270. Köppen W (1948). Climatologia. 1 st edn. Fondo de Cultura Econômica, México.
Kruskal JB (1964). Multidimensional scaling by optimizing goodness of fit to a nonmetric hypothesis. Psychometrika 29: 1-27. https://doi.org/10.1007/BF02289565
Leite AV and Machado IC (2009). Biologia reprodutiva da “catingueira” (Caesalpinia pyramidalis Tul. Leguminosae-Caesalpinioideae), uma espécie endêmica da Caatinga. Rev. Bras. Bot. Braz. J. Bot. 32: 79-88. https://doi.org/10.1590/ S0100-84042009000100008
variabilidade temporal das chuvas em áreas do Semiárido paraibano. Tese de Doutorado. Universidade Federal da Paraíba, Areia.
Maia GN (2004). Caatinga: árvores e arbustos e suas utilidades. 2 ed. D&Z Computação Gráfica, São Paulo.
Mendes RFM, Araujo Neto RB, Nascimento MPSBC and Lima PSC (2014). RAPD analysis of the genetic diversity among accessions of Fabaceous forages (Poincianella spp) from the Caatinga. Genet. Mol. Res. 13: 5832-5839.
PubMedhttps://doi.org/10.4238/2014.August.1.1
Mojena R (1977). Hierarquial grouping methods and stopping rules: an evaluation. . Comput. J. 20: 359-363. https://doi. org/10.1093/comjnl/20.4.359
Pareyn FGC (2010). A importância da produção não-madeireira na caatinga. In: Uso sustentável e conservação dos recursos florestais da caatinga. (Gariglio MA, Sampaio EVSB, Cestaro LA and Kageyama PY). Serviço Florestal Brasileiro, Brasília. 129-139.
Rabbani ARC, Silva-Mann R and Ferreira RA (2012). Variabilidade genética de Genipa americana L. pertencente ao baixo curso do Rio São Francisco. Rev. Arvore 36: 401-409. https://doi.org/10.1590/S0100-67622012000300002
Rego SS, Nogueira AC, Kuniyoshi YS and Santos AF (2009). Germinação de sementes de Blepharocalyx salicifolius (H.B.K.) Berg. em diferentes substratos e condições de temperatura, luz e umidade. Rev. Bras. Sementes 31: 212-220.
https://doi.org/10.1590/S0101-31222009000200025
Rohlf FJ (1970). Adaptative hierarquical clustering schemes. Syst. Zool. 19: 58-82. https://doi.org/10.2307/2412027
Sampaio EVSB, Giulietti AM, Virgínio J and Gamarra-Rojas CFL (2002). Vegetação e Flora da Caatinga. Associação Plantas do Nordeste, Recife.
Santos CAF, Oliveira VR, Kiill LHP and Sá IIS (2007). Variabilidade genética, com base em marcadores RAPD, de três espécies arbóreas ameaçadas de extinção no Semi-Árido brasileiro. Sci. For. 74: 37-44.
Shimizu JY (2007). Estratégia complementar para conservação de espécies florestais ativas: resgate e conservação de ecótipos ameaçados. Pes. Flor. Bras 54: 7-35.
Torezan JMD, Souza RF, Ruas PM, Ruas CF, et al. (2005). Genetic variabilithy of pré and post-fragmentation cohorts of Aspidosperma polyneuron Muell. Arg. (Apocynaceae). Braz. Arch. Biol. Technol. 48: 171-180. https://doi. org/10.1590/S1516-89132005000200002
Turchetto-Zolet AC, Cruz F, Vendramin GG, Simon MF, et al. (2012). Large-scale phylogeography of the disjunct Neotropical tree species Schizolobium parahyba (Fabaceae-Caesalpinioideae). Mol. Phylogenet. Evol. 65: 174-182.
PubMedhttps://doi.org/10.1016/j.ympev.2012.06.012
Velasco-Ramírez AP, Torres-Morán MI, Molina-Moret S, Sánchez-González JJ, et al. (2014). Efficiency of RAPD, ISSR, AFLP and ISTR markers for the detection of polymorphisms and genetic relationships in camote de cerro (Dioscorea spp.). Electron. J. Biotechnol. 17: 65-71. https://doi.org/10.1016/j.ejbt.2014.01.002
![Figure 1. Scatter plot of 20 Poincianella pyramidalis individuals [Adapted from Lima (2014)].](https://thumb-us.123doks.com/thumbv2/123dok_us/1287773.1635349/3.612.109.493.393.620/figure-scatter-plot-poincianella-pyramidalis-individuals-adapted-lima.webp)