E-ISSN 2308-9830 (Online) / ISSN 2410-0595 (Print)
A Decision Support Method for Finding Appropriate Information
on the Web Documents
Reza Mohamadi Bahram Abadi1 and Hassan Rashidi2
1
Department of Computer and Information Technology Engineering, Qazvin Branch, Islamic Azad University, Qazvin, Iran
2
Department of Mathematics and Computer Science, Allameh Tabataba'i University, Tehran, Iran
E-mail: [email protected], [email protected]
ABSTRACT
Today, the Web has been expanded dramatically and hence, looking up desired information in a vast ocean of available data is a difficult task for users. So, we need methods which using a targeted search, help users in making decisions for choosing the appropriate documents according the desired content. In presented information retrieval technique, web documents are introduced to the user as search results. To resolve this problem can be used semantic extraction. That conclusion is valid for extraction if related subject pages identified initially. Semantic extraction ontology is one of these methods. This paper puts to evaluation the extent of relationship between a Semi structured HTML and ontology using some statistical techniques. Then with calculate the density of the document and compared with the expected density ontology in an acceptable limitation, documents related with ontology predicted. Then with calculate the density of the document and compared with the expected density ontology in an acceptable limitation, documents related with ontology predicted. If calculations for the two cases of expected value with density and view value are within the required range, then ontology would be related. According to experimental Results within a 99% reliable range, shows that the recommended method's ability to achieve value recall 100% and precision 83% is able.
Keywords:Application Ontology, Web Documents, Information Filtering, Statistical Analysis.
1 INTRODUCTION
World Wide Web consists of a large number of Web documents. Users to access the desired documents, work ahead are difficult [1]. For that users can find information about the interest, they need targeted search methods to find valid data is felt. The main problem is that, most of the information in web pages for humans is understandable if the machine cannot understand the meaning of them [2]. If the Web pages designed as a semantic then semantic information extraction from those pages is easy. But now all the pages of World Wide Web have been implemented, as a semantic [3]. We must use the technology uses the web pages of contemporary meaning of the simulation. Therefore, we need intelligence program that can
read Web pages and data and communication between them to form into Structured [4]. Semantic extraction ontology is one of these methods. Extract information based on ontology is not affiliated web structure constants but also the detected documents described the content is dependent and in a specific field of knowledge is used [5].
For controlling could be among the vast and varied information on the web, before extraction of semantic documents about its relationship with the ontology to ensure [6]. In fact, filtering and separating documents, related or non-related from other documents, is related to search results for extraction of information will get better interest.
must be careful not to discard relevant documents and not to accept irrelevant documents [7].
In this paper, we offer an approach for recognizing whether a Web document is relevant for a chosen application of interest. specific domain ontology for web pages is defined. Then to determine the status of a sample document, its texts are matched with the ontology and then based on the results relation between document and ontology is decided [8].
The propose system is based on statistical techniques that has been implemented in three step. In step1, we used related ontology document to making a multiple linear equation. We can use this equation for two purposes:
Angle Prediction between document vector and ontology vector
Determine the weight and value of each of the independent variable (lexical object) in contrast to the dependent variable. In this paper we used second application.
In Step2, comparison between viewed value and expected value in a sample document and in Step3, calculation of document density, comparison of the expected density and viewed density in each record. This step is including four stages:
stage1: density Calculation, number of characters and records of a document.
stage2:Viewed density calculation for each lexical object in ontology in a document
stage3:Expected density calculated for each lexical object of ontology in document
Stage4: Comparison of two vectors, expected lexical object density and the viewed lexical object density.
After execute step2 if the calculations result is not within the acceptable range we can say that the document not related to ontology and don’t need to execute step3.
2 RELATED WORKS
Before semantic extraction from web documents text, we need to be sure of its relatedness to the scope of ontology. In the past years, different methods have been applied for diagnosing the type of document relation to ontology. One of the methods was the use of heuristics, (H1) density, (H2) expected value and (H3) classification on a diagram [9]. H1 measures the density of constants and keywords defined in O that appear in D. H2 uses the Vector Space Model, a Common information-retrieval measure of document relevance, to compare the number of constants expected for each object set, as declared in O, to the number of constants found in
D for each object set. H3 measures the occurrence of groups of lexical values found in D with respect to expected groupings of lexical values implicitly specified in O. In this method, machine learning is used to recognize the acceptable line for having a document within ontology. Upon calculation of the three heuristics on a sample document and evaluation of the results on the decision tree, one can state the idea on documents relation to ontology [9].
In 2001, Quan Wang posed the use of probabilistic retrieval model for distinguishing the type of documents relation to ontology. The three heuristics have been applied as used before, the difference lies in expected value heuristic, which is not calculated for the document in general [10]. Instead, the calculation is on expected value for lexical objects separately. In order to show the heuristics results on a document, vector is used with n+2 long. The two elements of vector including density value(y) and grouping (z) and other n variables including expected value for n number of lexical objects are in a sample documentD =
X X1, 2,..., Xn, y, z
.
For making decision on the type of document relation to ontology, we use logistic regression and probabilistic retrieval model. The degree of relation is shown using following formulas [11].
p R |X1,...,Xn, y, Z
sum = ln (1)
1- p R |X1,...,Xn, y, Z
1p R |X1, ...,Xn, y, Z = -sum (2)
1 + e
Considered the limit of probability for calculating (0<p<1) we can say the less difference in values out of above formulas, the more relation it has to ontology [11].
QuanWang used his experimental Results on the three types of different documents:
Ten related web site to the ontology (Table 1)
Ten nonrelated web site to the Ontology (Table2)
Eight similar web site to the ontology (Table 3) In the above tables extracted numbers of occurrences of the lexical objects of car ontology for any web document. These documents extracted from 10 different regions that cover 120 sites in the United States with 12 documents retrieved from each region [11]. In this article, we use these three sets in the proposed method implementation and experimental result.
model was applied for determining the type of document relation to ontology. Some other results showed, system suffers from some negative points.
Semantic extraction, most methods use such heuristics for distinguishing the document relation to ontology. In recommended method of this research, we use density heuristics and expected value for our
purpose. Of course, the two heuristics we apply for lexical objects. Also we calculate the view value and expected value for the density. Decision-making on document relation to ontology is based on comparison of view values and expected values within an acceptable limit.
Table 1: List of related website to ontology [11]
Occurrence numbers of the lexical objects of car ontology test set documents URL PhoneNr Feature Price Mileage Model Make Year 22 39 34 10 21 37 39 http://www.delmarvaclassfieds.com 25 26 58 7 63 51 30 http://www.thetelegraph.com 24 24 18 8 12 16 41 http://www.vermontclassifieds.com 12 18 8 4 6 6 12 http://www.ndweb.com 166 214 264 53 265 209 319 http://www.adn.com 51 116 73 21 44 74 128 http://www.hawaiisnews.com/cars 5 11 9 3 9 5 9 http://www.brewtonstandard.com 74 216 54 19 48 47 72 http://www.aikenstandard.com/ 35 25 8 9 15 13 37 http://adaeveningnews.com 14 22 11 4 12 14 12 http://www.tahoe.com
Table 2: List of non-related web site to ontology [11]
Occurrence numbers of the lexical objects of car ontology test set documents URL PhoneNr Feature Price Mileage Model Make Year 2 0 0 0 1 4 13 http://www.cs.byu.edu 0 3 0 0 0 0 1 http://www.dogpile.com 0 0 0 0 2 0 10 http://www.ecampus.com 7 29 0 0 3 3 25 http://www.cyberpages.com 72 10 9 17 63 15 295 http://www.ohio.com 11 0 8 2 0 0 6 http://www.crookstontimes.com 0 20 0 0 10 0 2 http://www.date-net.com 105 25 78 30 8 45 240 http://www.netbikes.yks.com 76 12 51 5 7 1 61 http://www.sunspot.net 0 15 10 0 6 11 5 http://www.internetclassiccars.com
Table 3: List of similar web site to ontology [11]
3 PRELIMINARIES
3.1 Application Ontology
To Provide theoretical interest for this article, we define a sample application as an ontology as a cognitive model. In fact, this model shows a real environment in a limited space. This system uses the two methods, graphics and text. They are both equivalent. Application Ontology interested is in connection with the domain of car-ads [12].
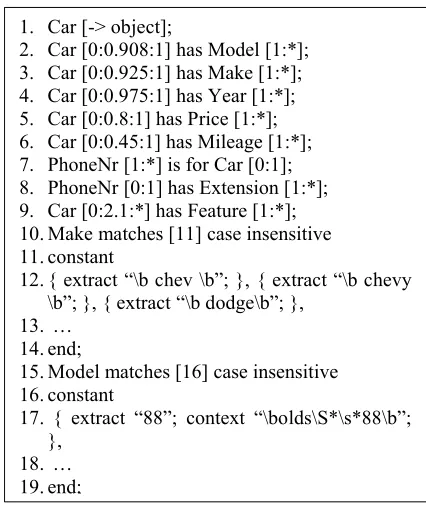
In the Fig. 1 shows a portion of the textual representation of the car-ads ontology, which includes all object and relationship sets, cardinality constraints (lines 1-9), and a few lines of its data frames (lines 10-19). This figure shows only three set of the regular expression. For the representation of a complete ontology of car-ads, we need to 165 regular expressions. In a textual view, the symbol [ object] shows the non-lexical object. In fact, the main title of ontology or ads is represented by this symbol. The min: max or min: ave: max, constraint specified next to the connection between an object set and a relationship set in a graphical representation is the participation constraint of the object set in the relationship set. min, ave and max denote the minimum, average, and maximum number of times an object in an object set can, or is expected to, participate in a relationship set, respectively, whereas * designates an unknown but finite maximum [13].
Number of times an object in an object set can participate in a relationship set. In the textual representation for the car-ads ontology, the participation constraints are listed from line 2 to line 9. Regular expressions consider some limits for lexical object. For example, lines 10 to 14 have constraints for the object make. Such that this object can be 10 characters maximum. The keywords in relation with considered object is defined in this section [14].
We can extract the related key words by using the data frame provided for ontology and by comparing the existing strings in the text and the regular expressions in the data frame.
3.2 Density Heuristic
A Web document D that is relevant to particular application ontology A should include many constants and keywords defined in the ontology. Based on this observation, we define a density heuristics. We compute the density of D with respect to O as follows [15]:
total number ofmatched charactersDensity D,O = (3)
total number of characters Where total number of matched characters is the
number of characters of the constants and keywords recognized by O in D, and total number of characters is the total number of characters in D [15].
3.3 Expected-Values Heuristic
We apply the VSM model to measure whether a multiple-record Web document D has the number of values expected for each lexical object set of application ontology O. Based on the lexical object sets and the participation constraints in O; we construct an ontology vector OV. Based on the same lexical object sets and the number of constants recognized for these object sets by O in D, we construct a document vector DV. We measure the relevance of D to O with respect to our expected-values heuristic by observing the cosine of the angle between DV and OV.
To construct the ontology vector OV, we (1) identify the lexical object-set names these become the names of the coefficients of OV, and (2) determine the average participation for each lexical object set with respect to the object set of interest specified in O these become the values of the coefficients of OV.
Car ontology vector Based on lexical object defined in the ontology is as follows:
u = 0.975, 0.925, 0.908, 0.45, 0.8, 2.1,1.15 The names of the coefficients of DV are the same as the names of the coefficients of OV. We obtain the value of each coefficient of DV by automatically counting the number of appearances of constant values in D that belong to each lexical object set. Observe that for document vectors we use the actual number of constants found in a document. To get the average (normalized for a single record), we would have to divide by the number of records—a number we do not know with certainty. Therefore, we do not normalize, but instead merely compare the cosine of the angles between the vectors to get a measure for our expected values heuristic.
As mentioned, we measure the similarity between an ontology vector OV and a document vector DV by measuring the cosine of the angle between them. In particular, use the Similarity Cosine Function defined in, which calculates the acute angle.
cos θ = P / N (4)
For example, we run the Expected-Values Heuristic on the two documents Da and Db (Fig. 2)
then we calculate the amount Cosine θ for each document. Initially, the number of values expected for each lexical object set of car ontology in the Da
and Db counted and presented as
= 16,10,12, 6,11, 29,15 va
, vb = 4, 0 , 0 , 2 , 8 , 0 ,11
vectors. In the first reviewed Da document, with thehelp car ontology vector
u = 0.975, 0.925, 0.908, 0.45, 0.8, 2.1,1.15 Calculated document optimized vector. We calculated the size of two vectors U and V.
u
2 2 2 2
(0.975) (0.925) (0.908) (0.45)
2 2 2
(0.8) (2.1) (1.15)
3.03
2 2 2 2 2 2 2 41.51
16 10 12 6 11 29 15
v a
Document optimized Vector is equal:
= (5)
vnorm
Document Vector Size Ontology Vector Size Document Vectore
(16,10 ,12 , 6,11, 29 ,15) =
va,norm 41.51 3.03
= (1.17, 0.73, 0.88, 0.44, 0.8, 2.12,1.1)
The inner product of two vectors U and Va,norm
calculated as book value.
,
, (0.975) (1.17) (0.925) (0.73)
(0.908) (0.88) (0.45) (0.44) (0.8) (0.8)
(2.1) (2.12) (1.15) (1.1) 9.17
a norm
P u v
Then we calculated the N value:
2 2 2 2
(1.17) (0.73) (0.88) (0.44)
, 2 2 2
(0.8) (2.12) (1.1) 3.0355
V a norm
. norm (3.03).(3.0355) 9.197
N u v
9.17
cos 0.997
9.197 p
N
Now we do calculations for the Db document. With
considering the Vb vector of this document, Cos θ is
equal:
p 1.02
cosθ = = = 0.11
N 9.2
3.4 Regression Analysis
One of the main goals of many statistical researches is to create Dependencies that provide prediction of one or more variables according to others. One of the tools that we can achieve a good relationship is regression [16]. Regression analysis is a statistical tool to study the relationship between a dependent variable and a set of independent variables [17]. If more information that is associated with the subject could be considered, we can correct the predictions. The most common linear equation can be used on the regression relations between the two variables for implementation is as follows:
= + + +... + (6)
μy| ,x x1 2,...,xn β0 β1x1 β2x2 βkxk
In the equation above, y is a random variable that we want to predict their values according to known values x1, x2… xk And β0,β1,β2,…,βk multiple
regression coefficients, are constants, which must be determined on the viewed data. One of the main conditions of multiple linear regression independent variables is linear independency [17]. In this paper, we use in an application Ontology the lexical objects as independent Variables used in multiple linear regressions.
Fig. 1. Car-ads ontology – textual
1. Car [-> object];
2. Car [0:0.908:1] has Model [1:*]; 3. Car [0:0.925:1] has Make [1:*]; 4. Car [0:0.975:1] has Year [1:*]; 5. Car [0:0.8:1] has Price [1:*]; 6. Car [0:0.45:1] has Mileage [1:*]; 7. PhoneNr [1:*] is for Car [0:1]; 8. PhoneNr [0:1] has Extension [1:*]; 9. Car [0:2.1:*] has Feature [1:*]; 10. Make matches [11] case insensitive 11. constant
12. { extract “\b chev \b”; }, { extract “\b chevy \b”; }, { extract “\b dodge\b”; },
13. … 14. end;
15. Model matches [16] case insensitive 16. constant
17. { extract “88”; context “\bolds\S*\s*88\b”; },
Last Updated: Wednesday, December 22, 1999 Select a category
Last Updated: Monday, January 24, 2000 12:19pm Cars for Sale
Apartment For Rent For Sale or Rent Lost or Found For Sale House For Rent DEPENDABLE CAR, 1989 Subaru SW. Auto,
AC, $1900 OBO. Call (336)835-8579. (61)
Apartment For Rent, ONE EFFICIENCY, 2 & 3 bdrm, all utilities Paid. Call 281-2051-
Factory Warranty, 1998 Elantra. Black 4 door W/tinted Windows. Auto, pb, Ps, cruise, am/fm cassette stereo. Excellent condition Pay off OBD.
Call (336)526-5444 anytime & leave message For Rent, HOUSING Solutions – Free TV cable furn. $60/wk - $ 210/mo. 281-4060. - For Sale. 1998 JD 455 mower, 60' deck. Call for price. Also, homemade GO-Cart. Call after 5:30 pm 218-281-1128.-
1994 HONDA ACCORD EX, Auto, power everything, jade green w/gold Package. Under 100 K miles. Call (336)526-1081.
For Sale or Rent, 10,000 SQ.FT. Office building. Handicap accessible. Call 281-3631.
1999 Grand AM 27,000 miles, silver, auto, still under warranty. $14,000. Call (336)366-499
Help Wanted, NOW HIRING full time and part time customer service representatives.
Advancement possible and weekly pay. '53 Chevy Bel Aire. All original, looks like new.
Serious inquiries only. $8500. Call (336)468-8924 after 4 pm.(44)
PART TIME AND Weekend help working with developmentally disabled adults. Call Melissa or Karen at 281-3872. -
Two GREAT CARS, 1973 MGB convertible. British racing green. Mags, New tires, 4-speed, 1 owner, excellent running condition. $4500. 1997 olds Cutlass Supreme. New white paint job W/
1/2 red Landau top, original Mags & new tires. REM-NORTHWEST Services, Inc. has a full time program Coordinator/Coordinator Position open in Crookston Working with four
developmentally disabled adults. Must have a high school diploma or equivalent One year experience serve people with developmental disabilities preferred. Applicant must be 18 year of age or older. Must have a valid driver's license and driving record that meets REM's insurability requirements. Insurance and benefits available. 95 FORD CONTOUR, 5-speed, great condition,
one owner, $5300. Call (336)526-8853 & leave message if no answer. (92)
Seized Cars from $500, Sports, luxury& economy cars, trucks, 4x4's utility and more. For current listings, call 1-800-311-5048 ext. 10012 (118) 1996 VW JETTA GL, 26,000 miles. 4 door, 5-speed, AC, sunroof, 1 owner. $11,000. Call (336)874-7317 anytime. (90)
REM-NORTHWEST Services, Inc. has full and part time Coordinator Positions available in Crookston, Working with citizens. Excellent benefits are offered including health, 401K and profit sharing for full and Part time employees working 20 hours.
'85 Buick Park Avenue. $500. Head may be cracked. Will run. Body good condition. Call (336) 526-2768. (85)
'95 Ford Thunderbird. Loaded, V-8, 45K, $6995. Call S&J at (336)874-3403 (68)
HOUSE For Rent, 3 BDFRM HOUSE $450/mo. 281-1970.22 STEEL BULDINGS, NEW, must sell. 40x60x14 was $17,500;
'96 Mercury Tracer. 4 door, 5 speeds, 34K, $4995. Call S&J at (336)874-3403. (69)
Lost or Found: Golden retriever about 4 months old Found 7miles south of Crookston
'88 Firebird. V8,5.0, ful injected, T-tops, 109,000 miles, red, runs great. $1880. Call (336)526-1164 anytime. (96)
(b) Items for sale advertisements retrieved from http://w`ww.crookstontimes.com (a) Car advertisements retrieved from
http://www.elkintribune.com/
Fig. 2. A car advertisement and a non-car advertisement Web document
4 IMPLEMENT RECOMMENDED
SYSTEM
We use the statistical techniques to determine the type of Ontology relationship with the sample document. Acceptable error rate of α=0.01 is
Documents relationship with the ontology will evaluate. In the fig. 2 shows two documents.
4.1 Step1: Using Related Ontology Document to Making Multiple Linear Regression Equation
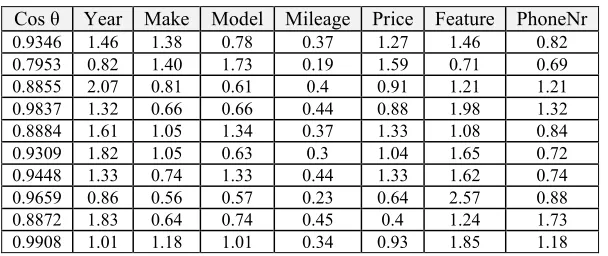
To start this step we need number of related document to ontology. For this purpose used information table1 that it is a set of related documents including ontology website in 10 different sites. In this table for each document, its corresponding document vector specified. We calculate the vector optimized of document by using heuristic of expected values and we calculate the angle between the document vector and ontology vector for each document by using formula 4. Calculation results listed in Table 5.
To create a model of relationship between lexical object of car-ads ontology we use the information obtained and we formed a multiple linear regression equation. For this purpose, we consider the lexical object car-ads ontology as independent variables and the angle between optimized vector of document and ontology vector as the dependent variable .List of lexical object in the document I, and the regression variables used shown in Table 5 then we form this regression equation (Yi is
depended variable and Xi1-Xi7 are independent
variable).
The SPSS software use to implement regression. We used the date of table 4 to create regression equation. After implement regression specified coefficient β to each lexical object (table 6).After defining the early step of the formation and regression orders, β coefficients belonging to each lexical object specified in the regression. Using multiple linear regression formula
= + + + ... +
yi β0 β1xi1 β2xi2 βkxikCoefficients
obtained in the final model the desired formula shown below:
y = 0.017 +0.104X1+ 0.101X2+ 0.098X3+ 0.054X4+ 0.082X5+ 0.224X6+ 0.12X7 (7) The above formula can use for two purposes:
1.Angle Prediction between document vector and ontology vector using multiple linear regressions. 2.Determine weight and value of each lexical
object
For example, we calculated angle between Da
vector from document of fig. 2 and ontology vector. This calculation implemented with Expected value heuristic in part 2.3 and equal is Cos θ=0.99. Now we implemented formula 7 for calculation Cos θ with using the optimized Da document vector. This
vector calculated in part 2.3 already.
= (1.17, 0.73, 0.88, 0.44, 0.8, 2.12, 1.1) va,norm
The vector value Va,norm placed in the formula 7 and
then y value is calculated.
y = 0.017 + (1.17 × 0.975) + (0.73× 925) + (0.88× 0.908) + (0.44 × 0.45) + (0.8× 0.8) + (2.12 × 2.1) + (1.1×1.15) = 0.99489 Result above show that Values obtained from both
methods are almost equal. (Cos θ=0.997) ≈ (y=0.99489)
Therefore we conclude that the angle between document vector and ontology vector can be calculated using the formula above. Then formula7 can be used instead Cos θ=P/N. But in this article, the second application desired. The set of the β coefficients belonging to lexical objects considered as vector B. In fact, this vector specifies weight and value that determine the lexical object.
B = (0.104, 0.101, 0.098, 0.054, 0.082,0.224, 0.12)
Table 4: List of optimized documents vector from documents vector of Table 1
PhoneNr Feature
Price Mileage
Model Make
Year Cos θ
0.82 1.46
1.27 0.37
0.78 1.38
1.46 0.9346
0.69 0.71
1.59 0.19
1.73 1.40
0.82 0.7953
1.21 1.21
0.91 0.4
0.61 0.81
2.07 0.8855
1.32 1.98
0.88 0.44
0.66 0.66
1.32 0.9837
0.84 1.08
1.33 0.37
1.34 1.05
1.61 0.8884
0.72 1.65
1.04 0.3
0.63 1.05
1.82 0.9309
0.74 1.62
1.33 0.44
1.33 0.74
1.33 0.9448
0.88 2.57
0.64 0.23
0.57 0.56
0.86 0.9659
1.73 1.24
0.4 0.45
0.74 0.64
1.83 0.8872
1.18 1.85
0.93 0.34
1.01 1.18
1.01 0.9908
Table 5: List of lexical objects and variables used in regression
Phone Nr Feature
Price Mileage Model
Make Year
Cos θ
X i7
X i6
X i5
X i4
X i3
X i2
X i1
Yi
Table 6: Output SPSS software after executes the regression over the data Table 4
β7
β6
β5
β4
β3
β2
β1
β0
Phone Nr Feature
Price Mileage Model
Make Year
Constant
0.120 0.224
0.082 0.054
0.098 0.101
0.104 0.017
4.2 Step2:Comparison Between Viewed Value And Expected Value In a Sample Document
After receiving a document to determine its relationship with ontology, in the first step, we form the document vector then we calculate document optimized vector using the formula 5. For evaluate the model, focus on two documents Da and Db
(Fig.2). The number of lexical object in the Da and
Db counted and presented as vectors
= 16,10,12, 6,11, 29,15 va
,vb = 4, 0, 0 , 2 ,8, 0 ,11
. In the first reviewed Da document. We use tocalculate document optimized vector in the part 2.3 that equal is:
= (1.17, 0.73, 0.88, 0.44, 0.8, 2.12,1.1) va,norm
Then vector values Va,norm and U multiplied in the
vector B and provide them with vectors Va,view and
UExpect Thus each element of vectors Va,norm and U
takes the value and weight.
, , (1.17 0.104, 0.73 0.101, 0.88
0.098,0.44 0.054, 0.8 0.082, 2.12 0.224, 1.1 0.12) (0.122,0.074,0.086,0.024,0.066,0.475,0.132)
a view a norm B
V V
(0.975 0.104,0.925 0.101,0.908 0.098,0.45 0.054,0.8 0.082, 2.1 0.224,1.15 0.12)
(0.101,0.093,0.089,0.024,0.066,0.47,0.138)
Expect U B
U
By the following formula and test χ2, can be defined an area sure to accept or not accept related document with ontology.
2k f i i-e
2= (8)
χ
e
i=1 i
(ei: Expected Frequency, fi: View frequency, K:
number of lexical objects in the ontology defined) If the relationship χ2χ1-α , k-12 is true, then our calculations within the confidence 1-αwould be accepted. Desired Values forχ2χ1-α , k-12 are extracted from the Chi-square distribution table. To perform calculations in the above formula, we use the ei value of the U Expect
vector and we use the fi
value of the v norm vector Extraction.
The χ2 For Da document is equal:
2 2 2
-k f i ie 0.122-0.101 0.074-0.093 2
= = + +
χ
0.101 0.093
i=1 ei
2 2 2
0.086-0.089 0.024-0.024 0.066-0.066
+ + +
0.089 0.024 0.066
2 2
0.475-0.47 0.132-0.138
+ = 0.008608
0.047 0.138
Considering the amountχ1-α , k-1= 0.99 , 62 χ2 = 0.872, if
the condition χ2χ1-α , k-12 is established then can be said that, Document optimized vector would be acceptable in the range of the ontology valid vector. For Da, Condition χ2χ1-α , k-12 is true
(0.0086608<0.872). With establishing the
conditions for definitive diagnosis in the document, we will go to the third step Otherwise the document not related to ontology.
Now we do the calculations for Vb Vector the
same as Va.
2k f i i-e
2= = 0.882957
χ
e
i=1 i
0.882957 0.872
Given that 0.882957>0.872, then we can declare that Db document definitely is not related with
ontology and don’t go to the third step.
4.3 Step3:Calculation Document Density And Comparison Between Expected Density And Viewed Density In Each Record
This step based the computing density records. Calculation expected density in each record is according ontology. Also we can calculation viewed density in each record based is according document text and ontology. Comparison of these values helps us to do a correct statement about the relationship ontology and document. Calculations performed in four stages:
4.3.1 Firs Stage: Calculation Density, Number Of Characters And Records In The Sample Document
records of documents structurally. To continue working we have to count the number of document records and the total characters in the sample (Da).
Records number 15 and characters sum 1992 counted in the Da
4.3.2 Second Stage: Calculation Viewed Density for Each Lexical Object in The Sample Document
In ontology, the maximum acceptable number of each lexical object in one record specified. Using these limitations and considering number of record in the sample document, about number of viewed lexical object in each document we decide. This observation presented in the document vector. The limitations desired car ontology as
W = (1,1,1,1,1, 5, 2)
vector shown. Other than the Feature and PhoneNr, the maximum number of lexical objects in the ontology is equal to one but ontology does not have limitation for these two particular cases. In this project, the calculations in an acceptable range considered. For each record usually not used more than five cases for Features and two PhoneNr. With consider these conditions and the counting records number of the document, the document vector modified and then will be display as the Vopt vector.
For example In the document, number of year lexical object is 16 but this document has only 15 records, so only 15 Occurrence of Year lexical object is accepted. Other lexical objects V vector is accepted. Edited V vector is:
= 15,10 ,12 , 6 ,11, 29 ,15 VOpt
The maximum number of characters that each lexical object can have, defined in the destination ontology limitations (For example line 10 of the car ontology, fig. 1). This limitation about car ontology displayed in the document y vector.
y = 4,10,12 ,8,10, 20,10
Using the following formula, we can calculate maximum number of viewed character and acceptable for each lexical Object.
(9)
Opt view
Ch V y
Maximum number of viewed character for the initial vector vfrom the Da document is:
= 60 ,100 ,144 , 48 ,110 , 580 ,150 Ch view
Also by dividing the number of accepted Characters for each lexical object by the number of Viewed characters of document, we calculate the density value for each lexical object.
ChView
= (10)
DensityView Number Of Characters in the document
Viewed Density for each lexical object in instance document, we represent as follows:
60,100 ,144, 48,110 ,580,150 =
DensityView 1992
= 0.03, 0.05, 0.07 , 0.02, 0.05, 0.29, 0.07
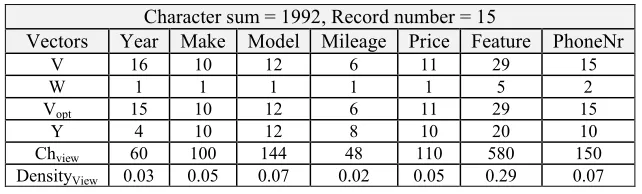
All Steps for calculate the viewed density of lexical objects in the Da document presented in the table7.
4.3.3 Step3: Calculate Expected Density For Each Lexical Object Based The Ontology in The Sample Document
Using the ontology vector and the records number of sample document for each lexical object, we can calculate approximate number of expected value, this calculation done based on the following formula
= U Total Records Document (11)
Dexpect
Thus for the V vector of Da document can say:
= 0.975, 0.925, 0.908, 0.45, 0.8, 2.1,1.15 15 Dexpect
14.63,13.88,13.62, 6.75,12,31.5,17.25
Then, using the following formula for the expected number of characters for each object is calculated. Then by the use of the following formula, the number of expected characters would calculate for each object.
= y (12)
Chexpect Dexpect
We use the formula above and we calculate the expected number of characters for each lexical object in the Da document
.
= 14.63,13.88,13.62,6.75,12,31.5,17.25 Chexpect
4,10,12,8,10, 20,10
= 58.5,138.8,163.4,54,120,630,172.5
After calculating the Expected characters number for each object and considering the characters number in document, using the following formula done calculated the expected density of each lexical object in the sample document.
exp
(13) exp
Ch ect
Density ect
Number Of Document Characters
The expected density of each lexical object in the Da
document shown as follows.
58.5,138.8,163.4, 54 ,120 , 630 ,172.5 =
Densityexpect 1992
0.029 , 0.069 , 0.082 , 0.027 , 0.06, 0.316 , 0.086
the actual number of characters for viewed lexical values and let in the maximum quality value for each lexical object, but there is a little difference between
this number and the real size. Steps Summary for calculate the expected density of lexical objects in the Da document in table 8 presented Steps.
Table 7: All steps for calculate the viewed density of lexical objects in the Da document
Character sum = 1992, Record number = 15
PhoneNr Feature
Price Mileage Model
Make Year Vectors
15 29
11 6
12 10
16 V
2 5
1 1
1 1
1 W
15 29
11 6
12 10
15 Vopt
10 20
10 8
12 10
4 Y
150 580
110 48
144 100
60 Chview
0.07 0.29
0.05 0.02
0.07 0.05
0.03 DensityView
Table 8: All steps calculated the expected density of lexical objects in the Da document
Character sum = 1992, Record number = 15
PhoneNr Feature
Price Mileage Model
Make Year
Vectors
15 29
11 6
12 10
16 V
1.15 2.1
0.8 0.45
0.908 0.925
0.975 U
17.25 31.5
12 6.75
13.62 13.88
14.63 DExpect
10 20
10 8
12 10
4 y
172.5 630
120 54
163.44 138.75
58.5 ChExpect
0.086 0.316
0.06 0.027
0.082 0.069
0.029 DensityExpect
4.3.4 Step4: Comparison of Two Vectors Expected Lexical Object Density and The Viewed Lexical Object Density
In this step, we compare the two vectors DensityExpect and Densityview of the sample document,
and then we will put to test the credit calculations within a reliable range. Before doing this, all the values of the two vectors would divide by the acceptable density value of the sample document
.
By doing so, it's acceptable density in the computing is more effective. If density value is more, result divide two vectors DensityExpect and Densityview by density iscloser to zero. Resulting, to the reliable area of %100(1-α) for test χ2 is closer. To calculate of acceptable density from document, the following formula is used:
Total haracters accept
= (14)
density(D)accept Number Of document Characters
The total accepted characters of total elements would obtain from chview vector. With the division of
vectors DensityExpect and Densityview by value
Density(D)accept vector, will be formed two vectors
optimized Density(D)EcceptNormal , Density(D)viewNormal.
We use the following formula for measuring the two vectors.
2 k ( - )f e
2= i i
χ
ei i=1
The values fi of DensityviewNormal vector and the
values ei of DensityExpectNormal vector are used
.
Considering the amountχ2 = χ2 = 0.872 0.99,6
1-α,k-1 , if
condition χ2χ1-α,k-12 is established, it can say that values Acceptable viewed density vector to the values expected density vector within the acceptable range.
With Calculating density of acceptable for the Da
document optimized values for the two vectors is
:
(chview) =density(D)accept Number Of document Characters
1192
= = 0.598
1992
Densityexpect =
DensityexpectNormal
Density(D)accept
= 0.0485,0.1154,0.137,0.0451,0.1003,0.528,0.144
DensityView =
DensityViewNormal
Density(D)accept
= 0.05,0.084,0.117,0.0334, 0.084,0.485,0.117
2 2
2
k ( - )f i ie 0.05-0.0485 0.084-0.1154
2 = = + +
x
0.0485 0.1154
e i=1 i
2 2 2
0.117-0.137 0.0334-0.0451 0.084-0.1003
+ + +
0.137 0.0451 0.1003
2 2
0.485-0.528 0.117-0.144
+ = 0.0223
0.528 0.144
Considering the amount χ1-α,k-12 =χ20.99,6= 0.872
,If the condition χ2£χ1-α,k-1 is established, it can be 2 said that View density vector values is acceptable to the values expected density vector within the acceptable range and we said the document with instance application ontology is related.
5 EXPERIMENTAL RESULTS
In this section, is evaluated the proposed model. For this purpose, we tested three different documents. The first group consisted of ten relative document (Table 1), the second group include ten non-relative document (Table2) and third group include eight non-relative document but similar to the car ontology (Table 3).
The model performance evaluated by computing the recall and precision ratios on each test document set.
TP
recall = (15)
TP + FN TP
precision = (16)
TP + FP
TP: Number of documents that related with the ontology and method they detected related too.
FN: Number of documents that related with the ontology, but method they detected unrelated.
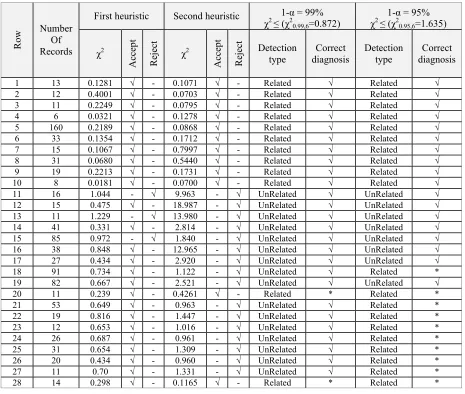
FP: Number of documents that unrelated with the ontology, but method they detected related. The experimental result of propose method on different documents in the table 9 summarized. Reference first 10 rows is table1, second 10 rows is table2 and third 8 rows is table3. Two heuristics mentioned in the tables as follows:
The first heuristic is the second step of the proposed method as Comparison between viewed value and expected value in a sample document.
The second heuristic is the third step of the
proposed method as calculation document density and comparison between expected density and viewed density in each record.
For both of heuristic, two columns with the title of acceptance and rejection is considered. If calculation results, is in the acceptable range selection acceptance otherwise selection rejection.
In the First evaluating, the propose method in an acceptable range α-1=99%with error α=1%also evaluate opportunities. Whereas the object number of ontology vector is equal to seven then k=7. If the condition χ2 χ2
1-α,k-1
or χ2 χ2 = 0.872 0.99,6
is
established, it can say that values Acceptable viewed density vector to the values expected density vector within the acceptable range then Experimental result in the range α-1=99% shown in the table 9. In this table, number of Record represents the number of records counted in a sample document also detection type represents type of document relation to ontology that by the propose method specified.
According to the information in Table9, values TP=10, FN = 0 and FP =2. Thus, the values of recall and precision follow:
10
recall = = 100%
10 + 0 10
precision = = 83%
10 + 2
Also for further evaluation, the propose method in an acceptable range α-1=95% with error α=5% evaluate again
.
That results of this evaluation shown in the Table 9. According to the information in this table, values TP=10, FN = 0 and FP =10. Thus, the values of recall and precision follow:10
recall = = 100%
10 + 0 10
precision = = 50%
10 +10
If we increase the accepted error rate then the system accuracy would be reduced. The results of the tests in a 95% confidence interval was evaluated .The recall rate reduced of 100% and the precision decreased to 50%
.
6 REFERENCES
[1] Al-Kamha, Reema, and David W. Embley. "Grouping search-engine returned citations for person-name queries." In Proceedings of the 6th annual ACM international workshop on Web information and data management, pp. 96-103. ACM, 2004.
[2] Wessman, Alan. "A Framework for Extraction Plans and Heuristics in an Ontology-Based Data-Extraction System." PhD diss., Brigham Young University, 2005.
[3] Embley, David W., Douglas M. Campbell, Randy D. Smith, and Stephen W. Liddle. "Ontology-based extraction and structuring of information from data-rich unstructured documents." In Proceedings of the seventh international conference on Information and knowledge management, pp. 52-59. ACM, 1998.
[4] Zhou, Yuanqiu. "Generating data-extraction ontologies by example." PhD diss., Brigham Young University, 2005.
[5] Vickers, Mark S. "Ontology-based free-form query processing for the semantic web." (2006).
[6] Reema A: Conceptual xml for system analysis, August (2007).
[7] Studer. Semantic Issues in Multimedia Systems: Ontology based Access to Distributed and Semi Structured Information Database Semantics, (1998).
[8] Woodbury C. Brigham Young University: Retrieving Danish Genealogical Records on the Semantic Web, December (2004).
[9] Embley, David W., Yiu-Kai Ng, and Li Xu. "Recognizing ontology-applicable multiple-record Web documents." In Conceptual
1-α = 95% χ2 ≤ (χ20.95,6=1.635)
1-α = 99% χ2 ≤ (χ20.99,6=0.872)
Second heuristic First heuristic Number Of Records Row Correct diagnosis Detection type Correct diagnosis Detection type Reject Accep t χ2 Reject Accep t χ2 √ Related √ Related - √ 0.1071 - √ 0.1281 13 1 √ Related √ Related - √ 0.0703 - √ 0.4001 12 2 √ Related √ Related - √ 0.0795 - √ 0.2249 11 3 √ Related √ Related - √ 0.1278 - √ 0.0321 6 4 √ Related √ Related - √ 0.0868 - √ 0.2189 160 5 √ Related √ Related - √ 0.1712 - √ 0.1354 33 6 √ Related √ Related - √ 0.7997 - √ 0.1067 15 7 √ Related √ Related - √ 0.5440 - √ 0.0680 31 8 √ Related √ Related - √ 0.1731 - √ 0.2213 19 9 √ Related √ Related - √ 0.0700 - √ 0.0181 8 10 √ UnRelated √ UnRelated √ - 9.963 √ - 1.044 16 11 √ UnRelated √ UnRelated √ - 18.987 - √ 0.475 15 12 √ UnRelated √ UnRelated √ - 13.980 √ - 1.229 11 13 √ UnRelated √ UnRelated √ - 2.814 - √ 0.331 41 14 √ UnRelated √ UnRelated √ - 1.840 √ - 0.972 85 15 √ UnRelated √ UnRelated √ - 12.965 - √ 0.848 38 16 √ UnRelated √ UnRelated √ - 2.920 - √ 0.434 27 17 * Related √ UnRelated √ - 1.122 - √ 0.734 91 18 √ UnRelated √ UnRelated √ - 2.521 - √ 0.667 82 19 * Related * Related - √ 0.4261 - √ 0.239 11 20 * Related √ UnRelated √ - 0.963 - √ 0.649 53 21 * Related √ UnRelated √ - 1.447 - √ 0.816 19 22 * Related √ UnRelated √ - 1.016 - √ 0.653 12 23 * Related √ UnRelated √ - 0.961 - √ 0.687 26 24 * Related √ UnRelated √ - 1.309 - √ 0.654 31 25 * Related √ UnRelated √ - 0.960 - √ 0.434 20 26 * Related √ UnRelated √ - 1.331 - √ 0.70 11 27 * Related * Related - √ 0.1165 - √ 0.298 14 28
Modeling—ER 2001, pp. 555-570. Springer Berlin Heidelberg, 2001.
[10]Olson, Lars E. "Querying Disjunctive Databases in Polynomial Time." PhD diss., Brigham Young University, 2003
[11]Wang, Quan. "A Binary-categorization Approach for Classifying Multiple-record Web Documents Using a Probabilistic Retrieval Model." PhD diss., Brigham Young University, 2001.
[12]HASSARD, TH. "APPLIED LINEAR-REGRESSION-WEISBERG, S." (1981): 158-158.
[13]Ding, Yihong. "Study of Design Issues on an Automated Semantic Annotation System." AIS SIGSEMIS Bulletin 2 (2005): 45-51.
[14]Al-Muhammed, Muhammed. "Dynamic matchmaking between messages and services in multi-agent systems." PhD diss., Brigham Young University. Department of Computer Science, 2004.
[15]Embley, David W., Norbert Fuhr, Claus-Peter Klas, and Thomas Rölleke. "Ontology suitability for uncertain extraction of information from multi-record web documents." Datenbank Rundbrief 24 (1999): 48-53.
[16]Boes, Duane C., F. A. Graybill, and A. M. Mood. "Introduction to the Theory of Statistics." Series in probabili (1974).
[17]Wonnacott, Thomas H., and Ronald J. Wonnacott. Regression: a second course in statistics. New York: Wiley, 1981.
[18]Lonsdale, Deryle, David W. Embley, Yihong Ding, Li Xu, and Martin Hepp. "Reusing ontologies and language components for ontology generation." Data & Knowledge Engineering 69, no. 4 (2010): 318-330.
[19]Lynn, Stephen G. "Automating mini-ontology generation from canonical tables." PhD diss., Brigham Young University, 2008.
[20]Lynn, Stephen, and David W. Embley. "Automatic Generation of Ontologies from Canonicalized Web Tables." submitted manuscript (2008).
[21]Muhammed, Al, and Muhammed Jassem. "Ontology aware software service agents: Meeting ordinary user needs on the semantic web." (2007).
[22]D’Avanzo, Ernesto, Antonio Lieto, and Tsvi Kuflik. "Manually vs semiautomatic domain specific ontology building."
[23]Tao, Cui, Yihong Ding, and Deryle Lonsdale. "Automatic creation of web services from extraction ontologies." In Advances in Conceptual Modeling-Theory and Practice, pp. 415-424. Springer Berlin Heidelberg, 2006. [24]Walker, Troy. "AUTOMATING THE
EXTRACTION OF DOMAIN-SPECIFIC
INFORMATION FROM THE WEB—A CASE STUDY FOR THE GENEALOGICAL DOMAIN." PhD diss., Brigham Young University, 2004.
[25]Chen, Xueqi Helen, David W. Embley, and Stephen W. Liddle. Query rewriting for extracting data behind HTML forms. Springer Berlin Heidelberg, 2004.
[26]Ding, Yihong. "Semiautomatic generation of resilient data-extraction ontologies." PhD diss., Brigham Young University, 2003.
[27]Zhang, Ning, Hong Chen, Yu Wang, Shi-Jun Cheng, and Ming-Feng Xiong. "Odaies: Ontology-driven adaptive web information extraction system." In Intelligent Agent Technology, 2003. IAT 2003. IEEE/WIC International Conference on, pp. 454-460. IEEE, 2003.
[28]Embley, David W., D. M. Campbell, Y. S. Jiang, Y. K. Ng, R. D. Smith, Li Xu, S. W. Liddle, and D. W. Lonsdale. "Extracting and Structuring Web Data." Brigham Young University (2002).
[29]Yau, Sai Ho. "Automating the extraction of data behind web forms." PhD diss., Brigham Young University, 2000.
[30]Arocena, Gustavo O., and Alberto O. Mendelzon. "WebOQL: Restructuring documents, databases and Webs." In Data Engineering, 1998. Proceedings., 14th International Conference on, pp. 24-33. IEEE, 1998.
[31]Jiang, Yuan. "Record-Boundary Discovery in Web Documents." PhD diss., Brigham Young University, 1998.