Proposing an Improved Semantic and Syntactic Data
Quality Mining Method using Clustering and Fuzzy
Techniques
Hamid Reza Khosravani
Department of Computer
Engineering
Science and Research Branch,
Islamic Azad University
Tehran, Iran
ABSTRACT
Data quality plays an important role in knowledge discovering process in databases. Researchers have proposed two different approaches for data quality evaluation so far. The first approach is based on statistical methods while the second one uses data mining techniques which caused further improvement in data quality evaluation results through relying on knowledge extracting. Our proposed method in data quality evaluation follows the second approach and focuses on accuracy dimension of data quality evaluation including both syntactic and semantic aspects.
Existing data mining techniques evaluate data quality of relational database records only based on association rules which are extracted from their categorical features. Since in real world, we have data with both categorical and numerical features, the main problem of these methods is that numerical feature of data is ignored. Our proposed method in this paper which relies on records’ clustering concept, has overcome the existing methods’ problem.
In this method we extract the describing rule for each record’s cluster and assign a weight to each field of a record to consider the degree of its importance in data quality evaluation. This method evaluates the data quality in a hierarchical manner based on three defined criteria. The simulation results show that using this new proposed method has improved data quality evaluation of the relational database records in an acceptable manner.
General Terms
Data quality, Knowledge discovery, Data mining, Relational databases.
Keywords
Data quality mining, Association rules, Categorical feature, Numerical feature.
1.
INTRODUCTION
What is sensed from “data quality” concept is to what extent data is qualified for use; however evaluating the quality of the data is a domain dependent problem. In other words, while discussing about the quality of the data, it is important to not only considers the domain in which it is going to be used for, but also the quality goals specified for that domain.
As the use of information systems is growing, the adverse outcome of using data with low quality and its negative influence on decision making becomes more tangible; so evaluating the quality of the data to gain an accurate knowledge seems to be vital. Data quality evaluation follows two main goals. The first one is cleaning the database from wrong data in a way that the remaining data is approved by the users. The second goal is about the accuracy of the patterns which are extracted from existing data since making decisions based on wrong patterns may cause unbelievable losses for organizations [7, 10, 11, 17, 23].
To perform a careful evaluation of data quality in databases, it is necessary to define several quality dimensions; each of which expressing a specific aspect of quality problems. Some important aspects of data quality that have been studied so far are: accuracy, completeness, consistency, timeliness, security, accessibility, reputation, interpretability, ease of understanding, concise representation, objectivity, believability and value-added [9,16,17,19] . These dimensions are defined regarding to the key factors which have significant impact in reducing the level of data quality, such as: the existence of illegal values, duplicated records, violated attribute dependencies, values out of domain range, etc. Our proposed method in data quality evaluation focuses on accuracy dimension of data quality evaluation including both syntactic and semantic aspects. As we all know, in order to calculate the accuracy level of data in an accurate, deterministic manner, the existence of data catalog is essential since it provides necessary information such as data type and the domain of each field as well as database constraints. This catalog may not be available to us; that’s why we have to use other methods such as data mining techniques in evaluating the accuracy of our data despite of the uncertainty they have. It is obvious that the method whose output has the least deviation from the deterministic, actual value is the most appropriate one.
Our proposed method has overcome the existing method’s problems using clustering and fuzzy techniques.
2.
RELATED WORKS
Data quality problem has been considered in various fields such as: statistics, management and computer science. What is important in data quality management is to prevent entry of data that threaten the total quality of an information system; hence several methodologies have been developed in data quality management process; in which TDQM and SBQF are the most important ones [1,17].
Missing values and incorrect data are the two important issues which strongly lead to decrease data quality in databases. Statisticians use basic statistical concepts and methods such as chart controls and predictive regression models to cope with these problems. They also evaluate important dimensions of data quality including accuracy and completeness for sample data in statistical populations by the means like: simple ratio, average, weighted average, mod, median, mean absolute percent error, signal percent error, etc [1, 2, 14, 16, 19]. In computer science, data analysis process is applied to evaluate the level of the quality in datasets. In general, data profiling and data mining are the two main approaches which support data analysis process. The first approach focuses on the analysis of each individual characteristic of data from a dataset and extracts the corresponding metadata of each attribute; such as: data type, length and the range of the values, discrete values and their occurrences, number of missing values occurrences, unique values and typical string patterns including patterns for telephone numbers, postal codes, postal addresses, etc. Data profiling approach then compares the value of each incoming record's attribute to check if it is adapted to the extracted metadata obtained from previous analysis; otherwise, it considers this contradiction as a defect in the quality of that record [11].
Data quality mining is relatively a new field in the context of data quality in computer science. It uses data mining techniques to extract some patterns from accurate datasets and then other data will be compared to the extracted patterns; any deviation from extracted patterns is diagnosed as a defect in the level of the data quality. Clustering, summarization, association rules mining and sequence discovery are descriptive data mining models. Such models describe the relations between attributes as well as helping us in determining integrity constraints between them including functional dependencies and application-specific business rules. The integrity constraints are then used for identifying and resolving some data quality problems in which missing values, illegal values and duplicated records are the most important ones [1, 11, 12].
For evaluating the level of the data quality from the accuracy point of view two methods have been discussed in literatures [1] and [12]. The proposed method in [12], can be summarized into the three following steps: The first step is about extracting all association rules from the database of an information system. The second step includes comparing each transaction of information system with each association rule using a predefined violate function which determines whether the transaction violates the current association rule or not. In the third step, according to the confidence of each association rule and a tuning parameter, the violation degree of each transaction with regard to the information system is calculated.
In fact, instead of evaluating the quality of the incoming record, its inconsistency with other existing data will be
concerned which cannot be an accurate evaluation for the quality level of the record. Moreover, extracting all association rules for an information system is a time consuming task which also needs huge amount of memory space.
The proposed method in literature [1] tries to improve the presented method in literature [12] by first evaluating the quality of incoming record based on both extracted business rules and the domain of each field in the database and then using these two measured criteria as the input of a fuzzy system in order to do the final evaluation on incoming record's quality. Since the business rules in this method are only those association rules that comply with discovered functional dependencies between each pair of attributes, the amount of storing space will be reduced. Furthermore, this method provides a more precise evaluation by considering the domain of each observed attribute in database which has not been taken into account in literature [12]; but the main problem of this method is that if the nature of database is in such a way that there exist only a few functional dependencies between its attributes, the number of association rules that are considered as business rules is much less than the number of total attributes that exist in database. This, in turn, will decrease the accuracy of evaluation. Moreover, both proposed methods in [12] and [1] only use those association rules that are discovered from categorical features, while in real world, we have data with both numerical and categorical features; so by ignoring the numerical features, evaluation results will be somehow away from what is expected in real world.
Our proposed method which uses data mining techniques to evaluate accuracy dimension of data quality, has overcome the existing problems in previous methods. Our proposed method concerns numerical features as well as categorical ones and evaluates the accuracy of attributes' values in a hierarchical manner based on three defined criteria.
3.
OUR PROPOSED METHOD
There are various definitions for accuracy dimension of data quality; all of which refer to a general definition that is the degree with which data correctly represents the real-life objects.
Since attributes together with their correspondent values represent real world objects, the accuracy of the values is evaluated both syntactically and semantically. Syntactic accuracy of a value refers to the point that whether it could be assigned to a specific attribute in real world or not while semantic accuracy of a value discusses if it could have a correct semantic relationship with the values of other attributes in real world.
Our proposed method defines several criteria in order to evaluate data accuracy with regard to the two mentioned definitions of semantic and syntactic accuracy. The values of the defined criteria are gained from comparing existing data which we want to determine the level of its quality with extracted knowledge from an accurate and correct dataset. Since our proposed method wants to evaluate the quality level of a table in a relational database from the accuracy point of view, the notion of data refers to the existing records in that table.
3.1
Term definitions
for extracting the knowledge that is required to evaluate the accuracy of other records.
Unevaluated Record is a record out of the Primitive Sample which we are not sure about its accuracy. Deterministic Record is an Unevaluated Record
which completely conforms to the knowledge extracted from Primitive Sample.
Nondeterministic Record is an Unevaluated Record which does not completely conform to the knowledge extracted from Primitive Sample. Deterministic Cluster is a cluster obtained from the
records existing in Primitive Sample.
Nondeterministic Cluster is a cluster obtained from Unevaluated Records.
CNF rule is a rule composed from conjunction of attribute-value pairs which describes common properties in a cluster.
3.2
The idea of our proposed method in
evaluating data accuracy
Our proposed method compares each Unevaluated Record with the part of extracted knowledge which is most compliant and consistent with it.
In data mining scope, the notion of data clustering supports this idea. In this method, first of all, the Primitive Sample will be partitioned into several clusters in a way that the records of each cluster are the most similar ones to each other; in contrast, records existing in two different clusters are the least similar ones to each other. In second step, we extract the following information and knowledge using both intra domain and intra cluster analysis:
The domain of observed values for each database attribute based on the Primitive Sample.
The domain of observed values for each database attribute based on the extracted clusters from the Primitive Sample.
The format of numerical attributes with regard to their values in the Primitive Sample.
The descriptive rule of each cluster.
In the third step, the Unevaluated Records which there is no certain about their accuracy are going to be evaluated. It is done by comparing them with a part of extracted knowledge that have the most conformity. In this step, we may encounter with some Unevaluated Records that do not have any adaptation to the extracted knowledge. This may cause due to two factors; the first one is knowledge deficiency. In other words, the Primitive Sample has been chosen in a way that does not cover all existing facts of the domain. Hence the Unevaluated Record is a new data which does not exist in the Primitive Sample. Consequently, all or a portion of the Unevaluated Record’s values do not adapt to the extracted knowledge. The second factor is that there may be inaccurate values in some of the Unevaluated Records’ attributes which makes it far from the extracted knowledge. Hence, for the records that are far from the extracted knowledge, we encounter with an uncertainty in the evaluation phase we have used a set of fuzzy systems in order to cope with the uncertainty problem.
3.3
Constituent phases of our proposed
method
Our proposed method evaluates data quality level in the four following phases:
Knowledge extraction
Identifying Deterministic Records and measuring the degree of their accuracy
Evaluating Nondeterministic Records and measuring the degree of their accuracy
Evaluating the level of database quality
3.3.1
Knowledge extraction
This phase consists of five following steps:
3.3.1.1
Selecting a subset of database records
which are completely correct
Since our proposed method uses data mining approach, in the first step, we have to select a set of completely accurate records as Primitive Sample from the database. This Primitive Sample is used to extract a completely accurate knowledge as a criterion for evaluating other records of database in next steps.
3.3.1.2
Clustering the Primitive Sample
Since the main idea of our proposed method is comparing each Unevaluated Record with the part of knowledge that has the maximum similarity with it, we organize the Primitive Sample into some clusters. It is done in a way that records of each cluster are the most similar ones to each other; while records existing in two different clusters are the least similar ones to each other. The applied algorithm is an extended version of k-means algorithm which is able to cluster data that has both numerical and categorical attributes [6,5].
We start the algorithm with k=2 in order to divide the Primitive Sample into two clusters; then the quality of two newly created clusters is measured by calculating the value of distortion criterion. The definition of distortion criterion is based on what is stated in [8]. If this value is less than a predetermined threshold, the algorithm stops since the Primitive Sample has been divided into the desired clusters; otherwise we will restart the algorithm with assigning a higher value to the k, for example 3, and repeat all the previously mentioned tasks.
3.3.1.3
Assigning appropriate weights to each
attribute in a supervised manner
for a subset of the attributes that have more influence in the classification of future records.
Our proposed method determines the significance of each attribute by first calculating the information gain ratio for each database attribute based on the obtained clusters in previous subsection and then putting the obtained value in the formula defined by (1).
W
i=
Gain_Ratio(A
i)
Gain_Ratio(A
j)
m j=1
(1)
Where wi is the weight (significance) of the ith attribute, m is the number of the database attributes, Gain-Ratio (Ai) is the calculated amount of the information gain ratio criterion for
ith attribute and 𝑚𝑖=1
𝑊
𝑖= 1
.
3.3.1.4
Deviding attributes into two distinct
groups based on their assigned weights
In this stage, according to the obtained weights and a predetermined threshold, the attributes are divided into two categories: more significant and less significant attributes. The attributes which their weight is greater or equal than the threshold are belonged to more significant attributes and the rest of them will be concerned as less significant attributes. In next stages, we will define some criteria based on these two groups of attributes in order to evaluate the quality level of database records.
3.3.1.5
Describing obtained clusters using rules
in CNF format based on more significant
attributes
In this step, the characteristic of each cluster should be described in a formal form in order to be able to evaluate the accuracy of a record by having a comparison between the values of the record and the characteristics of a cluster to which it belongs. Our proposed method in describing each cluster is based on the idea that since more significant attributes have a great impact on how data are going to be classified, the presence of more significant attributes together with each other shows a semantic relationship between them. Hence, the conjunctive combination of more significant attributes together with their values in each cluster can be considered as a rule for describing the common characteristics of all records which belong to a specific cluster.
Here we extract the rule of each cluster based on the more significant attributes by utilizing the way of determining each cluster center in the centric based clustering algorithms such as k-means [5,22,24]. The Procedure of extracting the rule of a specific class is as follows:
For each more significant categorical attribute, the most frequent value in a specific cluster together with its correspondent attribute makes one of the attribute-value pairs of the rule of a specific cluster.
In order to do the similar task for more significant numerical attributes, it is necessary to change them to categorical attributes. For this purpose, the domain of observed values of each more significant numerical attribute should be discretized into intervals; As a result, each interval can be realized as a categorical value. The interval which covers the most observed values together with its associated
attribute makes one of the attribute-interval pairs of the rule of a specific cluster. We have used Fayyad & Irani, an entropy based supervised method which is applied to more significant numerical attributes through the WEKA environment, in order to discretize the domain of numerical attributes.
Finally, after extracting the descriptive rule of all clusters, each cluster is studied to realize whether all of its records completely conform to the rule of that cluster or not. If some records are found that don’t thoroughly match to the correspondent rule of their cluster, they will form a new cluster with their peers.
3.3.2
Identifying Deterministic and
Nondeterministic Records and measuring the
degree of their accuracy
Our aim is to process a set of Unevaluated Records to determine the degree of their accuracy based on the knowledge that we have gained from the Primitive Sample. The accuracy degree of the database, in turn, will be calculated through the accuracy level of Unevaluated Records.
In this phase, in order to calculate how much an Unevaluated Record is accurate, we should first determine to what extent the assigned value of each attribute of that record is accurate. To do this task, we have defined three criteria including: Syntactic Accuracy in Domain criterion (SynAD), Syntactic Accuracy in Cluster criterion for less significant attributes (SynAC) and Semantic Accuracy in Cluster criterion for more significant attributes (SemAC). By the means of these three criteria, we first determine if a specific attribute’s value is deterministic or nondeterministic since each kind has a different way for calculating the accuracy level of the attribute’s value.
The definitions that describe when the value of a specific attribute is deterministic or nondeterministic vary from one criterion to another and will be discussed in the following subsections elaborately.
3.3.2.1
Syntactic Accuracy in Domain criterion
This evaluation criterion, which is shown by SynAD, reflects the fact that how much the value of a specified attribute of an Unevaluated Record conforms to its real value in the discussed domain. This criterion is defined for the attribute “A” with the value “a” according to equation (2).
SynAD A = a = 1 if a in D
P, 0 < 𝑃 < 1 𝑂𝑡ℎ𝑒𝑟𝑤𝑖𝑠𝑒
A, S
(2)
Where D (A, S) is the observed domain of attribute A in the Primitive Sample. Based on the definition of this criterion in (2), given an Unevaluated Record which “A” is one of its attributes, if “a” is one of the observed values for attribute “A” in the Primitive Sample, it will be deterministic and the value of its SynAD criterion will be 1. It is because that the Primitive Sample consists of records that are completely accurate.
An accurate value which does not exist in the Primitive Sample; that is our Primitive Sample did not cover all possible values for attribute “A”.
Or
An inaccurate value that is not defined in the discussed domain.
In this situation we call “a” as a nondeterministic value. To evaluate SynAD criterion in such an uncertain condition, we have proposed a fuzzy system which is elaborately discussed in the following subsection.
3.3.2.1.1 Measuring SynAD criterion in uncertain
conditions
The idea of measuring this criterion in uncertain conditions is based on how frequent a new value like “a” has been assigned to a specific attribute like “A”; that is, when a nondeterministic value has been assigned to a specific attribute of an Unevaluated Record, the value of SynAD criterion is in direct relation with how many times this nondeterministic value has been observed among other Unevaluated Records.
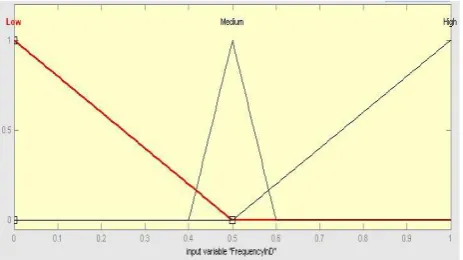
In order to deal with the uncertainty in measuring SynAD criterion, we have proposed a fuzzy approach which uses singleton fuzzifier, a Mamdani inference engine and center average defuzzifier. Given nondeterministic attribute-value pair “A=a”, the rule base of this fuzzy system, as described in Table 1, includes the rules that reflect the direct relation of SynAD’s value with how frequent “a” is observed as a value for attribute “A” among other Unevaluated Records.
Our proposed fuzzy system takes the FrequencyInD parameter as its input which is defined by (3). This parameter describes a percentage of the all Unevaluated Records that their attribute “A” has a nondeterministic value “a”.
FrequencyInD A = a =
N(A = a)
n
(3)
Where N (A=a) is the total number of Unevaluated Records which their attribute “A” has nondeterministic value “a”, and
n is the total number of Unevaluated Records.
The output of this system indicates the value of SynAD
criterion for a nondeterministic attribute-value pair “A=a”, that is 0<p<1.
The membership function diagrams of the input parameter
FrequencyInD (A=a) and output parameter SynAD (A=a) are
shown in the Fig.1 and Fig. 2 respectively.
3.3.2.2
Syntactic accuracy in cluster criterion for
less significant attributes
This criterion which is shown by SynAC states the fact that how much the value of a specific less significant attribute of
an Unevaluated Record conforms to the observed values in the cluster to which the Unevaluated Record belongs.
This criterion for less significant attribute “A” with value “a”
with respect to the cluster “Ci” is defined by equation (4).
SynAC A = a, C = Ci = 1 if a in DP, 0 < 𝑃 < 1 𝑂𝑡ℎ𝑒𝑟𝑤𝑖𝑠𝑒 A, Ci, S (4)
Where D (A,Ci,S) is the observed domain for the values of
attribute “A” in cluster “Ci” of the Primitive Sample.
Based on the definition of this criterion in (4), given an Unevaluated Record which “A” is one of its attributes, if “a” is one of the observed values for attribute “A” in cluster “Ci”
of the Primitive Sample, it will be deterministic and the value of its SynAC criterion will be 1. It is because that the cluster
Ci includes a subset of records of the Primitive Sample which are completely accurate.
Fig. 1: The membership function of FrequencyInD (A=a)
Fig. 2: The membership function of SynAD (A=a)
Table 1. The rule base of our proposed fuzzy system in calculating synad criterion
Rule description Rule
No.
IF FrequencyInD(A = a) IS Low THEN SynAD(A = a) IS Low
1
IF FrequencyInD(A = a) IS Medium THEN
SynAD(A = a) IS Medium 2
IF FrequencyInD(A = a) IS High THEN SynAD(A = a) IS High
In the case that the value “a” is not observed for attribute “A” in cluster Ci, an uncertain situation with two possible assumptions pops up:
The first assumption is that our Primitive Sample did not cover all possible accurate values; in other words, the value “a” depends on a record or some records which are completely accurate and could be belong to cluster “Ci”, but they are considered as
some new records because they have not been observed in the Primitive Sample.
The second assumption is that the value “a” is an inaccurate value which is not defined in the considered domain.
Therefore, to cope with uncertainty problem in measuring this criterion for attribute “A” with value “a” with respect to cluster “Ci we have proposed a fuzzy system which is
elaborately discussed in the following subsection.
3.3.2.2.1 Measuring SynAC criterion related to the
less significant attributes in uncertain conditions
In this subsection, a fuzzy approach for measuring the SynAC
criterion for nondeterministic values of those less significant attributes is proposed.
In order to calculate SynAC criterion we consider two influential factors. The first one is how frequent a new value like “a” has been assigned to a specific attribute like “A” in a specific cluster like “Ci”; that is, when a nondeterministic
value has been assigned to a specific attribute of an Unevaluated Record which belongs to a specific cluster, the value of SynAC criterion is in direct relation with how many times this nondeterministic value has been observed among other Unevaluated Records of that same cluster. The second factor is the value of SynAD criterion for the nondeterministic value of that less significant attribute.
In order to deal with uncertainty in measuring SynAC criterion, our fuzzy approach uses singleton fuzzifier, a Mamdani inference engine and center average defuzzifier. Given nondeterministic attribute-value pair “A=a”, the rule base of this fuzzy system, as described in Table 2, contains the rules which consider the two mentioned influential factors simultaneously.
Our proposed fuzzy system has two inputs and one output with following descriptions:
The first input of our proposed fuzzy system is shown by
FrequencyInC (A=a, C=Ci) and denotes the percentage of
Unevaluated Records which contain the nondeterministic attribute-value pair “A=a” and belong to “Ci” cluster. This
input parameter is calculated according to the equation (5).
FrequencyInC A = a, C = Ci =N(A = a, C = CN(A = a) i) (5)
Where N (A=a, C=Ci) is the number of Unevaluated Records which all belong to a same cluster like “Ci” and a nondeterministic value like “a” is assigned to their attribute “A”. N (A=a) is the number of all Unevaluated Records (no matter to which cluster they belong) that their attribute “A”
has the nondeterministic value “a”.
The second input of our proposed fuzzy system is the value of
SynAD criterion for nondeterministic attribute-value pair
“A=a” which has been obtained either in certain or uncertain
condition.
The output of this system indicates the value of SynAC (A=a, C=Ci) criterion for a nondeterministic attribute-value pair
“A=a” with respect to the Ci cluster, that is 0<p<1.
The membership function diagrams of the input parameter
FrequencyInC (A=a, C=Ci) and output parameter SynAc
(A=a, C=Ci) are shown in the Fig.3 and Fig.4 respectively.
Fig. 3: The membership function of FrequencyInC (A=a, C= Ci)
Fig.4: The membership function of SynAC (A=a, C=Ci)
Table 2. The rule base of our proposed fuzzy system in calculating SynAC criterion
Rule Description Rule
No.
IF SynAD(A = a) IS Low and FrequencyInC(A = a, C = Ci) IS Low THEN SynAC(A = a, C = Ci) IS Very Low
1
IF SynAD(A = a) IS Low and FrequencyInC(A = a, C = Ci) IS Medium THEN SynAC(A = a, C = Ci) IS Low
2
IF SynAD(A = a) IS Low and FrequencyInC(A = a, C = Ci) IS High THEN SynAC(A = a, C = Ci) IS Medium
3
IF SynAD(A = a) IS Medium and FrequencyInC(A = a, C = Ci) IS Low THEN SynAC(A = a, C = Ci) IS Low
4
IF SynAD(A = a) IS Medium and FrequencyInC(A = a, C = Ci) IS Medium THEN SynAC(A = a, C = Ci) IS Medium
5
IF SynAD(A = a) IS Medium and FrequencyInC(A = a, C = Ci) IS High THEN SynAC(A = a, C = Ci) IS High
IF SynAD(A = a) IS High and FrequencyInC(A = a, C = Ci) IS Low THEN SynAC(A = a, C = Ci) IS Medium
7
IF SynAD(A = a) IS High and FrequencyInC(A = a, C = Ci) IS Medium THEN SynAC(A = a,C = Ci) IS High
8
IF SynAD(A = a) IS High and FrequencyInC(A = a, C = Ci) IS High THEN SynAC(A=a, C = Ci) IS Very High
9
3.3.2.3
Semantic Accuracy in Cluster criterion for
more significant attributes
This criterion which is shown by SemAC states the fact that how much the value of a more significant attribute from an Unevaluated Record has accurate semantic relation with the values of other more significant attributes which exist in the same cluster that the Unevaluated Record belongs to. This criterion is measured for such attributes that their values are dependent on the values of other attributes that are defined in a specific cluster. As a result of this dependency, such attributes take part in an intra cluster semantic relationship. In our proposed method, the SemAC criterion is only measured for the more significant attributes since they play more important role in separability and grouping records among the clusters. For a given more significant attribute-value pair “A=a” which belongs to cluster Ci , the SemAC criterion is defined by equation (6).
SemAC A = a, C = Ci = P, 0 < 𝑃 < 1 𝑂𝑡ℎ𝑒𝑟𝑤𝑖𝑠𝑒1 if A = a in Ri OR A = a in PRu (6)
Where “Ri” is the descriptive rule of the Deterministic Cluster
“Ci” that owns the Unevaluated Record. “PRu” is the partial
deterministic rule that is derived from the rule of the new Nondeterministic Cluster “Cu” and will be described
elaborately in the following subsection.
As we know, if a given Unevaluated Record belongs to the Deterministic Cluster “Ci”, all its more significant
attribute-value pairs will conform to the descriptive rule of the Deterministic Cluster “Ci”. Hence, Based on the definition
stated in (4), the value of SemAC criterion for its more significant attribute-value pair “A=a” which belongs to “Ci”
cluster will be 1. It is because that this attribute takes part in a completely accurate semantic relationship with other more significant attributes of its own cluster.
In the case that the Unevaluated Record does not belong to any Deterministic Cluster since a value like “a” is assigned to an attribute like “A”, an uncertain situation comes up. The following two possible assumptions could be considered:
The first assumption is that the attribute-value pair “A=a” together with other more significant attribute-value pairs appeared in the Unevaluated Record reflect a new cluster in the discussed domain that is not recognized because of the lack of its presence in Primitive Sample.
The second assumption is that, the attribute-value pair “A=a” cannot take part in an accurate semantic relationship with other more significant attribute-value pairs.
In order to deal with the uncertainty problem in measuring SemAC criterion for more significant attribute-value pair “A=a”, we have proposed a method which is elaborately discussed in the following subsection.
3.3.2.3.1 Measuring SemAC criterion for more
significant attributes in uncertain conditio
nsOur idea is that we can represent each Unevaluated Record as a conjunctive combination of its more significant attribute-value pairs. Now suppose a situation in which this conjunctive combination conform to none of the descriptive rules of the Deterministic Clusters because of a value like ”ai” that has
been assigned to one of its more significant attributes like “Ai”. Hence this representation of the Unevaluated Record
denotes a nondeterministic semantic relationship between those more significant attribute-value pairs.
In our proposed method, for each Unevaluated Record, we first try to extract a partial deterministic rule which is actually a conjunctive combination of more significant attribute-value pairs that completely conforms to the knowledge extracted from the Primitive Sample. The way of constructing partial deterministic rule is described in the following paragraphs. After extracting the partial deterministic rule from the more significant attribute-value pairs of an Unevaluated Record, for those more significant attribute-value pairs which exist in the partial deterministic rule, the value of SemAC criterion will be equal to 1.
The extraction method of partial deterministic rule from a set of more significant attribute-value pairs of an Unevaluated Record is as follow:
The first step is inserting all more significant attribute-value pairs into a list, say M, in descending order. It is done according to the attributes’ weight so that the attribute with the maximum weight is located at beginning of the list.
By starting from the beginning of the list “M”, for each specific more significant attribute-value pair, say “Ai=ai”, we try to compose the longest
conjunctive combination of more significant attribute-value pairs using the ones that exist in the “M” list. This conjunctive combination should be composed in a way that the result conforms the two following conditions concurrently:
o The result should contain only the more significant attribute-value pair “Ai=ai” and
those attribute-value pairs that their weight are less than “Ai=ai” and are
obviously located after attribute-value pair “Ai=ai” in the “M” list.
o The result of this conjunctive combination should at least be seen among one of the records of the Primitive Sample; in other words, the obtained conjunctive combination should completely conform to the Primitive Sample
The obtained conjunctive combination for each specific more significant attribute-value pair “Ai=ai”, will be placed into a list called “L”.
The next step is to seek for the longest conjunctive combinations among those that exist in the list “L” and inserting them into a new list called “Candidate”.
has the maximum value, are selected and inserted into a list named “FCandidate”.
If there is more than one rule in FCandidate list, the first rule will be selected as partial deterministic rule.
For those more significant attributes which do not take part in extracted partial deterministic rule, we consider two influential factors in order to calculate the value of their SemAC criterion. The first one is how frequent a new value like “a” has been assigned to a specific more significant attribute like “A” among the Unevaluated Records that conform to the rule of Nondeterministic Cluster which the selected record comply with. The second factor is the value of
SynAD criterion for the nondeterministic value of that more
significant attribute.
In order to deal with uncertainty in measuring SemAC criterion, our fuzzy approach uses singleton fuzzifier, a Mamdani inference engine and center average defuzzifier. The rule base of this fuzzy system, as described in Table 3, contains the rules which consider the two mentioned influential factors simultaneously.
Our proposed fuzzy system has two inputs and one output with following descriptions:
The first input of our proposed fuzzy system is shown by FrequencyForRule (A=a, R=Ri) which describes the percentage of Unevaluated Records that both contain more significant attribute-value pair “A=a” and belong to nondeterministic cluster “Ci”. FrequencyForRule input
parameter is calculated through equation (7).
FrequencyForRule A = a, R = Ri =
N(A = a, R = Ri)
N(A = a) (7)
Where Ri is a nondeterministic rule that describes the new and nondeterministic cluster Ci. N (A=a, R=Ri) is the number of Unevaluated Records that contain more significant attribute-value pair “A=a” and are in agreement to the nondeterministic rule Ri. N (A=a) is the number of the Unevaluated Records which contain more significant attribute-value pair “A=a”. The second input of our proposed fuzzy system is the value of
SynAD criterion for more significant attribute-value pair
“A=a” which has been obtained either in certain or uncertain
condition.
The output of this system indicates the value of SemAC (A=a, C=Ci) criterion for a nondeterministic attribute-value pair
“A=a” with respect to the Ci cluster, that is 0<p<1.
The membership function diagrams of the input parameter
FrequencyforRule (A=a, R=Ri) and output parameter SemAc
(A=a, C=Ci) are shown in the Fig.5 and Fig.6 respectively.
3.3.3
Calculating the accuracy of a specific
Unevaluated Record R
KThe accuracy level of Unevaluated Records is calculated based on the value of SemAC Criterion for each more significant attribute and the value of SynAC criterion for each less significant attribute using equation (8). As mentioned in previous sections, the value of SynAD criterion is needed when we want to calculate the values of SemAC and SynAC criteria in uncertain conditions.
Accuracy Rk = SemAC Ami, aim . Wim+ SynAC Ali, ail . Wil nl
i=1
(8)
nm
i=1
Where nm and nl are the number of more significant and less significant attributes respectively. In addition, 𝐴𝑚𝑖 , 𝐴𝑖𝑙, 𝑎𝑖𝑚,
𝑎𝑖𝑙are the ith more significant attribute, ith less significant
attribute, the value of ith more significant attribute in RK and the value of ith less significant attribute in Rĸ respectively.
Finally, 𝑊𝑖𝑚 and 𝑊𝑖𝑙 are the weights of ith more significant
and ith less significant attributes respectively.
It should be mentioned that the sum of all attributes’ weight is equal to 1; that is ni=1m Wim+ ni=1l Wil= 1 .
Regarding to equation (8), the accuracy value of a Deterministic Record is equal to 1 since the amounts of all three defined criteria (SynAD, SynAC and SemAC) for all its attribute-value pairs are equal to 1. On the contrary, the accuracy value of a Nondeterministic Record is a value between zero and one since at least there is an attribute-value pair for which the calculation of one of the SynAD, SynAC or SemAC criteria is done under the uncertain condition.
Fig. 5: The membership function of FrequencyForRule (A=a, R=Ri)
Fig. 6: The membership function of SemAC (A=a, C=Ci)
Table 3. The rule base of our proposed fuzzy system in calculating SemAC criterion
Rule description Rule
No.
IF SynAD(A = a) IS Low and FrequencyForRule(A = a, R = Ri) IS Low THEN SemAC(A = a, C = Ci) IS Very Low
1
IF SynAD(A = a) IS Low and FrequencyForRule(A = a, R = Ri) IS Medium THEN SemAC(A = a, C = Ci) IS Low
2
SemAC(A = a, C = Ci) IS Medium
IF SynAD(A = a) IS Medium and FrequencyForRule(A = a, R = Ri) IS Low THEN SemAC(A = a, C = Ci) IS Low
4
IF SynAD(A = a) IS Medium and FrequencyForRule(A = a, R = Ri) IS Medium THEN SemAC(A = a, C = Ci) IS Medium
5
IF SynAD(A = a) IS Medium and FrequencyForRule(A = a, R = Ri) IS High THEN SemAC(A = a, C = Ci) IS High
6
IF SynAD(A = a) IS High and FrequencyForRule(A = a, R = Ri) IS Low THEN SemAC(A = a, C = Ci) IS Medium
7
IF SynAD(A = a) IS High and FrequencyForRule(A = a, R = Ri) IS Medium THEN SemAC(A = a,C = Ci) IS High
8
IF SynAD(A = a) IS High and FrequencyForRule(A = a, R = Ri) IS High THEN SemAC(A=a, C = Ci) IS Very High
9
3.3.4
Evaluating the level of database accuracy
The accuracy level of the database is calculated through averaging the accuracy level of its records. Recall that the accuracy level of each record has been calculated by the means of three defined criteria in previous sections.
4.
Implementation details and
Experimental Results
Our proposed method has been deployed in Visual Studio 2005 environment using C# programming language. It uses WEKA, a data mining software, in order to partition the domain of numerical attributes’ values in each database table. Information is stored in SQL Server 2000 relational database system.
For evaluating our proposed method, we launched the developed system using three database tables. The first table is a synthetic table named “Personnel” and the two others are two tables of real data named “Adult” and “Credit” which are available in UCI Machine Learning Repository site. Initially, all existing records in each table were completely accurate; hence in order to simulate a real environment, we had to do the following tasks respectively:
We considered the records of each table as a dataset and divided this dataset into two subsets including: Primitive Sample Records and Unevaluated Records.
Since Unevaluated Records subset should contain some incorrect values, we wrote a program whose task was to select some records and substitute the correct values of some attributes with incorrect ones. The task of record and attribute selection was done in a completely random manner.
Our proposed method is compared to the presented method in [1] which is presented as an improvement of the presented method in [12] in evaluating the quality of relational databases.
One of the common methods for evaluating data quality level from different perspectives such as accuracy and completion is applying Simple Ratio Method [16] which its general definition is as shown in (9). The use of Simple Ratio criterion is limited to the time that we exactly know the number of
incorrect data units among the whole data. In fact, calculating the Simple Ratio criterion gives us a completely accurate, deterministic value which indicates to what extent our data conforms to what exists in the real world. But, as we all know, in order to calculate the accuracy level of data in an accurate, deterministic manner through the means such as Simple Ratio criterion, the existence of data catalog is essential since it provides necessary information such as data type and the domain of each field as well as database constraints. This catalog may not be available to us; that’s why we have to use other methods such as data mining techniques in evaluating the accuracy of our data despite of the uncertainty they have. It is obvious that the method which has the least deviation from the deterministic, accurate Simple Ratio value is the most appropriate one.
Simple Ratio =No. of desired Results No. of Total Results = 1 −
No. of undesired Results No. of Total Results 9
We have compared our proposed method with the presented method in [1] by obtaining the error of each proposed method. Error calculation is done by computing the difference between the obtained value from the Accuracy formula stated in (11) which is actually a deterministic value and the obtained accuracy value through each proposed method. Tables 4, 5, 6 illustrate this comparison for Personnel, Adult and Credit tables in detail respectively.
The Personnel table has 7 attributes, 5 of which are categorical. We have also 2 numerical attributes. There are 1000 records in Personnel table, of which 600 are evaluated. Adult table has 15 attributes, 10 of which are categorical. We have also 5 numerical attributes. This table has 1000 records, of which 600 are evaluated.
Credit table has 16 attributes, 11 of which are categorical. We have also 5 numerical attributes. This table has 500 records, of which 300 are evaluated.
In order to evaluate data quality from the accuracy point of view, the Simple Ratio formula is modified as shown in (10).
Accuracy = 1 −Number of Incorrect Data Units
Total Number of Data Units (10)
Based on the granularity level of data units, the Accuracy formula stated in (10) can be rewritten in different forms. Since our proposed method introduces three data quality evaluation criteria at the attribute level and then calculates the accuracy level of a record through the accuracy level of its own attribute-value pairs, Accuracy formula will be modified as shown in (11).
Table 4. A comparison between the evaluation results of our proposed method and the suggested method in [1] using records of personnel table.
The quality of data table measured by equation (11) The quality of
data table measured by the suggested method in [1] The quality of
data table measured by our proposed
method Average error of the
suggested method in [1] in calculating the accuracy degree of
Unevaluated Records Average error of
our proposed method in calculating the accuracy degree of
Unevaluated Records Selected threshold for choosing more significant attributes Number of records in Primitive Sample 0.8564 0.3049 0.7429 0.553 0.1164 0.12 100 0.8564 0.3049 0.7638 0.553 0.0997 0.14 100 0.8564 0.4495 0.7735 0.409 0.088 0.12 200 0.8564 0.4495 0.7735 0.409 0.088 0.14 200 0.8564 0.4495 0.7969 0.409 0.0686 0.12 400 0.8564 0.4495 0.7969 0.409 0.0686 0.14 400
Table 5. A comparison between the evaluation results of our proposed method and the suggested method in [1] using records of Adult table.
The quality of data table measured by equation (11) The quality of
data table measured by the suggested method in [1] The quality of
data table measured by our proposed
method Average error of the
suggested method in [1] in calculating the accuracy degree of
Unevaluated Records Average error of
our proposed method in calculating the accuracy degree of
Unevaluated Records Selected threshold for choosing more significant attributes Number of records in Primitive Sample 0.9250 0.5582 0.7801 0.3670 0.1450 0.06 100 0.9250 0.5582 0.7088 0.3670 0.2163 0.07 100 0.9250 0.5617 0.7969 0.3636 0.1284 0.06 200 0.9250 0.5617 0.7231 0.3636 0.2019 0.07 200 0.9250 0.5371 0.7678 0.3881 0.1574 0.06 400 0.9250 0.5371 0.7678 0.3881 0.1574 0.07 400
Table 6. A comparison between the evaluation results of our proposed method and the suggested method in [1] using records of credit table.
The quality of data table measured by equation (11) The quality of
data table measured by the suggested method in [1] The quality of
data table measured by our proposed
method Average error of the
suggested method in [1] in calculating the accuracy degree of
Unevaluated Records Average error of
our proposed method in calculating the accuracy degree of
Unevaluated Records Selected threshold for choosing more significant attributes Number of records in Primitive Sample 0.9292 0.7528 0.7678 0.1764 0.1621 0.06 100 0.9292 0.7528 0.7678 0.1764 0.1621 0.07 100 0.9292 0.7582 0.7693 0.1710 0.1606 0.06 150 0.9292 0.7582 0.7701 0.1710 0.1598 0.07 150 0.9292 0.7617 0.7834 0.1674 0.1463 0.06 200 0.9292 0.7617 0.7834 0.1674 0.1463 0.07 200
Based on the results shown in Tables 4, 5 and 6, the average error of our proposed method is considerably less than the average error of the presented method in [1]. In other words, the values that obtained through our proposed method to indicate the quality level of database tables are much closer to the actual values obtained from the Simple Ratio formula. As we can see, the comparison has been done with different number of records in Primitive Samples and various thresholds for choosing more significant attributes.
In order to better understand the impact of two factors including: number of existing records in Primitive Sample and the threshold value for selecting more significant attributes on obtained results, we have done various tests by changing these two parameters and then compared the measured accuracy of datasets that are gained through our proposed method, Simple Ratio formula and the presented method in [1]. These results are shown in Fig. 7 to Fig.18.
Situation A: measuring the accuracy level of Personnel table based on a Primitive Sample which contains 100 records. The selected threshold for choosing more significant attribute is: 0.12
Situation B: measuring the accuracy level of Personnel table based on a Primitive Sample which contains 400 records. The selected threshold for choosing more significant attribute is: 0.12
Situation C: measuring the accuracy level of Credit table based on a Primitive Sample which contains 100 records. The selected threshold for choosing more significant attribute is: 0.07
Situation D: measuring the accuracy level of Credit table based on a Primitive Sample which contains 200 records. The selected threshold for choosing more significant attribute is: 0.07
Changing the value of the threshold for selecting more significant attributes:
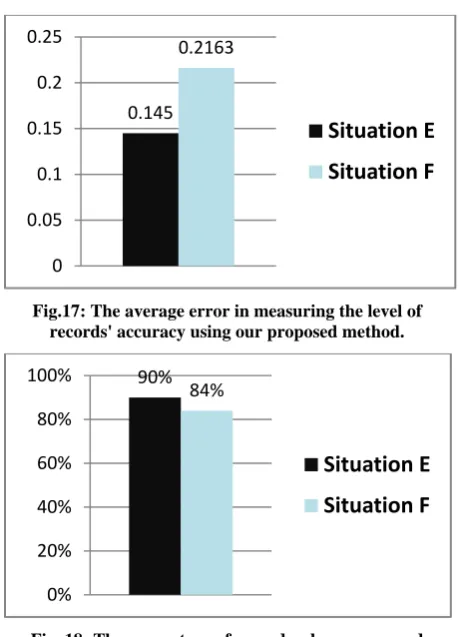
Situation E: measuring the accuracy level of Adult table based on a Primitive Sample which contains 100 records.
The selected threshold for choosing more significant attribute is: 0.06
Situation F: measuring the accuracy level of Adult table based on a Primitive Sample which contains 100 records. The selected threshold for choosing more significant attribute is: 0.07
As it is shown in Fig. 7 and Fig. 8, the accuracy level of data which is measured by our proposed method is much closer to its actual value (that is measured by Simple Ratio formula) than the one which is measured by presented method in [1]. Moreover, we can see from Fig.9 that when we increased the size of the Primitive Sample from 100 records to 400 records, the average error in measuring the level of records' accuracy was substantially declined from 0.0997 to 0.0669. Fig. 10 states that by increasing the size of Primitive Sample, the percentage of records whose measured accuracy by our proposed method is closer to the actual accuracy obtained by Simple Ratio formula than the time when it is measured by presented method in [1] has increased from 96% to 99%.
Fig. 7: The accuracy evaluation of 100 records from the Unevaluated Record set of Personnel table based on our proposed method, the suggested method in [1] and Simple Ratio Criterion. The threshold is: 0.12
Fig. 8: The accuracy evaluation of 400 records from the Unevaluated Record set of Personnel table based on our proposed method, the suggested method in [1] and Simple Ratio Criterion. The threshold is: 0.12.
0
0.2
0.4
0.6
0.8
1
1.2
401
408
419
427
434
453
463
474
481
491
503
515
529
537
551
562
576
588
604
619
The accuracy level of data
based on our proposed
method
The accuracy level of data
based on the suggested
method in[1]
0
0.2
0.4
0.6
0.8
1
1.2
401
408
419
427
434
453
463
474
481
491
503
515
529
537
551
562
576
588
604
619
The accuracy level of data
based on our proposed
method
The accuracy level of data
based on the suggested
method in [1]
Fig. 9: The average error in measuring the level of records' accuracy using our proposed method.
As it is shown in Fig. 11 and Fig. 12, we repeated the test of increasing the Primitive Sample size, this time using the actual data of Credit table from UCI Machine Learning Repository site. It can be seen that the accuracy level of data which is measured by our proposed method is again much closer to its actual value (that is measured by Simple Ratio formula) than the one which is measured by presented method in [1].
Fig. 10: The percentage of records whose measured accuracy by our proposed method is closer to the actual accuracy obtained by Simple Ratio formula than the time
when it is measured by presented method in [1].
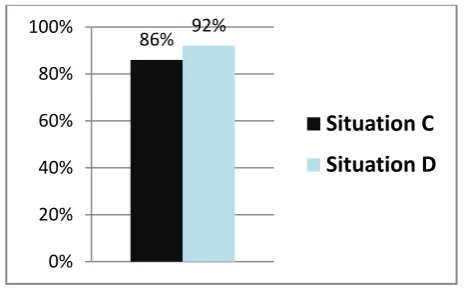
Moreover, we can see from Fig.13 that when we increased the size of the Primitive Sample from 100 records to 200 records, the average error in measuring the level of records' accuracy was declined from 0.1621 to 0.1463. Fig. 14 states that by increasing the size of Primitive Sample, the percentage of records whose measured accuracy by our proposed method is closer to the actual accuracy obtained by Simple Ratio formula than the time when it is measured by presented method in [1] has increased from 86% to 92%.
Fig. 11: The accuracy evaluation of 100 records from the Unevaluated Record set of Credit table based on our proposed method, the suggested method in [1] and Simple Ratio Criterion. The threshold is: 0.07
Fig. 12: The accuracy evaluation of 200 records from the Unevaluated Record set of Credit table based on our proposed method, the suggested method in [1] and Simple Ratio Criterion. The threshold is: 0.07
0.0997
0.0669
0
0.02
0.04
0.06
0.08
0.1
0.12
Situation A
Situation B
96% 99%
0%
20%
40%
60%
80%
100%
Situation A
Situation B
0
0.2
0.4
0.6
0.8
1
203
212
233
248
262
277
286
296
310
329
346
359
368
389
409
418
430
445
452
466
The accuracy level of data
based on our proposed
method
The accuracy level of data
based on the suggested
method in [1]
The actual accuracy level of
data measured by equation
(11)
0
0.2
0.4
0.6
0.8
1
203
212
233
248
262
277
286
296
310
329
346
359
368
389
409
418
430
445
452
466
The accuracy level of data
based on our proposed
method
The accuracy level of data
based on the suggested
method in [1]
Fig. 13: The average error in measuring the level of records' accuracy using our proposed method.
As it is shown in Fig. 15 and Fig. 16, the accuracy level of data which is measured by our proposed method is much closer to its actual value (that is measured by Simple Ratio formula) than the one which is measured by presented method in [1].
Moreover, we can see from Fig.17 that when we increased the value of the threshold for choosing more significant attributes, the average error in measuring the level of records' accuracy was increased from 0.145 to 0.2163.
Fig. 14: The percentage of records whose measured accuracy by our proposed method is closer to the actual accuracy obtained by Simple Ratio formula than the time
when it is measured by presented method in [1].
Fig. 18 states that by increasing the value of the threshold for choosing more significant attributes, the percentage of records whose measured accuracy by our proposed method is closer to the actual accuracy obtained by Simple Ratio formula than the time when it is measured by presented method in [1] has declined from 90% to 84%.
Fig. 15: The accuracy evaluation of 100 records from the Unevaluated Record set of Adult table based on our proposed method, the suggested method in [1] and Simple Ratio Criterion. The threshold is: 0.06
Fig. 16: The accuracy evaluation of 100 records from the Unevaluated Record set of Adult table based on our proposed method, the suggested method in [1] and Simple Ratio Criterion. The threshold is: 0.07
0.1621
0.1463
0.135
0.14
0.145
0.15
0.155
0.16
0.165
Situation C
Situation D
86%
92%
0%
20%
40%
60%
80%
100%
Situation C
Situation D
0
0.2
0.4
0.6
0.8
1
402
421
435
466
484
496
525
540
559
571
594
612
627
643
651
666
678
693
703
730
The accuracy level of data
based on our proposed
method
The accuracy level of data
based on the suggested
method in [1]
0
0.2
0.4
0.6
0.8
1
402
421
435
466
484
496
525
540
559
571
594
612
627
643
651
666
678
693
703
730
The accuracy level of data
based on our proposed
method
The accuracy level of data
based on the suggested
method in [1]
Fig.17: The average error in measuring the level of records' accuracy using our proposed method.
Fig. 18: The percentage of records whose measured accuracy by our proposed method is closer to the actual accuracy obtained by Simple Ratio formula than the time
when it is measured by presented method in [1].
5.
CONCLUSION AND THE FUTURE
WORK
As the use of information systems is growing, the adverse outcome of using data with low quality and its negative influence on decision making becomes more tangible; so evaluating the quality of the data to gain an accurate knowledge seems to be vital.
Missing values and incorrect data are the two important issues which strongly lead to decrease data quality in databases. In order to calculate the accuracy level of data in an accurate, deterministic manner, the existence of data catalog is essential since it provides necessary information such as data type and the domain of each field as well as database constraints. This catalog may not be available to us; that’s why we have to use other methods such as data mining techniques in evaluating the accuracy of our data despite of the uncertainty they have. Our proposed method which uses data mining techniques to evaluate accuracy dimension of data quality, has overcome the problems that other existing methods suffer from. Unlike all other existing methods, our proposed method concerns numerical features as well as categorical ones and evaluates the accuracy of attributes' values in a hierarchical manner based on three defined criteria. These three defined criteria evaluate the accuracy of the values both synthetically and semantically.
In order to deal with uncertainty problems in measuring each criterion, we have proposed a fuzzy approach which uses singleton fuzzifier, a Mamdani inference engine and center average defuzzifier.
Based on the obtained results shown in previous section, the accuracy level of data which is measured by our proposed method is very close to its actual value that is measured by Simple Ratio formula. Moreover, we have found that by either increasing the Primitive Sample size or decreasing the threshold value for selecting more significant attributes, the average error in measuring the level of records' accuracy will decline.
The following are some issues that could be considered as future work:
Replacing the clustering algorithm which has been used in our proposed method with other existing clustering algorithms to see whether they can improve the results or not.
Changing the applied membership functions and inference engine that have been used in our proposed method with other existing ones to see whether they can improve the results or not. The use of ontologies in data mining based
approaches to evaluate the quality of those attributes that contain non-categorical and string-based values; since the only way for evaluating such values is tracing existing semantic relations between the values which have been assigned to such given attribute.
Using a combination of NLP and data mining techniques to evaluate the quality level of semi-structured and unsemi-structured data such as XML, HTML and text files.
The use of other data mining techniques such as time series to evaluate the quality level of sequence databases.
Proposing a data quality evaluation framework and using the combination of different methods in hierarchical manner to evaluate data quality level.
6.
REFERENCES
[1] Partabiyan, J., Mohsenzadeh, M. 2009. Database quality evaluation using a data mining technique, Science and Research Branch, Islamic Azad University, Tehran, Iran. [2] Ghazanfari, M., Alizadeh, S., and Teymourpour, B.
2008. Data Mining and Knowledge Discovery, Publish Center of Iran University of Science & Technology, Tehran, Iran.
[3] Wang, L., Teshnehlab, M., Saffarpour, N., Afuni, D. 2008. Fuzzy Systems and Fuzzy Control, Publish Center of K.N Toosi university of Technology, Tehran, Iran. [4] Amir A., Lipika, D. 2007. A k-mean clustering algorithm
for mixed numeric and categorical data, Solid State Physics Laboratory, Timarpur, Delhi India, ScienceDirect.
[5] Amir, A., Lipika, D. 2007. A method to compute distance between two categorical values of same attribute in unsupervised learning for categorical data set, Solid State Physics Laboratory, Timarpur, Delhi India, ScienceDirect.
[6] Augustin-Iulian Ionescu, Eugen Dumitrascu, 2004. Database Quality-Some Problems, 7th International Conference on Develpment and Application Systems, Suceava, Romania.


![Table 4. A comparison between the evaluation results of our proposed method and the suggested method in [1] using records of personnel table](https://thumb-us.123doks.com/thumbv2/123dok_us/1326001.1640737/10.595.48.552.493.644/table-comparison-evaluation-results-proposed-suggested-records-personnel.webp)
![Fig. 7: The accuracy evaluation of 100 records from the Unevaluated Record set of Personnel table based on our proposed method, the suggested method in [1] and Simple Ratio Criterion](https://thumb-us.123doks.com/thumbv2/123dok_us/1326001.1640737/11.595.58.527.320.456/accuracy-evaluation-records-unevaluated-personnel-proposed-suggested-criterion.webp)