Original Research Article
Outcome of nutritional intervention measures at a nutrition
rehabilitation centre in Krishna district, Andhra Pradesh
Deepthi Pagali
1, Suneetha Bollipo
2*, Harsha B. Korrapolu
1, Mohammed Abdul Rahman
1INTRODUCTION
Undernutrition is one of the most concerning health and development issues in India as well as in other parts of the developing world. Undernutrition encompasses stunting (chronic malnutrition), wasting (acute malnutrition) and deficiencies of micronutrients (essential vitamins and minerals). Acute malnutrition, or wasting, is defined using anthropometric cutoffs and clinical signs. The currently accepted definitions, set out by the WHO, are as follows: Moderate acute malnutrition (MAM), defined as weight-for-height z-score (WHZ) between −2 and −3 or mid-upper arm circumference (MUAC) between 115 millimeters and <125 millimeters. Severe acute malnutrition (SAM), defined as WHZ < −3 or MUAC < 115 millimeters, or the presence of bilateral pitting edema, or both. Global acute malnutrition (GAM)
refers to MAM and SAM together; it is used as a measurement of nutritional status at a population level and as an indicator of the severity of an emergency situation. The high mortality and disease burden resulting from undernutrition calls for an urgent implementation of interventions to reduce their occurrence and consequences. This would include determined action on the social determinants of undernutrition.1 NFHS 4 shows that the proportion of children who are stunted or underweight increases rapidly with the child’s age from birth to age 20-23 months; peaking at age 20 months. It is notable that by age 18-23 months, when many children are being weaned from breast milk, 30 percent of children are severely stunted, and one-fifth are severely underweight. The levels of child undernutrition are unacceptably high in almost all states. Undernutrition is associated with high rates of mortality and morbidity and is an underlying factor in almost one-third to half of all
ABSTRACT
Background: Nutrition rehabilitation centre (NRC) is a unit in a district health facility, where children with severe
acute malnutrition are admitted and provided with nutritional and therapeutic care.
Methods: Analysis of nutritional data of all the children admitted to NRC at Krishna district from January 2017 to
July 2018. Statistical analysis was done using SPSS.
Results: A total of 200 children were included in the study. The overall mean weight at admission was found to be
8.30 kg with a standard deviation of 2.35 kg and the mean weight at the time of discharge is 9.57 kg with a standard deviation of 2.61 kg. There is a statistically significant difference in weight and mid arm circumference at admission and discharge. Mean duration of hospital stay is around 18.67±5.4 days. Target weight is achieved in 71% of the study group.
Conclusions: Present study reflects that NRCs have been playing a key role to cope up with the problem of severe
acute malnutrition as demonstrated by a high rate of weight gain at discharge as well as during follow ups.
Keywords: Severe acute malnutrition, Nutrition rehabilitation centre, Weight for height
Department of Pediatrics, 1Siddhartha Medical College, Vijayawada, 2ACSR Medical College, Nellore, Andhra Pradesh, India
Received: 01 November 2018
Accepted: 21 November 2018
*Correspondence:
Dr. Suneetha Bollipo,
E-mail: [email protected]
Copyright: © the author(s), publisher and licensee Medip Academy. This is an open-access article distributed under
the terms of the Creative Commons Attribution Non-Commercial License, which permits unrestricted non-commercial use, distribution, and reproduction in any medium, provided the original work is properly cited.
children under five years who die each year of preventable causes. Strong evidence exists on synergism between undernutrition and child mortality due to common childhood illnesses including diarrhea, acute respiratory infections, malaria and measles. According to the National Survey (NFHS-4, 2015-16) 47.2 percent children under age of five years are underweight (low weight for age), 41.2 percent children under five are stunted (low height for age), and 25.4 percent children under five years of age are wasted (low weight for height). Over 7.2 per cent of these children are severely wasted (<-3SD).2
Nutrition rehabilitation centre (NRC) is a unit in a health facility where children with malnutrition are admitted and managed. Children are provided with medical and nutritional therapeutic care. Once discharged from the NRC, the child continues to be in the Nutrition Rehabilitation program till she/he attains the defined discharge criteria from the program. The child would be followed up for a period of 3 months, with a total of 4 visits at the outpatient, NRC clinic. In addition to curative care, special focus is given on timely, adequate and appropriate feeding for children; and on improving the skills of mothers and caregivers on complete age appropriate caring and feeding practices. In addition, efforts are made to build the capacity of mothers/caregivers through counselling and support to identify the nutrition and health problems in their child.3 Thus it is necessary to analyse the effects of NRCs in improving the health and nutritional status of children periodically. Present study is carried out to assess the effects of nutritional intervention measures on the children admitted to nutrition rehabilitation centre at our place.
METHODS
The present study is an observational, descriptive; hospital based prospective study carried out at NRC, Government General Hospital, Vijayawada, Andhra Pradesh, India. This centre caters to the entire Krishna district as well as few villages from the bordering West Godavari and Guntur districts. Children were admitted to the NRC through outpatient NRC clinic, transfers from pediatric wards in the hospital and through referral from the community health centres. Children between 6-60 months of age group admitted to the NRC between 1st January 2017 to 31st July 2018 were included in the study.
Data is collected from NRC register, anthropometric measurements of children, as well as from parental interview. Institutional ethical clearance was obtained before under taking this study.
The following data were collected for the analysis like age, sex, social status, criteria for admission, response to the treatment, and duration of stay in the hospital. Weight, height/length, mid arm circumference and weight for height at the time of admission, discharge and follow ups (1st-4th) were recorded. The follow up dates were given to the parents at the time of discharge. Average gain in weight, height/length, and mid arm circumference at discharge and follow ups was calculated. The data was analysed using SPSS version 21 and expressed in frequency, percentages and proportions. The statistical significance was evaluated at 5% level of significance.
RESULTS
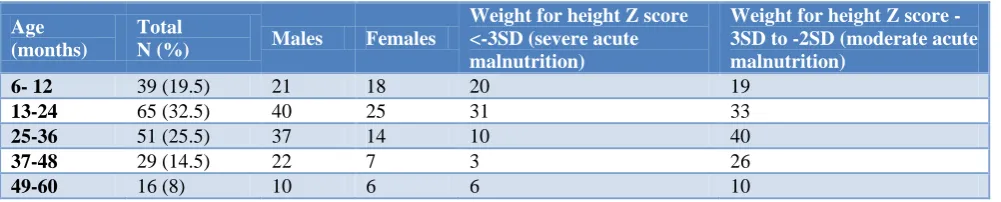
A total of 200 children were enrolled in the study, they were followed up for a period of 3 months, which included 4 post discharge follow ups at 15 days , 30 days, 45 days and 90 days after discharge. There were no drop outs from the study. Age, sex and weight for height wise distribution of the study population are shown in Table 1. 32.5% (n=65) of the children in the age group 13-24 months were found to be malnourished. 51 children (25.5%) in the age group of 25-36 months were malnourished. Among the study population, boys constituted 130 while the remaining 70 were girls. In either group, malnutrition was high between 13-24 months followed by 25-36 months age group in boys and 6-12-month age group in girls. Weight for height is less than -3 SD in 70 children (35%) while it is between -2 and -3 SD in 128 children (64%). 2 children were between -1 and -2 standard deviation. The children with weight for height less than -3 SD were more in the 13-24month age group followed by 6-12 month. On the contrary, a greater number of children in the age group 25-36 months were between -2 and -3 SD.
Table 2 depicts the distribution of malnutrition based on the caste of the child, showing high incidence in the scheduled caste (SC) group (54.5%), followed by the backward caste (BC) group (37%).
Table 1: Age, sex, weight for height wise distribution of the study population (n=200).
Age (months)
Total
N (%) Males Females
Weight for height Z score <-3SD (severe acute malnutrition)
Weight for height Z score -3SD to -2SD (moderate acute malnutrition)
6- 12 39 (19.5) 21 18 20 19
13-24 65 (32.5) 40 25 31 33
25-36 51 (25.5) 37 14 10 40
37-48 29 (14.5) 22 7 3 26
Table 2: Social status wise distribution of the study population (n= 200).
Caste Number Percentage (%)
OC 9 4.5
BC 74 37
SC 109 54.5
ST 8 4
Table 3: Distribution of children according to weight for height (n=200).
Weight for height Z score (SD)
Admission N (%)
Discharge N (%)
<-3SD 70 (35) 17 (8.5)
-2SD to -3SD 128 (64) 36 (18)
-1SD to -2SD 2 (1) 56 (28)
-1SD to median 0 (0 ) 81 (40.5)
Median 0 (0) 10 (5)
*Chi -square 225.173, p<0.05 (fisher exact test, five by two exact)
Table 3 shows the distribution of children according to weight for height at the time of admission and discharge. 70 (35%) of children were less than -3 SD at admission with a significant decrease to 17 (8.5%) at discharge. Similarly, children between -2 and -3 SD also decreased significantly with shift of children towards median. This shift in weight for height after treatment is statistically significant with Chi -square 225.173(fisher exact test, five by two exact). The p-value was significant at <0.05.
Table 4 depicts the mean weight for age, height for age and mid arm circumference at admission and discharge. The mean weight for age at the time of admission is 8.305 kg and at discharge is 9.572 kg with a mean gain of 1.267 kg. This change in weight was statistically significant (p<0.01). Similarly, mean height at the time of admission is 80.460 cm and at discharge 80.545cm with a net gain of 0.085 cm, and this change is not statistically
significant. Mean mid arm circumference is 11.988cm at the time of admission and 12.062 cm at discharge with a net gain of 0.074 cm by discharge which is also significant at p<0.05. But this change in mid arm circumference is not consistent at subsequent follow ups in all children.
Table 4: Various anthropometric parameters at admission and discharge.
Mean weight for age (kg) (SD)
Mean height for age (cm) (SD)
Mean mid arm
circumference (cm) (SD)
Admission 8.305
(2.350)
80.460
(11.29) 11.988 (0.783)
Discharge 9.572
(2.615)
80.545
(11.287) 12.062 (0.778)
Gain at discharge
1.267 (1.129)
0.085
(0.177) 0.074 (0.165)
P value (paired T test two tailed )
<0.0001* 0.32331 >0.05
0.02919 <0.05*
*= significant.
Table 5: Duration of stay in hospital.
Median Mean SD
18 18.67 5.429
The overall duration of hospital stay is around 18 days with a SD of 5.4 days (Table 5). Target weight is achieved in 142 (71%) by the time of discharge (Table 6).
Table 6: Target weight achieved.
Achieved Not achieved
Discharge 142 (71%) 58 (29%)
Table 7: Various anthropometric parameters during the 4 follow ups.
Anthropometric parameters
1st follow up Mean (SD)
2nd follow up Mean (SD)
3rd follow up Mean (SD)
4th follow up Mean (SD)
Weight gained/lost (kg) +0.134 (1.174) +0.159 (0.244) +0.169 (0.161) -0.007 (0.160)
Height gained (cm) +0.040 (0.319) +0.045 (0.319) +0.110 (1.410) +0.025 (0.221)
MAC gained/lost (cm) +0.014 (0.097) -0.0145 (0.078) -0.002 (0.729) -0.007 (0.116)
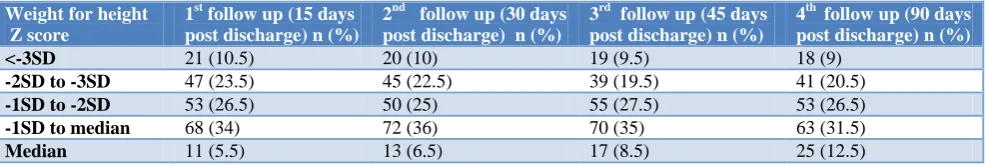
Table 8: Distribution of children according to weight for height during follow up
Weight for height Z score
1st follow up (15 days post discharge) n (%)
2nd follow up (30 days post discharge) n (%)
3rd follow up (45 days post discharge) n (%)
4th follow up (90 days post discharge) n (%)
<-3SD 21 (10.5) 20 (10) 19 (9.5) 18 (9)
-2SD to -3SD 47 (23.5) 45 (22.5) 39 (19.5) 41 (20.5)
-1SD to -2SD 53 (26.5) 50 (25) 55 (27.5) 53 (26.5)
-1SD to median 68 (34) 72 (36) 70 (35) 63 (31.5)
Median 11 (5.5) 13 (6.5) 17 (8.5) 25 (12.5)
Table 9: Number of children with weight gain/loss during the 4 follow ups.
Weight gained /lost 1st follow up n (%) 2nd follow up n (%) 3rd follow up n (%) 4th follow up n (%)
Weight gain 125 (62.5) 162 (81) 160 (80) 145 (72.5)
Weight loss 75 (37.5) 38 (19) 40 (20) 55 (27.5)
Chi-square is 22.817. The p-value is 0.000044. The result is significant at p<0.05.
The mean difference in the various anthropometric measurements during subsequent follow ups is shown in Table 7. Mid arm circumference gain is not consistently present despite a weight gain.
Table 8 shows the distribution of children based on weight for height during the follow ups. The weight for height has shifted back in some children at first follow up compared to discharge. There was some intergroup shift backwards in some children at subsequent follow ups.
Table 9 represents the number of children with weight gain/loss at each follow up compared to the previous recording. At each visit the number of children with weight gain were comparatively high than with weight loss.
DISCUSSION
NRC is one place where SAM children are managed methodically and scientifically. NRC attached to a tertiary level hospital has the added benefit of proper management of complicated SAM like shock and sepsis.
Present study showed that out of the 200 children taken as study population, majority of them (32.5%) belonged to 13-24month age group. The study group consisted of 130 boys and 70 girls. The proportion of males (65%) was greater among the admitted children. This is in contrast with other studies. Study conducted by Sanghvi et al among 300 malnourished children admitted at NRC, Indore revealed a greater number of females (52%) admitted as compared to males (48%).4 The study findings show that a major proportion of the admitted children belonged to the marginalized population groups. The findings are in accordance with that of NFHS-IV, which states that children belonging to the SC, ST, and OBC have the highest rates of malnutrition.2 The number of severe malnourished children decreased from 70 to 17 following the stay at NRCs (p<0.05).
Weight has been taken as the main anthropometric measure, as an improvement in weight of severe malnourished children has the most significant effect in reducing the mortality among them. The study findings reveal a statistically significant difference between the mean weight at discharge and the mean weight at admission for the entire study group (p<0.0001). Colecraft et al in a study at four day care NRC also reported a significant increase in weight for age for the admitted children.5 A study done by Rawat et al revealed that there was no statistically significant difference observed between the mean weight at discharge and the
mean weight at admission.6 Target weight is achieved in 71 % amongst the study group; recovery rate of 52.7% was obtained by Gaboulaud et al.7
Present study showed that mean MUAC at admission was 11.98±0.78 cm and at discharge was 12.06±0.77 cm. The difference is observed to be statistically highly significant (p<0.05). Similar to the study done by Taneja et al among children admitted to NRCs in Madhya Pradesh which revealed that mean MUAC at admission was 11.32±1.18 cm and at discharge was 11.94±1.38 cm. The difference was observed to be statistically significant.8
The change in the height of children can be observed only with long follow up periods. In the present study the mean duration of stay at NRC is 18 days and hence the significant difference in the mean height of children is not observed.
The average length of stay at the NRC is 18±5.42 days as opposed to the guidelines of 14 days of duration. This is like that seen in other studies conducted by Shah et al where the duration was 16 days and Taneja et al where the duration of stay was 14 days.8,9
In the present study it is observed that there is significant weight gain from admission to the discharge and from discharge to third follow up. The same result was also found in various other studies conducted by Colecraft et al, Gaboulaud et al, Taneja et al, Savadago et al.5,7,8,10 But the weight gain is not present at fourth visit which could be due to lack of adequate information on health issues and composition and preparation of therapeutic diets amongst mothers.
CONCLUSION
The NRCs are effective in improving the condition of admitted children, but the effects are not sustained following discharge due to lack of adequate parental awareness. There is an urgent need to link these centres with community-based models for follow-up and improve health education measures to maintain the gains achieved.
ACKNOWLEDGEMENTS
The staff, counsellors and patients of NRC centre in our hospital.
Funding: No funding sources Conflict of interest: None declared
REFERENCES
1. Available at: http://rajswasthya.nic.in/MTC Guideline- MOHFW.pdf. Accessed on 16 October 2016.
2. Available at: http://rchiips.org/NFHS/NFHS-4Reports/India.pdf. Accessed on 16 October 2016.
3. Available at:
https://www.who.int/nutrition/publications/guide_in patient_text.pdf. Accessed on 16 October 2016. 4. Sanghvi J, Mehta S, Kumar R. Predicators for
Weight Gain in Children Treated for Severe Acute Malnutrition: A Prospective Study at Nutritional Rehabilitation Centre. ISRN Paediatr. 2014;1:1-5. 5. Colecraft EK, Marquis GK, Bartolucci AA, Pulley
L, Owusu WB, Maetz HM. A longitudinal assessment of the diet and growth of malnourished children participating in nutrition rehabilitation centres in Accra, Ghana. Public Health Nutrition. 2004;7(4):487-94.
6. Rawat R, Marskole P. A Study to Evaluate the Effect of Nutritional Intervention Measures on Children with Severe Acute Malnutrition Admitted in Nutrition Rehabilitation Centre at Civil Hospital Bairagarh, Bhopal, Madhya Pradesh. J Evolution Med Dental Sci. 2015;4(17):2934-9.
7. Gaboulaud V, Dan-Bouzoua N, Brasher C, Fedida G, Gergonne B, Brown V. Could Nutritional
Rehabilitation at Home Complement or Replace Centre-based Therapeutic Feeding Programmes for Severe Malnutrition? J Trop Pediatr. 2007;53:49– 51.
8. Taneja G, Dixit S, Khatri AK, Yesikar V, Raghunath D, Chourasiya S. A study to evaluate the effect of nutritional intervention measures on admitted children in selected nutrition rehabilitation centres of Indore and Ujjain divisions of the state of Madhya Pradesh(India). Indian J Community Med. 2012;37:107-15.
9. Shah RH, Javdekar BB. Management of children with severe acute malnutrition: experience of nutrition rehabilitation centre at Baroda, Gujarat. Int J Contemp Pediatr. 2014;1:3-6.
10. Savadogo L, Zoetaba I, Donnen P, Hennart P, Sondo BK, Dramaix M. Management of severe acute malnutrition in an urban nutritional rehabilitation centre in Burkina Faso. Rev Epidemiol Sante Publique. 2007;55:265–74.
Cite this article as: Pagali D, Bollipo S, Korrapolu