Original Research Article
Morbidity profile of truck drivers: a South Indian cross-sectional study
Anil C. Mathew
1*, Ramamoorthy Veyilmuthu
2, Subash Palanisamy
2,
Xavier Christu Rajan Vargheese
2INTRODUCTION
Non communicable diseases are considered as one of the major health and development challenges of 21st century. The social and economic effect of increased morbidity and mortality associated with cardiovascular disease is a great challenge that has to be encountered in these decades.1,2 Recent studies done in other countries have shown that workers in the transport industry are more predisposed to cardiovascular morbidity due to their improper diet and sedentary behavior and unhealthy life
styles. The commonly seen morbidities reported among truck drivers were diabetes mellitus, obesity, hypertension and heart disease.3-6 However, most of the research done in India among the truck drivers, have focused only on their sexual health. To the extent of our knowledge, very few studies were done in India to assess other co morbidities like cardiovascular morbidity profile. Many studies done in other parts of the country have reported that professional truck drivers and other road transport professionals have a higher risk of ischemic heart disease.7-9
ABSTRACT
Background: Recent studies have shown that workers on the transport industry are more predisposed to
cardiovascular morbidity and other health morbidities due to their improper diet and sedentary lifestyle. This study was aimed at assessing the common morbidity profile among the truck drivers and associated demographic and clinical parameters considered relevant to the development of cardiovascular disease.
Methods: This was a cross sectional study conducted among 175 truck drivers aged 18-60 years at the Walayar check
post, Coimbatore, southern India. After getting informed consent, a detailed physical examination was conducted. Socio demographic information was also elicited.
Results: It was observed that 50% of the truck drivers were overweight and obese. Hypertensives were 41.1% and
diabetics were 12%. About 27.4% had raised systolic blood pressure (BP) and 29.1% had raised diastolic BP. Low back pain was observed in 34.3%, hip pain in 24.6%, knee pain in 9.7%, shoulder pain in 5.4%, diminished vision in 4.6%, giddiness in 2.3% and hearing defects in 1.1% of the truck drivers.56.6% were current smokers and 66.3% were taking alcohol consumption more than 4 times a month. Older age was found to be a significant independent predictor [odds ratio OR 1.04 (95% CI 1.03-1.05)] for the total number of cardio vascular disease morbidities.
Conclusions: We observed a higher morbidity among the truck drivers and observed that periodic health appraisals
are needed.
Keywords: Truck driver, Morbidity, Hypertension
1
Department of Community Medicine, 2Department of Physical Medicine and Rehabilitation, PSG Institute of Medical Sciences and Research, Coimbatore, Tamil Nadu, India
Received: 01 August 2019
Revised: 08 September 2019
Accepted: 09 September 2019
*Correspondence:
Dr. Anil C. Mathew,
E-mail: [email protected]
Copyright: © the author(s), publisher and licensee Medip Academy. This is an open-access article distributed under
the terms of the Creative Commons Attribution Non-Commercial License, which permits unrestricted non-commercial use, distribution, and reproduction in any medium, provided the original work is properly cited.
Objectives
Considering the importance of truck drivers to our country’s economy, more studies are needed to assess their morbidity profile in general and associated risk factors. Considering the inherent risks associated with the profession of truck driving and scarcity of studies aimed at evaluating the cardiovascular risk of morbidity profile in their profession, this study was aimed to assess the morbidity profile among truck drivers in general and to assess the independent predictors of the total number of cardiovascular risk factors identified among them. Thus, this study focused on truck drivers, whose working conditions favor the development of a set of cardiovascular risk factors and simultaneously impose difficulties in accessing health care and adhering to life style changes that enhance quality of life. The results would provide important information to be used at personal and community level to develop strategies and actions targeted at the prevention of cardio vascular disease and the promotion of general health of these workers.
METHODS
Study design, setting and participants
A cross sectional study was conducted on 25th August 2016 among 175 truck drivers aged 18-70 years at the Walayar check post, Coimbatore, Southern India. Ethical clearance was obtained from Institute Human ethics committee, PSG IMS&R. We also got permission from highway transport authorities. The study was conducted at Walayar check post which is located on a national highway of South India on 23rd August 2016 between 10am to 4pm. Drivers who came with valid driving license for submission of documents at the check post and those who gave informed consent were included. A detailed physical examination was conducted. Socio demographic questions were also included. Truck drivers with known congenital heart disease and genetic disorders were excluded. The truck drivers who exhibited risk factors were informed about their condition and advised to attend health care services.
Variables and measurement
Demographic details were collected first followed by measurement of systolic and diastolic blood pressures using mercury sphygmomanometer, two times over a period of 10 minutes and the mean value was calculated. Digital weighing machine was used to measure weight nearest to 0.1 kg. Height was measured with bare foot nearest to 0.1 cm using calibrated stadiometer. Random blood sugar was also measured. The following criteria and definitions were used: family history of CVD: when the individual mentions the occurrence of heart disease in a first degree relative, history of chronic diseases: truck drivers were asked whether they had been previously been diagnosed with any chronic diseases and what
medicines they were taking, subjects were considered physically active if they are performing aerobic (walking, biking, dancing and racing) or anaerobic activities (body building) at least 150 minutes in a week and moderately active if they do 10 to 150 minutes in a week and insufficient if they do less than 10 minutes in a week, subjects were considered active smokers if they use tobacco daily in any quantity or at quit smoking in the previous 12 months. Subjects were considered non-smokers if they had not used tobacco for the past 12 months. For determining the body mass index (BMI) the truck drivers were weighed (in kg) without shoes on a 150kg mechanical anthropometric scale and height in meter. The BMI levels were classified according to the WHO guidelines; subjects were normal if their BMI was 18.5-24.5 kg/m2, overweight if their BMI was 25.0-29.9 kg/m2.11 Grade 1 obese if the BMI was 30.0-34.9kg/m2, grade 2 obese if the BMI was 35.0-39.9 kg/m2 and grade 3 obese if the BMI was ≥40.0 kg/m2. Hypertension was defined as systolic blood pressure greater than or equal to 140 mm Hg or diastolic blood pressure greater than or equal to 90 mmHg. Self-reported history of previously known disease was also included.
Sample size
With an expected prevalence of hypertension as 45% and 20% allowable error of prevalence, the minimum sample size required for the study was 122.1 With a non-response rate of 20%, the total sample required for this study was 153. A total 175 truck drivers were studied.
Statistical methods
RESULTS
Descriptive data
Table 1 shows some characteristics among the 175 truck drivers studied. The population consist young adults with
mean age of 39.38 years with a range of 22 years- 67 years. 50% of the subjects were aged 40 years and above, 137 (78.3%) were ever married, 112 (64%) had education only up to 10th standard, 56% were current smokers, 66.3% consume alcohol more than 4 times a month and 42% had family history of CVD.
Table 1: Baseline demographic characteristics (n=175).
Variable % Minimum Maximum Mean Median
Age (years) 22 67 39.38 39.00
Physical activity (in minutes per week) 0 460 93.25 0.00
Weight (kg) 46 100 73.23 73.00
Height (cm) 144 185.50 169.55 170.00
Body mass index (kg/m2) 16.90 36.13 25.47 24.96
Systolic blood pressure (mmHg) 70 190 127.80 130.00
Diastolic blood pressure (mmHg) 55 120 80.29 80.00
Family history of CVD 41.7
Smoking 56.0
Alcohol consumption 66.3
Table 2: Morbidity profile observed.
Number (n=175) %
Hypertension 72 41.1
Diabetes 21 12
Overweight/ obesity 86 49.1
Low back pain 60 34.3
Hip pain 43 24.6
Knee pain 17 9.7
Shoulder pain 10 5.4
Diminished vision 8 4.6
Giddiness 4 2.3
Hearing defects 2 1.1
Table 3: Distribution of hypertension according to body mass index.
Hypertension
BMI 25 kg/m2 (n=89)
BMI 25-29.99 kg/m2 (n=72)
BMI≥ 30 kg/m2
(n=14)
N % N % N %
Systolic only 18 20.2 25 34.7 5 35.7
Diastolic only 19 21.3 24 33.3 8 57.1
Systolic + diastolic 27 30.3 35 48.6 8 57.1
General hypertension 28 31.5 36 50.0 8 57.1
Table 4: Distribution of Study subjects based on systolic and diastolic blood pressure.
Classification Cut point Number %
Optimal SBP<120 28 16
Normal SBP 120-129 40 22.9
High normal SBP 130-139 59 33.7
Hypertension SBP ≥140 48 27.4
Optimal DBP<80 49 28
Normal DBP 80-84 73 41.7
High normal DBP 85-89 2 1.1
Outcome data
The analysis of the parameters obtained during the clinical evaluation shows that (Table 2), 41.1% were having hypertension, 34.3% were having low back pain, 24.6% were having hip pain and 12 5% were diabetes. It was observed that 41.1% were overweight (Table 3) and 8.05 were obese. It was also observed that 1 subject was underweight. It was also observed that the mean BMI (Table 1) of 25.47 kg/m2 was found to be in the overweight range (25 kg/m2-29.99 kg/m2). We are observing an increasing trend in the blood pressure according to the increase in BMI (Table 4).
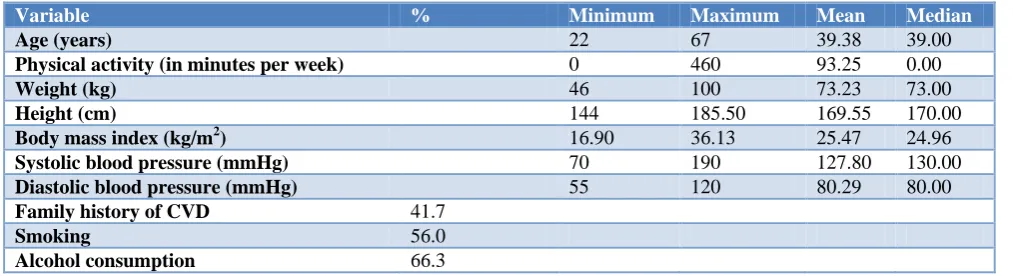
Table 5: Factors associated with the total number of morbidity using Poisson regression model.
Variable Odds ratio 95% CI P value
Higher age 1.03 1.02 -1.05 p<0.001
Positive
family history 1.04 0.83 -1.30 0.69
Smoking 1.04 0.83 -1.34 1.32
Alcohol
consumption 0.82 0.65 1.04
Physical
activity 1.00 0.99 -1.00 1.00
Figure 1: Mean (SD) of age (years) among cardio vascular disease morbidity.
In our study, 59 truck drivers (33.7%) were considered high normal and 48 truck drivers (27.4%) were hypertensive considering systolic blood pressure. Based on diastolic blood pressure, 2 drivers (1.1%) were considered as high normal and 51 drivers (29.1%) were hypertensive. The prevalence of overweight and diabetes were higher in this study population compared to the recent study at Hyderabad in the year 2014. The prevalence of hypertension was similar to the reported prevalence of Hyderabad.10
Main results
It was observed that the mean is approximately equal to variance. From the results from Kolmogov Smirnov test,
it is concluded that the total number of morbidity follows Poisson distribution (z=0.665, p=0.768) and hence decided to Poisson regression analysis. On using Poisson regression model, Age was found as a significant independent predictor [OR 1.03 (95% CI 1.02-1.05)] for the total number of cardio vascular disease morbidity. It was also observed that mean age of truck drivers with risk factors were between 42.45 years to 46.95 years which is the most productive years putting them at risk of CVD morbidity (Table 5).
Other analyses
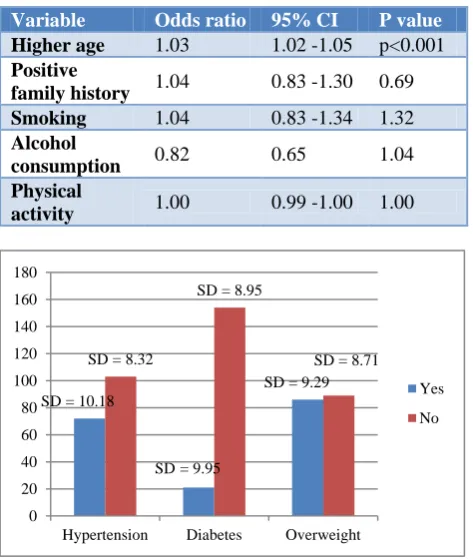
On further analysis it was observed that, a significant difference in the mean (SD) age of truck drivers between those who have hypertension 42.48 (10.18) compared with those who do not have hypertension 37.21 (8.32) (p<0.001). A similar difference in the age was observed for diabetes 46.95 (9.95) versus non diabetes 38.35 (8.95) (p<0.001) and for overweight and obesity 42.45 (9.29) versus others 36.41(8.71) (p<0.001).
DISCUSSION
The aim of the present study was to characterize a population of truck drivers with regard to demographic and clinical variables and the presence of cardiovascular risk factors. Our study highlights the need to retrospectively evaluate and systematize the presence of various risk factors in the population of long distance truck drivers. The main finding of our study is that truck drivers have a high prevalence of multiple factors that put them at high risk of cardiovascular events. This is an alarming prospect given the morbidity and mortality rates in the south Indian population and the risks these events pose to truck drivers and others who use roads.
Our study results showed that there is a high prevalence of behavioral risk factors such as overweight, obesity, hypertension, diabetes among the truck drivers and these risk factors were higher at older ages. A number of studies done on other parts other country have demonstrated that high prevalence of obesity among workers in the transport industry. According to Moreno et al., this category of workers in Brazil has a higher incidence of obesity, physical inactivity, inadequate diet, smoking habits, high levels of cholesterol and glycemia, hypertension, and obstructive sleep apnea in comparison to the general population in Brazil.11,12 A study carried out in the United States involving more than 600 thousand workers found the highest prevalence of obesity to be among male employees who work as highway truck drivers.13 A representative sample of the Australian in productive age compared ten different functional categories with regards to the risk of obesity and found that male employees of the transportation industry had a higher risk of overweight and obesity.14 In our study, it was observed that nearly one third of the truck drivers were having low back pain (LBP). It has been pointed out by several studies that the factors leading occupational
SD = 10.18
SD= 9.95
SD = 9.29 SD = 8.32
SD = 8.95
SD = 8.71
0 20 40 60 80 100 120 140 160 180
Hypertension Diabetes Overweight
Yes
LBP among truck drivers include exposure to vibration, repeatedly lifting heavy objects, strained postures, and sitting for work for many hours.15 In a recent study conducted at Japan it was observed that 52.9% of the truck drivers were having LBP. Most drivers pointed out that vibration and road shock account for the LBP. Troup et al. noted that muscle fatigue due to mechanical stress such as road shock transmitted to the body and a restricted sitting posture contribute to truck drivers’LBP. From the viewpoint of prophylaxis, an improvement in the working condition is needed to reduce the incidence of drivers, LBP to some extent.
In this study we observed higher prevalence of hypertension among truck drivers. According to World Health Organization, systolic blood pressure greater than 115 mm Hg accounts 62% of cases of cardiovascular disease and 49% of cases of ischemic heart disease.16 Moreover, arterial hypertension is one of the major risk factors of cerebro vascular accident. Many studies have also demonstrated an increase in the prevalence of systemic hypertension among professional drivers.17,18
In our study older age was found to be an independent predictor of the total cardiovascular morbidity profile life span. With aging, there is an increased acquisition of several CVD risk factors in an individual’s life span. Several studies have shown that when age and other risk factors are used jointly to examine an individual’s risk of CVD,it has been found that the contribution of age in the multivariate models may be a reflection of the intensity and duration of exposure to the traditional CVD risk factors.19-23 Avoidance of these traditional risk factors at younger ages can reduce CVD risk associated with age per se.
People employed in the transport sector form a considerable workforce of our nation.24-28 Intersectorial consideration between transport department and health department is needed to protect and provide health to transport employees. Thorough periodical medical examinations are to be conducted to these truck drivers and necessary steps are to be taken. In addition strict guidelines about diet are to be formulated to the truck drivers. In addition it is observed that the truck drivers must be educated at their younger age preferably early thirties to prevent overweight and obesity and thereby to reduce hypertension. Regular health education programs are to be conducted regarding various non-communicable diseases and attendance to such programs should be made compulsory. Strict guidelines about diet are to be formulated and implemented in all the eateries catering to the employees. Various recreational facilities, counseling centers with psychologists are to be established in all depots to help the employees cope with their stress.
Limitations
Our study has some limitations. First, this study does not allow the determination of causal associations since we
used cross sectional study design. Another limitation of our study is that, we have not quantified the smoking and alcohol intake. Fasting blood sugar values were not studied. Because we were looking for a cluster of cardio vascular risk factors, another limitation of this study was the lack of measurements on lipid profiles or inflammatory markers.
CONCLUSION
In conclusion, we observed a higher morbidity among the truck drivers’ ages. The data in the present study allow us to draw conclusion that truck drivers are highly vulnerable to developing CVD because of the high prevalence of variety of risk factors. Furthermore we must consider that the truck drivers we studied were adult men and that cardiovascular risk factors could decrease their maximum age and it affects their economy, the lives of the truck drivers and individuals who use the roads.
Recommendations and generalizability
More national studies are needed to look into what percentages of road traffic accidents involving human error and what percentages involve medical conditions involving cardiovascular conditions. Accordingly guidelines for the minimum standards required for fitness to drive those drivers with CVD. However, the driving restrictions may have disadvantage in the form of psychosocial effects on recipients and their family members. Instead, regular health education programs and appropriate healthcare action based on comprehensive public policies that focus on the truck drivers work environment and monitoring of these factors must be established at the national level. Accordingly various recreational facilities and counseling centers are to be established in highways for the truck drivers. Finally, intersectorial coordination between transport department and health department is needed to protect and promote health of transport employees.
ACKNOWLEDGEMENTS
The authors are deeply thankful to Dhanush M, and Prem Anand ES, medical interns helped us in conducting the study and in collecting clinical data. The authors are extremely thankful to Dr.SL Ravi Shankar, Professor and Head of the Department of Community Medicine, PSG Institute of Medical sciences and Research for his valuable guidance at various stages of the study. The authors are thankful to Mr. Abdul Navas, Regional Transport officer, Palghat for permitting us to do this study. We are thankful to Mr.vinod, Head of marketing and Mr. Sirajudeen for helping us to organize and conduct this study.
Funding: No funding sources Conflict of interest: None declared
Ethical approval: The study was approved by the
Institutional Ethics Committee of PSG Institute of
REFERENCES
1. Udayar SE, Sampath S, Arun D, Sravan S. Epidemiological study of cardiovascular risk factors among public transport drivers in rural area of Chittoor district of Andhra Pradesh. Int J Community Med Public Health. 2017;2(4):415-20. 2. Sharvanan EU, Konduru RK, Praveen BA Pawan K,
sivachandran V, Srinivas T. Study of cardiovascular risk factors among transport drivers in rural area of Andhra Pradesh. Int J Res Health Sci. 2014;2(1):420-6.
3. Hirata RP, Sampaio LM, Leitão Filho FS, Braghiroli A, Balbi B, Romano S, et al. General characteristics and risk factors of cardiovascular disease among interstate bus drivers. Scientific World J. 2012;2012.
4. Tṻchsen F, Andersen O, Costa G, Filakti H, Marmot MG. Occupation and ischemic heart disease in the European community: a comparative study of occupations at potential high risk. Am J Industrial Med. 1996;30:407-14.
5. Shin SY, Lee CG, Song HS, Kim SH, Lee HS, Jung MS, et al. Cardiovascular Disease Risk of Bus Drivers in a City of Korea. Ann Occupational Environ Med.1996;30:407-14.
6. Bigert C, Klerdal K, Hammer N, Hallqvist J, Gustavsson P. Time trends in the incidence of myocardial infarction among professional drivers in Stockholm 1977-96. Occupational Environ Med. 2004;61(12):987-91.
7. Malinauskiene V. Truck driving and risk of myocardial infarction. Przeglad lekarski. 2003;60:89-90.
8. Albright CL, Winkleby MA, Ragland DR, Fisher J, Syme SL. Job strain and prevalence of hypertension in a biracial population of urban bus drivers. Am J Public Health. 1992;82(7):984-9.
9. Ragland DR, Winkleby MA, Schwalbe J, Holman BL, Morse L, Syme SL, Fisher JM. Prevalence of hypertension in bus drivers. AAOHN J. 1989;37(2):71-9.
10. Sharma PK, Ganguly E. Morbidity profile of long distance truck drivers in Hyderabad city, India. J Dr. NTR Univ Health Sci. 2014;10;3(4):234.
11. WHO Expert Consultation. Appropriate body-mass index for Asian populations and its implications for policy and intervention strategies. Lancet. 2004;363:157-63.
12. Moreno CR, Louzada FM, Teixeira LR, Borges F, Lorenzi‐Filho G. Short sleep is associated with obesity among truck drivers. Chronobiol Int. 2006;23(6):1295-303.
13. Caban AJ, Lee DJ, Fleming LE, Gómez-Marín O, LeBlanc W, Pitman T. Obesity in US workers: The national health interview survey, 1986 to 2002. Am J Public Health. 2005;95(9):1614-22.
14. Allman-Farinelli MA, Chey T, Merom D, Bauman AE. Occupational risk of overweight and obesity: an
analysis of the Australian Health Survey. J Occupational Med Toxicol. 2010;5(1):14.
15. Troup JDG. Drivers bavk pain its prevention: A review of the postural, vibratory and muscular factors, together with the problem of transmitted road-shock. Applied Ergonomics. 1978: 207-214. 16. Kelsey JL, Hardy RJ: Driving of motor vehicles as a
risk factor for acute herniated lumbar intervertebral disc. Am J Epidemiol. 1975;102:63-73.
17. Kelsey JL: An epidemiological study of acute herniated lumbar intervertebral disc. Rheumatol Rehab. 1975;14:144-59.
18. Frymoyer JW, Pope MH, Clements JH. Risk factors in LBP: An epidemiological survey. J Bone Joint Surg. 1983;65:213-8.
19. Bovenzi M, Zadini A. Self-reported Low Back Symptoms in Urban Bus Drivers Exposed to Whole-Body Vibration. Spine. 1992;17:1048-59. 20. Yusuf S, Reddy S, Ounpuu S, Anand S. Global
burden of cardiovascular diseases: part I: general considerations, the epidemiologic transition, risk factors and impact of urbanization. Circulation. 2001;104:2746-53.
21. Lopez AD, Mathers CD, Ezzati M, Jamison DT, Murray CJ. Global and regional burden of disease and risk factors, 2001: systematic analysis of population health data. Lancet. 2006;367(9524):1747-57.
22. Bigert C, Gustavasson P, Hallqvis J, Hogstedt C, Lewne M, Plato N, et al. Myocardial infarction among professional drivers. Epidemiology. 2003;14(3):333-9.
23. Mathew Anil C, Veyilmuthu R, Dhanush M, PremAnand ES, Xavier ChristuRajan V. Factors associated with hypertension among truck drivers: a cross sectional study at a check post on a national highway in South India. Int J Med Res Health Sci. 2017;6(5):126-9.
24. Allman-Farinelli MA, Chey T, Merom D, Bauman AE. Occupational risk of overweight and obesity: an analysis of the Australian Health Survey. J Occupational Med Toxicol. 2010;5(1):14.
25. Miyamoto M, Shirai Y, Nakayama Y, Gemebun Y, Kaneda K. An epidemiologic study of occupational low back pain in truck drivers. J Nippon Med School. 2000;67(3):186-90.
26. Ragland DR, Winkleby MA, Schwalbe J, Holman BL, Morse L, Syme SL, et al. Prevalence of hypertension in bus drivers. Int J Epidemiol. 1987;16(2):208-14.
27. Winkleby MA, Ragland DR, Fisher JM, Syme SL. Excess risk of sickness and disease in bus drivers: a review and synthesis of epidemiological studies. Int J Epidemiol. 1988;17(2):255-62.
28. Gersh BJ, Sliwa K, Mayosi BM, Yusuf S. Novel therapeutic concepts the epidemic of cardiovascular disease in the developing world: global implications. Eur Heart J. 2010;31(6):642-8.
Cite this article as: Mathew AC, Ramamoorthy V,