Optimization of growth conditions for forage production
in a fresh forage growing system
Do-Gyun Kim1, Gyu-Wan Kim2, Seung-Hyun Lee1, Jong-Tae Park3, Wang-Hee Lee1*
1Department of Biosystems Machinery Engineering, Chungnam National University, Daejeon, 34134, South Korea, 2Boram Engineering Co., Ltd, Hoengseong, Gangwon, 25210, South Korea, 3Department of Food Science and Technology, Chungnam National University, Daejeon, 34134, South Korea
*Corresponding author:
Wang-Hee Lee, Department of Biosystems Machinery Engineering, Chungnam National University, Daejeon, 34134, South Korea. Tel: +82-42-821-6720. Fax: +82-42-823-6246. E-mail: wanghee@cnu.ac.kr
Received: 11 May 2019; Accepted: 29 September 2019
INTRODUCTION
Forage is used as an essential nutrient source for livestock breeding, and a variety of forage crops are cultivated depending on the characteristics of the region and the nutrients to be supplied. Barley is a type of livestock forage cultivated in various regions worldwide, such as the United States, Australia, Asia and Europe, owing to its ease of growth (Badr et al., 2000; Gozukirmizi and Karlik, 2017). Particularly, it is one of the most important crop in Northern and Central Europe because Mediterranean climate is suitable for its growth (Zhang and Li. 2009; EUROSTAT, 2011). In particular, Hordeum vulgare is the most distributed and widely used species for livestock forage (Badr et al., 2000; Bhat and Bansil, 1999; Nikkhah, 2013) owing to its strong tolerance to pests and relatively higher yield compared to other varieties of barley. Regarding its cultivation for use as forage, various environmental factors require consideration, mainly focusing on the yield and quality, as these factors determine the nutritional and growth conditions of livestock, as well as the quality and
cost of the meats produced from the livestock. Generally, a few notable factors can affect the growth and quality of forage, including temperature, humidity, soil condition, amount of sunshine and cultivating method (Antolín et al., 2005; Baker et al., 2012; Gregory et al., 1992). Specifically, the temperature and humidity are sensitive factors that respond to changes in the external environment; however, recent technological advances have provided the ability to control these factors in agricultural facilities, such as plant factories. Consequently, a method for optimizing barley growth has been developed by effectively controlling and managing the environmental conditions (Park et al., 2011).
The importance of the factors that affect the growth and yield of forage crops can be confirmed by several notable previous studies. The relationship between the soil composition and barley cultivation was studied, and this study demonstrated that the exposure to chemical components in the soil, such as NaCl and Na, limited the biomass of barley (Wei et al., 2003). In addition to barley, studies have been performed to increase the yield of oats
The optimization of growth conditions for a fresh forage cultivation system was performed herein to maximize the productivity of hulled barley by using response surface methodology. A central composite design was adopted to design experiments for determining the
effects of two growth conditions: temperature (°C) and humidity (%). A second-order polynomial equation with the significant terms of
temperature and humidity was developed (R-square = 0.937). The model predicted a maximum productivity of 12,568 g of barley at 19.7°C and 62% humidity, and the validation experiment showed that the maximum productivity is consistently demonstrated at the predicted optimal conditions. In addition, ingredients analysis to determine the quality of barley suggested that the total ingredient contents
were not considerably differentiated by different growth conditions. Consequently, this study successfully identified the optimal growth
conditions for maximizing the yield of barley in the fresh forage system.
Keywords: Fresh foraging system; Growth condition; Hulled barley; Optimization; Response surface methodology
A B S T R A C T
http://www.ejfa.me/(Katsura, 1999) and to optimize the yield rate of forage crops (Carr et al., 2004; Gill et al., 2013; Ross and Hughes, 1985). However, most of the previous studies focused on cultivation methods, cultivars, and cultivation durations, and studies have not been conducted pertaining to the optimization of cultivation conditions by controlling the environmental factors, such as temperature and humidity, despite their importance.
An adequate supply of forage is essential for livestock, but in some countries, the supply of feed is limited to only 30−40%, which is lower than the recommended level of 60% (Kim, 2014). In addition, climate change has impact on areas of barley cultivation and its productivity (Rötter et al., 2012). Thus, a method for efficiently producing livestock forage is required in terms of its quality and yield. For this reason, the fresh forage growing system, a type of plant factory, has been developed. The system artificially maintains the optimal environmental conditions and has been used previously to study the oat yield response to controlled changes in temperature, humidity and quantity of light. However, these studies have not examined the optimization of environmental conditions for barley growth, whether the growth occurs outdoors or within the system. In this regard, this study purposed to find out the optimal conditions for maximizing the productivity of barley in the forage growing system. In detail, the optimal conditions that could maximize the amount of barley production were identified by using the response surface methodology (RSM) on empirical data of barely production under different conditions. Then, we were to validate the prediction by performing additional experimentations and to compare the ingredients of barleys cultivated in different conditions for confirm that the ingredient contents of high productivity could maintain the quality.
MATERIALS AND METHODS
System specificationsThe dimensions of the fresh forage cultivation system were 5.3 m × 2.95 m × 2.25 m, and the system was based on a spray-type hydroponic cultivation system (model SJT-300, IPET, Gyeonggi-Do, South Korea). The system consisted of two rooms, a cultivation room and a control room (Fig. 1a). The cultivation room was partitioned by 48 trays, each measuring 960 mm × 800 mm, which were also divided into three sections (Fig. 1b). Each tray contained light-emitting diodes (LEDs) (BPL-9W, Ok-Seong ENG, Dae-gu, South Korea) for photoperiods and a spray nozzle (0.03 liter per hour (ℓh-1)) for the water supply. A chiller/
heater was located at the centre of the main ceiling in the cultivation room, and the temperature and humidity conditions were monitored by a thermo-hygrometer on the wall between the control room and the cultivation
room. The control room contained a control system for maintaining the temperature and humidity, and water tank and pump for supplying water.
Growth of samples
In February 2017, 300 kg of American hulled barley (Hordeum
vulgare var. Hexasticheon(L) Asch) was purchased from Fodder Solutions Korea Co., Ltd (www.fodder.co.kr). From the purchased barley seed, 1,800 g was divided into 600 g for each tray and grown for 6 days (Fig. 1b). The fresh forage cultivation system maintained 10 hours of the daylight using the LED light source. The temperature was controlled using the chiller/ heater within a temperature range of 16°C to 22°C, while the
humidity was adjusted by timing the water sprays, ranging from 20 s to 30 s of spraying time for every 30-min time period. Consequently, the amounts of water for maintaining the humidity values of 50%, 70% and 90% were 1.2 ℓh-1, 1.5 ℓh-1 and 1.8 ℓh-1 per tray, respectively. The weight of each tray
was measured daily throughout the growth period, and the weight of the pure barley was determined by subtracting the weight of the trays from the total weight measurement. Then, the yield (%) was calculated using equation E.01.
Y i e l d ( %) =
(
O u t p u t In p u t÷)
×10 0 ( %)(E.01)
Where, Yield is the production yield rate; Output and Input are the production and initial weights, respectively.
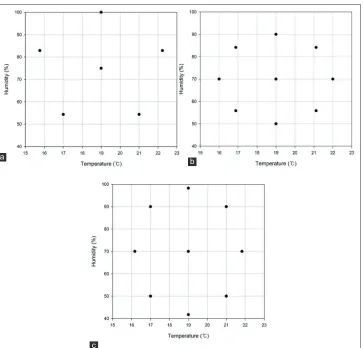
Experimental design for the response surface methodology (RSM)
In this study, the temperature and humidity were selected as the main factors to be controlled for maximizing the production yield. For optimal experimental points, we designed experimental scenarios based on RSM design of which experimental points were coded to a specific number, generally ranging from -1 to 1, and the coded values were adjusted to identify the optimal design of the experiment (Montgomery, 2008). Designed 3 experimental scenarios were consisting of 8–13 trials using a central composite design (CCD), inscribed central composite design, and equiradial design. Considering the number of trials, days of cultivation, precision of environmental control and RSM model accuracy, the CCD scenario was adopted. The CCD scenario was composed of 13 trials, including 4 trials for the factorial points, 4 trials for the axial points and 5 trials for the replication of the central points, with 5 levels of temperature (16.172°C, 17°C, 19°C, 21°C and 21.828°C) and 5 levels of
humidity (41.72%, 50%, 70%, 90% and 98.28%) (Table 1).
Modelling using the RSM
(Aviara and Igbeka, 2016; Montgomery, 2008). The result of the CCD experiment of two variables was formulated using the RSM with a nonlinear equation, consisting of primary, secondary and interaction terms (E.02).
Y X X X X
X X
= + + + + +
10 2 1 1 11 1 2
2
2 22 22 12
(E.02)
Where, Y is the predicted response; X1 and X2 are the independent variables; represents the regression coefficients for the intercept, linear, quadratic and interaction terms, respectively.
The developed model was tested using the lack of fit test, analysis of variance (ANOVA) and canonical analysis to check the adequateness of the model structure, the significance of the individual parameters and the shape of the optimal point, respectively (Fig. 3). All of the analyses were performed using the SAS statistical software package (Version 9.4, SAS Institute Inc., Cary, NC, USA), and the plots were generated by MATLAB (The Mathworks, Inc., Natick, MA, USA).
Ingredient analysis of the barley
The measured ingredients were moisture content, crude protein, crude fat, crude fiber, minerals and amino acids, which were measured by a moisture meter, the Kjeldahl method (FOSS TECATOR Kjeltec Auto 1030 Analyzer), the ether extract, the Henneberg-Stohmann method, an Inductively coupled plasma atomic emission spectroscopy (Perkin Elmer, OPTIMA 7300DV, USA) and a liquid chromatography system (UltiMate 3000RS; UltiMate., USA) with a reversed phase column (Waters ACCQ-TAG ULTRA C18 1.7 um, 2.1 mm by 1000 mm, USA), respectively.
RESULTS AND DISCUSSION
Model development using the RSMTo identify the optimal growth conditions for maximizing the production of hulled barley in the fresh forage cultivation systems based on the 13 experimental trials designed by the CCD, the weight of the hulled barley, which was grown for 6 days after seeding, was measured, and the production yield was calculated (Table 2). Because of the precision of the control system, the overall average temperature was Table 1: Central composite design (CCD) of the independent
variables for the experimental data
Trials Coded variables Natural variables†
X1 X2 Temperature (°c) Humidity (%)
1 -1 -1 17 50 (1.2‡)
2 1 -1 21 50 (1.2)
3 -1 1 17 90 (1.8)
4 1 1 21 90 (1.8)
5 -1.414 0 16.172 70 (1.5) 6 1.414 0 21.828 70 (1.5) 7 0 -1.141 19 41.72 (1.076) 8 0 1.414 19 98.28 (1.924)
9 0 0 19 70 (1.5)
10 0 0 19 70 (1.5)
11 0 0 19 70 (1.5)
12 0 0 19 70 (1.5)
13 0 0 19 70 (1.5)
†Temperature and Humidity of natural variables correspond to X 1 and X2,
respectively. ‡The amount of spray (ℓh-1) required to maintain the target
humidity.
Fig 1. Design scheme and system photo of the fresh forage system: (a) System layout with the names and sizes of parts, (b) Photos of the whole system and cultivating tray.
slightly higher than the designed experimental temperature. Whereas, the humidity was controlled as designed because the humidity is proportional to the amount of spray, which was constant. The results demonstrated a maximum weight of 12,230 g with a production yield of 679% at 20°C and
1.2 ℓh-1 (50% humidity), which was observed from trial 2. In
contrast, the minimum barley weight and production yield were 9,926 g and 551%, respectively, which were observed
in trial 7, with growth conditions of 20°C and 0.6 ℓh-1 (40%
humidity). Trial 5 resulted in a notably low weight and yield, which may have been the consequence of defected barley seeds, and thus, trial 5 was excluded from the analysis.
Additionally, the average weight and yield of trials 9–13, corresponding to the central point (21°C and 1.5 ℓh-1,
70% humidity), were 11,838 g and 657%, respectively. The Fig 3. Procedure for developing the non-linear model using the RSM.
Fig 2. Experimental points for the temperature and humidity based on the response surface designs: (a) Equiradial design-pentagonal, (b) Inner central composite design, (c) Central composite design.
a b
average weight and yield for all of the trials over the 6-day growth period were 10,924 g and 606%, respectively. This is a significantly large amount of production when compared to 770 g of barley production per unit area (1 m2) of forage
cultivated for approximately 100 days in an open field (Park et al., 2011), suggesting that the controlled environment effectively produces the forage in terms of the amount of yield. In addition, considering the availability of space and sustainable production throughout the year, regardless of the climate, it is expected that the fresh forage system is capable of cultivating substantially large amounts of barley that are incomparable to the amounts of cultivation produced in an open field (Kozai, 2013).
Based on the empirical results, the RSM was applied to identify the optimal growth conditions for maximizing the production yield of barley. A non-linear model (second-order polynomial equation) was adapted to account for the interaction and curvature between the two factors: temperature and amount of spray (Montgomery, 2008). In accordance with the first step of RSM-based modelling, we removed the outliers that demonstrated highly variable measurements within the same tray under the same environmental conditions. A criterion was established for outlier selection; outliers were selected by determining which trials had a yield (barley weight) error range that exceeded the initial weight (1,800 g), given the same growth conditions. Consequently, three observations were removed. The final model had an R-squared value of 0.937 (p-value < 0.05), suggesting that the model has high accuracy in predicting the dependent variable (i.e., yield) by the independent variables (i.e., humidity and temperature). In addition, we used the lack of fit test, which demonstrated a p-value larger than 0.05 (p-value=0.206), confirming that the nonlinear structure, including the quadratic terms, was adequate.
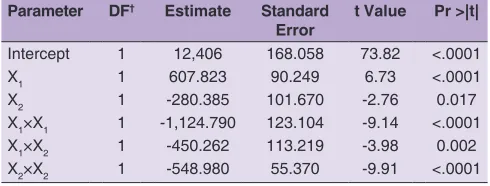
We used ANOVA to estimate the coefficients for each term and their statistical significance (Table 3). The p-values for all of coefficients were smaller than 0.05, indicating that all of the terms were significant and must be included in the model. The estimated coefficients indicate the influence of the variable on the dependent variable. The coefficients for the terms related to the temperature were estimated to be 607.823 and -1124.790 for X1 and X1×X1, respectively. These values were relatively larger than the coefficients for the spray terms (X2 and X2×X2), which indicates that the temperature had a larger influence than the humidity (amount of spray). This model result was consistent with the previous studies that reported the daily temperature and relative humidity as the most important factors for estimating the grain yield and the temperature as the most significant factor for the length of grain filling (Gill et al., 2013; Schelling et al., 2003). In addition, when controlling the closed plant production system, the variations of humidity had less of an impact than the variations of temperature (Kozai, 2013). This finding suggests that the temperature and humidity must be controlled within a specific range, but the temperature requires more precise control than the humidity. Finally, the model was developed in the form of a second-order polynomial equation, including the first-second-order terms, second-order terms and interaction term for the temperature and humidity (E.03).
Y X X
X X X X
= + − −
− −
124 0 6 6 0 7 8 2 28 0 3 9 1124 7 9
4 50 26 54 8 9 8
1 2
12 1 2 22
. . .
. .
(E.03)
Where, X1 is the coded value of the temperature and X2 is the coded value of the spray.
Table 2: Weights and yield of barley in the fresh forage growing system under different conditions
Trials Actual Experimental Variables Response
Temperature (°c) Spray (ℓh-1) Humidity (%) Weight (g)‡ Yield (%)
1 17 (-1)† 1.2 (-1) 50 9,993±594 555
2 20 (0.5) 1.2 (-1) 50 11,240±991 624
3 17 (-1) 1.8 (1) 90 10,247±165 569
4 22 (1.5) 1.8 (1) 90 10,180±1154 566
5§ 19 (0) 1.5 (0) 70 8,828±1141 490
6 22 (1.5) 1.5 (0) 70 10,876±130 604
7 20 (0.5) 0.6 (-3) 40 9,926±909 551
8 20 (0.5) 1.8 (1) 95 11,529±110 641
9¶ 21 (1) 1.5 (0) 70 11,851 658
10 21 (1) 1.5 (0) 70 11,713 651
11 21 (1) 1.5 (0) 70 11,866 659
12 21 (1) 1.5 (0) 70 11,940 663
13 21 (1) 1.5 (0) 70 11,820 657
†The values in parentheses indicate the coded level.
‡Values are the mean±standard deviation from the three sections of a tray.
§Trail 5 was removed from the analysis, as we suspected that the seeds were defected.
Identification of the optimal conditions
The predicted values of the developed model were coded values, so it was necessary to convert the Y-value to obtain the original weight of the barley (g). The response surface plot, which visually presents the change of variables, is shown in Fig. 4. Fig. 4a and 4b are conditional plots showing the changes in weight according to the change in one variable, when the coded value of the other variable was fixed at values of -1, 0, and 1. When the coded value of the spray was fixed, the maximum yield weight in each line was observable in the range between 0 and 0.5 for the coded value of the temperature. Comparing the weight lines, the lines having coded values of -1 and 0 were higher than the line having the coded value of 1, suggesting that a low humidity was adequate with a fixed temperature. This result is in accordance with a previous study, which demonstrated that high levels of relative humidity reduced barley yield (Fazaeli et al., 2012; Hoffman and Jobes, 1978). In the case of a fixed coded value for the temperature, the maximum weight exhibited ranges of 0 to 0.5, -0.5 to 0 and -1 to -0.5 for low, medium and high amounts of spray, respectively. Among them, the highest yield weight line was at the zero-coded value (X2=0), suggesting the adequate humidity required for optimal growth. Collectively, the interval of the yield weight lines with temperature as the fixed variable were more clearly separated than those for the spray fixed variable, which indicates that the temperature had a greater effect on the weight than the spray (Kozai, 2013; Schelling et al., 2003). Fig. 4c shows a comprehensive 3-D plot representing the response surface according to the change in the two variables. The yield weight increased and peaked to 20°C, then decreased, while a spraying value of 1.4 ℓh-1 was
capable of inducing higher production.
To precisely identify the optimal points from the response surface, the coordinates of the stationary point and the shape of the response surface must be analyzed through canonical analysis. For example, if the signs of the eigenvectors of the canonical analysis are all negative, all positive or a positive and negative, the stationary point should be the maximum point, minimum point or saddle point, respectively (Montgomery, 2008). The stationary point of the developed model analysis was 12,568 g at 19.7 °C and 1.38 ℓh-1 and proved to be a
maximum point (Table 4). Therefore, the hulled barley
cultivated in the fresh forage growth system was expected to produce a maximum yield weight of 12,568 g when the growth conditions for the temperature and spray were 19.70°C and 1.38 ℓh-1 (62% humidity), respectively.
Model validation by experimental approach
To validate the model prediction through the RSM, additional experiments were performed. The validation experiments were designed with four trials, consisting of one treatment group and three control groups (Table 5). The treatment group had the optimal growth conditions (20°C and 1.4 ℓh-1).
Control group 1 had a different humidity condition with the same temperature as the treatment group, and control groups 2 and 3 had low and high temperature conditions, respectively, with the same humidity as the treatment group. As a result, the average weight of the barley after 6 days from seedling for the treatment group was 11,094 g, which was the highest among all trials in the validation experiment. This suggested that the optimal condition predicted by the RSM maximized the production of barley, thus validating the model. However, the actual production weight values differed from those of the prediction model. The difference of barley production weight varied from 8% to 21% in the trials, suggesting a model accuracy of approximately 86%. This is potentially because statistical modelling highly depends on empirical data, and the model accuracy is determined by the number of data points (Kim et al., 2016; Lee et al., 2008; Maas and Hox, 2005). For example, the modelling dataset comprised of many data points near the conditions of trial 4, which contributed to a relatively accurate weight and yield prediction by the model for trial 4 in comparison to other trials. This also indicates that as additional growing data is accumulated, an increasingly accurate statistical model can be developed. In conclusion, although there is slight discrepancy between the model predictions and validation experiments, the RSM successfully predicted the optimal growth conditions for maximizing the yield of barley in the fresh forage system; however, additional data should be accumulated for improved application of the model.
Ingredient analysis of the validation experiment In the validation experiment, it was confirmed that the maximum yield of barley was obtained under the optimal conditions. In order to validate the quality of barley cultivated in the system, we compared the main ingredients of the barley produced from the validation experiment. The comparison of the mean quantities of the ingredients in each trial was generated using the one-way ANOVA, followed by Tukey’s test (p-value ≤ 0.05). As a result, there were statistically significant differences between the trials for the following ingredients: crude protein, crude fiber, some minerals (CA, Fe, and K) and amino acids (Table 6). Specifically, trials 1 and 2 were not significantly different for all ingredients, suggesting that the contents Table 3: ANOVA for the response surface quadratic model for
the yield of barley
Parameter DF† Estimate Standard
Error t Value Pr >|t|
Intercept 1 12,406 168.058 73.82 <.0001 X1 1 607.823 90.249 6.73 <.0001 X2 1 -280.385 101.670 -2.76 0.017
X1×X1 1 -1,124.790 123.104 -9.14 <.0001
X1×X2 1 -450.262 113.219 -3.98 0.002 X2×X2 1 -548.980 55.370 -9.91 <.0001
of the ingredients were not affected by changes in the humidity at the temperature of optimal growth conditions. The amounts of crude fiber, Ca and amino acids from trial 3 were significantly different from those of trial 1; however, the amounts of crude protein, Fe and K from trial 3 were not significantly different from those of trial 1. The amounts of crude protein, crude fiber, Ca and amino acids of trial 4 were significantly different from those of trial 1, with the exception of the Fe and K minerals. Specifically, considering the productivity, the content of the amino acids from trial 4 was prominently high, which
suggests that further research focusing on the ingredients is required for developing functional forage that is specific for the purpose of livestock farming. Overall, there were statistically significant differences between the trials for some ingredients, but the overall quality was not significantly changed or disrupted in the maximally produced barley under the optimal conditions. This indicates that the optimal conditions predicted by the model are applicable for producing increased amounts of barley, while maintaining quality, in the fresh forage growing system.
Table 4: Canonical analysis for finding the maximum point of barley growth
Factor Critical values Eigen values Stationary point Predicted value
Coded Original
Temperature (X1,°c) 0.350 19.700 -471.408 Maximum 12,568
Spray (X2,ℓh-1) -0.399 1.380 -1,202.362
Table 5: Validation experiments for verifying the optimal growth conditions
Trials Temperature (°c) Spray (ℓh-1) Weight (g) Yield (%)
Treatment group (optimal condition) 20 1.4 11,094±563 616 Control group 1 (different humidity) 20 1.8 10,101±620 561 Control group 2 (different temperature) 18 1.4 9,757±461 542 Control group 3 (different temperature) 23 1.4 10,233±347 568
Fig 4. Response surface plot of the barley growth conditions to changing temperature and amount of spray: (a) Conditional plot with fixed amount of spray, (b) Conditional plot with fixed temperature, (c) 3-D response surface plot.
a b
CONCLUSIONS
A fresh forage growing system that is capable of controlling the temperature and humidity and providing a constant light source was designed for facilitating and maximizing the production of hulled barley. Because the system requires optimal operating conditions, the production of hulled barley cultivated in the fresh forage growth system was optimized using a CCD and the RSM. The two independent variables considered in the optimization were the temperature (°C) and
amount of water spray (ℓh-1). The optimal conditions for the
temperature and humidity were predicted to be 20°C and
1.4 ℓh-1 (63.33% humidity), respectively, producing 12,568 g
of barley after 6 days from 1,800 g of seedling. The predicted conditions for maximizing the production of barley were validated through additional experimentation, and an ingredient analysis demonstrated that the ingredient quality of the barley was maintained without any significant damage. Therefore, the optimal conditions are applicable for higher production quantities, while maintaining the same quality, for fresh forage production. Implementing this system under the optimal conditions is capable of producing a low-cost, stable supply of forage every 6 days consistently throughout the year. In addition, this study provides additional research pertaining to the use of barley as a fresh-forage, and also presents details regarding the environmental control of the fresh forage growth system.
ACKNOWLEDGEMENT
This work was supported by Korea Institute of Planning and Evaluation for Technology in Food, Agriculture, Forestry and Fisheries (IPET) through Advanced Production Technology Development Program, funded by the Ministry of Agriculture, Food and Rural Affairs (MAFRA) [grant number: 115061021WT011].
Authors’ Contributions
DG Kim took a charge of the experimental design, data analysis, and the writing of the manuscript. KW Kim
carried out the experiment and data acquisition. SH Lee contributed to data analysis. JT Park was in charge of ingredients analysis. WH Lee, the corresponding author designed the research plan, supervised the data analysis, and contributed to the writing of the manuscript.
REFERENCES
Antolín, M. C., I. Pascual, C. García, A. Polo and M. Sánchez-Díaz. 2005. Growth, yield and solute content of barley in soils treated with sewage sludge under semiarid Mediterranean conditions. Field Crops Res. 94: 224-237.
Aviara, N. A. and J. C. Igbeka. 2016. Modeling for drying of thin layer of native cassava starch in tray dryer. J. of Biosyst. Eng. 41: 342-356.
Badr, A., K. Muller, R. Schafer-Pregl, H. El Rabey, S. Effgen, H. H. Ibrahim, C. Pozzi, W. Rohde and F. Salamini. 2000. On the origin and domestication history of barley (Hordeum vulgare). Mol. Biol. Evol. 17: 499-510.
Baker, J. M., T. J. Griffis and T. E. Ochsner. 2012. Coupling landscape water storage and supplemental irrigation to increase productivity and improve environmental stewardship in the US Midwest. Water Resour. Res. 48: 1-12.
Bhat, P. N. and P. C. Bansil. 1999. Grains and roughage production and its utilization in Australasian region review. Asian-Australas. J. Anim. Sci. 12: 481-492.
Carr, P. M., R. D. Horsley and W. W. Poland. 2004. Barley, oat, and cereal-pea mixtures as dryland forages in the northern great plains. Agron. J. 96: 677-684.
EUROSTAT. 2011. Agriculture and Fishery Statistics Main Results 2009-10. Available from: https://www.ec.europa.eu/eurostat/ web/products-pocketbooks/-/KS-FK-11-001. [Last retrieved on 2019 Oct 31].
Fazaeli, H., H. A. Golmohammadi, S. N. Tabatabayee and M. Asghari-Tabrizi. 2012. Productivity and nutritive value of barley green fodder yield in hydroponic system. World Appl. Sci. J. 16: 531-539.
Gill, K. S., A. T. Omokanye, J. P. Pettyjohn and M. Elsen. 2013. Evaluation of forage type barley varieties for forage yield and nutritive value in the Peace region of Alberta. J. Agric. Sci. 5: 24-36.
Gozukirmizi, N. and E. Karlik. 2017. Barley (Hordeum vulgare L.) Improvement Past, Present and Future. Available from: https:// www.intechopen.com/books/brewing-technology/barley-hordeum-vulgare-l-improvement-past-present-and-future. [Last
Table 6: Mean scores and standard deviations of the barley ingredients for the four trials considering different growth conditions
Label (unit) Trial 1 Trial 2 Trial 3 Trial 4
Water (g) 2.03 ±0.01 2.04 ±0.02 2.04 ±0.02 2.04 ±0.02
Water (%) 88.49 ±1.24 89.83 ±1.18 89.91 ±0.31 88.77 ±1.21 Crude protein (%)† 2.07 ±0.10a 2.13 ±0.16a 2.13 ±0.03a 2.43 ±0.14b
Crude fat (%) 0.35 ±0.02 0.36 ±0.03 0.38 ±0.04 0.39 ±0.03
Crude fibre (%)† 1.83 ±0.10a 1.84 ±0.05a 2.23 ±0.06b 2.07 ±0.12b
Mineral-Ca (ppm)† 13.70 ±1.08a 13.39 ±0.87a 16.82 ±0.91b 16.06 ±1.22b
Mineral-Fe (ppm)† 1.10 ±0.16a 1.37 ±0.46ab 1.68 ±0.45b 1.39 ±0.24ab
Mineral-K (ppm)† 120.82 ±8.29a 108.84 ±20.40ab 98.24 ±13.02b 120.80 ±7.95a
Mineral-Na (ppm) 6.28 ±0.91 6.22 ±0.92 6.09 ±0.61 5.75 ±0.35 Mineral-P (ppm) 100.66 ±6.18 89.11 ±12.16 88.57 ±12.12 102.26 ±4.89 Amino (μmole g)† 182.38 ±54.73a 187.63 ±59.58a 219.75 ±26.69a 289.87 ±32.85b
retrieved on 2019 Nov 01].
Gregory, P., D. Tennant and R. Belford. 1992. Root and shoot growth, and water and light use efficiency of barley and wheat crops grown on a shallow duplex soil in a Mediterranean-type environment. Australian J. Agric. Res. 43: 555-573.
Hoffman, G. J. and J. A. Jobes. 1978. Growth and water relations of cereal crops as influenced by salinity and relative humidity. Agron. J. 70: 765-769.
Katsura, M. 1999. Summer-sown cultivation of forage oats and breeding in Japan. Japan Agric. Res. Q. 33: 57-63.
Kim, D. G., B. K. Cho and W. H. Lee. 2016. A novel approach in analyzing agriculture and food systems: Review of modeling and its applications. Korean J. Agric. Sci. 43: 163-175.
Kim, J. D. 2014. Development Evaluation of Forage Quality and Feed Program. Rural Development Administration, Seoul, South Korea.
Kozai, T. 2013. Resource use efficiency of closed plant production system with artificial light: Concept, estimation and application to plant factory. Proc. Japan Acad. Ser. B. 89: 447-461.
Lee, K. S., D. H. Lee, I. K. Jung, S. O. Chung and K. A. Sudduth. 2008. Sampling and calibration requirements for optical reflectance soil property sensors for Korean paddy soils. J. Biosyst. Eng. 33: 260-268.
Maas, C. J. M. and J. J. Hox. 2005. Sufficient sample sizes for
multilevel modeling. Methodology. 1: 86-92.
Montgomery, D. C. 2008. Design and Analysis of Experiments. John Wiley & Sons Inc., New York.
Nikkhah, A. 2013. Barley forages for modern global ruminant agriculture: A review. Russ. Agric. Sci. 39: 206-213.
Ross, C. W. and K. A. Hughes. 1985. Maize/oats forage rotation under 3 cultivation systems, 1978-83: 2. Soil properties. New Zeal. J. Agric. Res. 28: 209-219.
Rötter, R. P., T. Palosuo, K. C. Kersebaum, C. Angulo, M. Bindi, F. Ewert, R. Ferrise, P. Hlavinka, M. Moriondo, C. Nendel, J. E. Olesen, R. H. Patil, F. Ruget, J. Takáč and M. Trnkae. 2012. Simulation of spring barley yield in different climatic zones of Northern and central Europe: A comparison of nine crop models. Field Crops Res. 133: 23-36.
Schelling, K., K. Born, C. Weissteiner and W. Kühbauch. 2003 Relationships between yield and quality parameters of malting barley (Hordeum vulgare L.) and phenological and meteorological data. J. Agron. Crop Sci. 189: 113-122.
Wei, W., P. E. Bilsborrow, P. Hooley, D. A. Fincham, E. Lombi and B. P. Forster. 2003. Salinity induced differences in growth, ion distribution and partitioning in barley between the cultivar Maythorpe and its derived mutant Golden Promise. Plant Soil. 250: 183-191.