https://dx.doi.org/10.22161/ijaems.4.7.5 ISSN: 2454-1311
Optimization of Cutting Rate for EN 1010 Low
Alloy Steel on WEDM Using Response Surface
Methodology
Munish Giri
1, Manjeet Bohat
2, Ravinder Chaudhary
3, Anish Taneja
41Research Scholar, Department of Mechanical Engineering, UIET, KurukshetraUniversity Kurukshetra,India 2Asst. Professor, Department of Mechanical Engineering , UIET, Kurukshetra University Kurukshetra, India 3Asst. Professor, Department of Mechanical Engineering, UIET, Kurukshetra University Kurukshetra, India
4Asst. Professor, Department of Mechanical Engineering, SKIET, Kurukshetra, India
Abstract— EN 1010is a low-carbon steel alloy with 0.10% carbon content. It is k nown for its fairly low strength and low ductility; however, it can be tempered to increase strength. Machinability of EN 1010 carbon steel is measured to be fairly good. EN 1010 is commonly used for cold headed fasteners, rivets and bolts, in addition to structural, construction and automotive applications such as fenders, pans, nails and transmission covers. Wire Electric Discharge Machine (WEDM) seems to be a good option for machining the complicated profiles. This paper, find effects of various process parameters of Wire EDM such as pulse on time (Ton), pulse off time(Toff), peak current (Ip) and servo voltage (Sv) for analysis of cutting rate (CR) while machining EN 1010. Central Composite Design is used to plan the design of experiment. The output response variable being cutting rate will be measured for all number of experiments conducted. The optimal parameter level combination would be analysed which gives desired cutting rate. These optimized values of different parameters would then be used in execution the machining operation in order to obtain the necessary outputs.
Keywords—CCD,Cutting Rate, EN 1010, Process Parameters, RSM,Wire EDM.
I. INTRODUCTION
The main objective of this paper is to study different parameters like(Ton,Toff,Sv,Wf) of WEDM operations
usingresponse surface methodology, in particular central composite design (CCD), to develop empirical relationshipsbetween different process parameters and output respons e namely CR. The mathematical models so developedareanalysed and optimised to yield values of process parameters producing optimal values of output response.
II. LITERATURE REVIEW
Puri A.B. and B. Bhattacharyya [1] (2001) study was considered all the control parameters for the machining
operation which comprised the rough cut followed by the trim cut. The objective of the study has been carried out experimental investigation based on Taguchi method involving thirteen control factors with three levels for orthogonal array L27. The main factors are finding for
given machine were average cutting speed, surface finish and geometrical inaccuracy were caused due to wire lag and also considered the optimum parametric settings for different machining situations have been fou nd and selected the most appropriate cutting parameter combination for Wire Electrical Discharge Machining process to get the required surface roughness value of machined work pieces.
Hewidy M.S et al. [2] (2005) study the development of the mathematical models for relating the relationships of the various Wire EDM machining parameters of Inconel 601 material i.e. Peak Current, Water Pressure and Wire Tension on the Wear Ratio, Material Removal Rate and Surface Roughness. This work was used as Response Surface Methodology. Wire EDM process has shown its competence to machineInconel601 material under the acceptable condition of volumetric material Removal Rate which reached to 8mm3/min and Surface Finish less than
1µm.
https://dx.doi.org/10.22161/ijaems.4.7.5 ISSN: 2454-1311
controlling optimization process to produce more reliable solution.
Andromeda T. A et al. [4](2011)studied to finding the Material Removal Rate in the Electrical Discharge Machining using the Artificial Neural Network technique. The result of 18 experimental runs to find out the cutting velocity and surface finish collected from the Die Sinking EDM process for the copperelectrode and the steel work piece. It was targeted to develop a behavioural model making use of input-output pattern of the raw data from the EDM process experiment. The use was made of behavioural model to predict the MRR and then the predicted value of MRR was compared to the actual value of MRR. The results showed a good harmony of predicting the MRR between them.
Jaganjeet Singh and Sanjeev Sharma [5] (2013)investigate the effects of various WEDM process parameters on the machining quality and to optimize the response variables of WEDM. The work related to effects of various process parameters of WEDM like Ton, Toff,
Servo voltage (Sv), Ip, Wire feed (Wf) and Wire tension
(Wt) have been investigated to demonstrate the influence
on material removal rate of P20 Tool Steel by using Elektra Sprint cut 736 WEDM machine. Where the surface roughness was measured by Mar Surf PS5 roughness measuring instrument. The experiments were used by Taguchi methodology (L18) Orthogonal Array and results of the experimentation were analysed by MINITAB software.
H.V.Ravindra et al. [6] (2014) study outlines the development of model to optimize the WEDM machining
parameters using the Taguchi’s technique which was based on the robust design. Experimentation was
performed as per Taguchi’s L16 orthogonal array. Each experiment has been performed under different cutting conditions of pulse-on, pulse-off, current, and bed speed. Molybdenum wire having diameter of 0.18 mm was used as an electrode. Three responses have been considered for each experiment namely accuracy, surface roughness, volumetric material removal rate. Based on this analysis,
process parameters were optimized. ANOVA was performed to determine the relative magnitude ofeach factor and responses was done using artificial neural network.
F. Klocke et al. [7] (2016) paper study the effect of different annealing and heat treatment processes of 42CrMo4 (AISI 4140) on the S-EDM process. Hence, changes of state variables depending on different machining parameters and were considered. Therefore, the resulting microstructures were analyzed by scanning electron microscope (SEM). Additionally, residual stress was determined and compared to the initial state. The identified changes of investigated state variables were the described modifications.
Amit. R Choudhary and P Shende [8] (2017) objective of this research was to investigate and predict the impact of the electrical parameters: peak current (I), pulse duration (Ton) and pulse off (Toff) on the surface roughness (SR), Cutting time (CT). Adaptive Neuro -Fuzzy Inference System (ANFIS) as one of the active methods and also a set of new data was obtained with different levels. The results indicate that even with the complexity of the EDM process, the Adaptive Neuro -Fuzzy Inference System (ANFIS) was found to be adequate in forecasting res ponse variable with high accuracy
III. EXPERIMENT METHODOLOGY 3.1 Machine tool
https://dx.doi.org/10.22161/ijaems.4.7.5 ISSN: 2454-1311
Fig.3.1: Electronica Sprintcut 734 CNC wire cut machine and its parts
3.2 Material
EN 1010 is a low-carbon steel alloy with 0.10% carbon content. It is known for its fairly low strength and low ductility; however, it can be quenched to increase strength. Machineability of EN 1010 carbon steel is
measured to be equally good. EN 1010 is commonly used for cold headed fasteners, rivets and bolts, in addition to structural, construction and automotive applications such as fenders, pans, nails and transmission covers . Table 3.1 gives the chemical composition of the work material.
Table.3.1: Chemical composition of EN 1010
The work material used is in rectangular form of dimensions as given below. Figure 3.2 shows the workpiece material used for experiment purpose.
Length = 200mm, Breadth = 100mm, Height = 10mm
Fig.3.2: EN 1010 work piece material
Element C Si Mn P S
https://dx.doi.org/10.22161/ijaems.4.7.5 ISSN: 2454-1311
3.2 RSM and Design of Experiment
Response surface methodology is a collection of the statistical and mathematical methods which are useful for the modelling and optimization of engineering science problems. Response surface methodology discovers the
relationships between controllable input parameters and obtained Outputs. There are in total 21 experiments carried out according to design of experiments. The average values of CR (mm/min) are shown in Table 3.2.
Table.3.2: Design of Experiment and CR
Run Ton Toff Ip Sv CR
1 130 50 80 10 3.68
2 120 30 155 30 3.63
3 110 40 80 10 2.64
4 130 50 230 10 4.99
5 120 40 155 30 3.69
6 120 50 155 30 3.40
7 120 40 230 30 3.67
8 130 30 80 50 4.63
9 120 40 90 30 2.65
10 130 40 155 30 4.26
11 110 30 80 50 2.16
12 120 30 155 50 3.60
13 120 40 155 30 3.65
14 110 40 155 30 2.86
15 120 40 155 10 3.60
16 120 40 155 30 3.85
17 120 40 155 30 3.84
18 110 40 230 10 2.90
19 110 50 230 50 2.86
20 130 30 230 50 3.64
21 120 40 155 30 3.86
IV. RESULT AND DISCUSSIONS 4.1 Analysis of Cutting rate
According to fit summary obtained from analysis, it is found that the quadratic model is statistically significant for CR. The results of quadratic model for CR in the form of ANOVA are presented in Table 4.1.If F value is more corresponding, p value must be less and corresponding resulting in a more significant coefficient. Non-significant terms are removed by the backward elimination for fitting of CR in the model. Alpha out value is taken as 0.05 (i.e.,95 % confidence level). It is found from the Table 4.1 that F value of model is 27.05 and related p value is<0.0001 results in a significant model. The lack of fit is a measure of failure of model to represent data in experimental field at which the points are not included in regression differences in model that cannot be accounted for by the random error. If there is the significant lack off it, as indicated by the low probability value, response predictor is discarded. Lack of fit is non-significant and its value is 5.80.From Table 4.1 it is found that R² of
model is 0.970641, which is very close to 1. It means that97.06 % variation can be explained by the model and only0.02% of the total variation cannot be explained, which is the indication of good accuracy. The predicted R² is in the logical concurrence with adjusted R2 of
0.238569. Figure4.1 shows normal probability plot of residuals for CR. Most of residuals are found around straight line, which means that the errors are normally distributed. Adequate precision compares significant factors to non-significant factors, i.e., signal to noise ratio. According to results obtained from software, ratio greater than 4 is desirable. In this, adequate precision is 22.943. So, signal to noise ratio is significant. By applying multiple regression analysis on experimental data, empirical relation in terms of actual factors obtained as follows, equation 4.1
CR=
-4.27428+0.09818*Ton-0.1317*Toff+0.00868*Ip+0.02138*Sv - 0.000254033
https://dx.doi.org/10.22161/ijaems.4.7.5 ISSN: 2454-1311
0.0014*Sv2 -0.00005Ton*Ip + 0.00134 Ton *Sv+0.00171*Toff*Ip -
0.0049*Toff*Sv+0.00046Ip*Sv;(4.1)
Table.4.1: ANOVA of Response Surface for cutting rate
Pooled ANOVA for Response Surface Reduced Quadratic Model Analysis of variance table [Partial sum of squares]
Source Sum of Squares
DF Mean Square
F Value
P-value Prob> F
Model 8.805163 11 0.800469 27.04977 < 0.0001 Significant
A-Ton 1.532993 1 1.532993 51.80349 < 0.0001
B-Toff 0.041116 1 0.041116 1.389393 0.2687
C-Ip 1.033738 1 1.033738 34.93246 0.0002
D-Sv 0.666173 1 0.666173 22.51156 0.0011
AC 0.450635 1 0.450635 15.22804 0.0036
AD 0.281203 1 0.281203 9.502527 0.0131
BC 1.192385 1 1.192385 40.29354 0.0001
BD 0.483252 1 0.483252 16.33023 0.0029
CD 0.465452 1 0.465452 15.72873 0.0033
A2 0.105407 1 0.105407 26.34125 0.0009
B2 0.423345 1 0.423345 16.8713 < 0.0001
C2 0.619743 1 0.619743 20.94259 0.0013
D2 0.300854 1 0.300854 10.16659 0.0110
Residual 0.266332 9 0.029592
Lack of Fit 0.234052 5 0.04681 5.80055 0.0567 Not significant
Pure Error 0.03228 4 0.00807
Cor Total 9.071495 20
Std. Dev. 0.172025 R-Squared 0.970641
Mean 3.529524 Adj R-Squared 0.934757
C.V. % 4.873876 Pred R-Squared 0.238569
PRESS 6.907321 Adeq Precision 22.94323
Fig.4.1: Normal plot of residual for cutting rate Internally Studentized Res iduals
N
orm
al
%
Pro
ba
bi
lit
y
Normal Plot of Residuals
-1.77 -0.88 0.00 0.88 1.77 1
https://dx.doi.org/10.22161/ijaems.4.7.5 ISSN: 2454-1311
4.2 Effect of Process parameters on Cutting rate
The combined effect of two Process Parameters on Output variables is called interaction effect. For interaction plot, two parameters vary keeping the other two process parameters constant at their central value and observe effect on Output characteristics. This plot is called three-dimensional surface plot. So, the significant interactions are shown in figures 4.2-4.7.
The interaction effect of pulse on time (Ton) and pulse off time (Toff) on cutting rate (CR) is shown graphically in figure 4.2. According to this, cutting rate (CR) attains a peak value of 4.5 mm/min; when Ton is increased from
110 to 130µswith Toff remain unchanged at 30µs. This is because at high value of Ton and corresponding lower value of Toff result in longer duration of spark occur which leads to higher discharge energy subjected on work piece causing faster and greater erosion of material. It also shows that CR attains a minimum value of 2.8 mm/min; when Toff is increased from 30 to 50µs with Ton remain unchanged at 110µs. This is due to the fact that lower value of Ton with a higher value of Toff results in a smaller duration of spark to occur that leads to less amount of release of spark energy causing slower erosio n of material.
Fig.4.2: Interaction effect of Ton and Toff on cutting rate (CR)
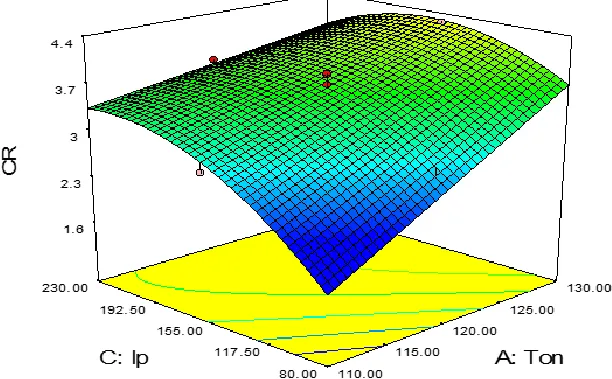
Figure 4.3 shows the interaction effects of pulse on time (Ton) and peak current (Ip) on cutting rate (CR). The cutting rate is increased from 1.3 to 3.65 mm/min when peak current is increased from 80A to 230A with pulse on time remain unchanged at 110 µs.
Fig.4.3: Interaction effect of Ton and Ip on cutting rate (CR)
On the other hand, on increasing the pulse on time value from 110 to 130µs the cutting rate increased from 1.3 to 3.65 mm/min with peak current remain unchanged 80A .
https://dx.doi.org/10.22161/ijaems.4.7.5 ISSN: 2454-1311
in peak current leads to the increase of the cutting rate. This can be explained by the fact that at higher peak current the pulse energy increases resulting in higher melting and evaporation of the work piece. By increasing the peak current value, the temperature around the spark increases which leads to fast melting of the material at a high rate that increases the cutting rate of the process.
Interaction effect of pulse off time (Toff) and peak current (Ip) on cutting rate (CR) is shown in figure 4.4. When pulse off time is varied from 30 to 50µs, with a constant peak current of 80 A, the cutting rate decreased from 2.58 to 1.2 mm/min.
Fig.4.4: Interaction effect of Toff and Ip on cutting rate (CR)
It is due to the fact that on increasing the time gap between the two consecutive sparks the process of erosion of material becomes slow. By increasing the peak current from 80 to 230 A, the cutting rate increased from 2.58 to 4.5 mm/min as on increasing the peak current the pulse energy increases resulting in higher melting and erosion of work piece material.
The interaction effect of pulse off time (Toff) and servo voltage (Sv) (figure 4.5) depicts that a larger cutting
rateof 4.5 mm/min is obtained at lower values of Toff (30µs) and Sv (10V) owing to the reasons mentioned earlier. On increasing the values of pulse off time from 30 to 50µs and servo voltage from 10 to 50V the cutting rate decreased to 1.4 mm/min. Sv is the reference voltage in the gap. Higher is the Sv, larger the gap between wire and work piece. It takes a large time for discharge to build up and hence cutting rate need to be reduced by the control system.
https://dx.doi.org/10.22161/ijaems.4.7.5 ISSN: 2454-1311
The interaction effect of pulse off time (Ton) and servo voltage (Sv) (figure 4.6) depicts that a larger cutting rateof 4.3 mm/min is obtained at maximum values of Ton (130µs) On increasing the values of pulse on time from 110 to 130 µs so the cutting rate is increased up to 4.3 mm/min. This is because at high value of Ton result in longer duration of spark occur which leads to higher discharge energy subjected on work piece causing faster
and greater erosion of material. It also shows that CR attains a minimum value of 1.5 mm/min;when Sv is increased from 10to 50V. Sv is the reference voltage in the gap. Higher is the Sv, larger the gap between wire and work piece. It takes a large time for discharge to build up and hence cutting rate need to be reduced by the control system.
Fig.4.6: Interaction effect of Ton and Sv on cutting rate (CR)
Interaction effect of and peak current (Ip) and Servo Voltage (Sv) on cutting rate (CR) is shown in figure 4.7. When Peak current is varied from 80 to 230A. so the cutting rate is increased from 1.3 to 3.8 mm/min. On increasing the peak current, the pulse energy increases resulting in higher melting and erosion of work piece
material and the Servo voltage is increased from 10 to 50 v with cutting rate is decreased from 3.8 to 1.3 mm/min. It is due to the fact that on increasing the time gap between the two consecutive sparks the process of erosion of material becomes slow.
https://dx.doi.org/10.22161/ijaems.4.7.5 ISSN: 2454-1311
V. CONCLUSION
In this paper the effect of Process Parameters on Cutting Rate is optimized, it is concluded that:
1. Main effect of pulse on time, pulse off time, peak current and servo voltage and interaction effect of pulse on time and pulse off time, pulse on time and peak current, pulse off time and peak current, pulse on time and servo voltage,pulse off time and servo voltage, peak current and servo voltage and second order of pulse on time, pulse off time, peak current and servo voltage found to be important from the ANOVA of cutting rate.
2. It was found experimentally and by successive analysis that on increasing the pulse on time and peak current, the cutting rate increases, whereas increasing the pulse off time and servo voltage decreases the cutting rate. The higher discharge energy associated with the increase of pulse on time leads to a more controlling explosion and thus increases cutting rate.
3. For Output parameter, the predicted values of the response are in close agreement with experimental results.
REFERENCES
[1] Puri, A.B; and Bhattacharyya,B; 2001, “An analysis and optimisation of the geometrical inaccuracy due to wire lag phenomenon in WEDM,”International Journal of Machine Tools & Manufacture 43 , pp.151-159
[2] Hewidy, M.S., El-Taweel, T.A. and El-Safty, M.F.,
2005, “Modelling the machining parameters of wire
electrical discharge machining of Inconel 601 using
RSM”, Journal of Materials Processing Technology, pp. 328-336
[3] Yuan, Jin; Wang, Kesheng; Yua, Tao and Fanga, Minglun;2007, “Reliable multi-objective optimization of high-speed WEDM process based on Gaussian process regression”, International Journal of Machine Tools & Manufacture 48, pp.47-60.
[4] Andromeda, T., Yahya, A., Hisham, N., Khalil, K. and
Erawan, A., 2011, “Predicting Material Removal Rate
of Electrical Discharge Machining (EDM) using
Artificial Neural Network for High gap current”,
IEEE, pp. 259-262.
[5] Singh, Jaganjeet and Sharma, Sanjeev;2013, “Effects of Process Parameters on Material Removal Rate and Surface Roughness in WEDM of P20 Tool Steel”, International Journal of Multidisciplinary and Current Research.
[6] Ugrasena, G; Ravindra; Naveen Prakash, G.V and Keshavamurthy, R; 2014, “Process optimization and estimation of machining performances using artificial
neural network in wire EDM”, International Journal of Material Science, pp. 1645-1648.
[7] Klocke, F; Schneider, S; Ehle, L; Hensgen, L and
Klink, A; 2016, “Investigation on Surface Integrity of Heat Treated 42CrMo4 (AISI 4140) Processed by
Sinking EDM”, International Journal of Elsevier Engineering Research, pp 580-585.
[8] R Choudhary, Amit and Shende, P; 2017, “To
Improve Process Parameters of Wire EDM”,