Online Analytical Processing on Hadoop using Apache
Kylin
Supriya Vitthal Ranawade
Bachelor of Engineering (I.T.) P.E.S Modern College of
Engineering Department of I.T.
Shivani Navale
Bachelor of Engineering (I.T.) P.E.S Modern College of
Engineering Department of I.T.
Akshay Dhamal
Bachelor of Engineering (I.T.) P.E.S Modern College of
Engineering Department of I.T.
Kuldeep Deshpande
Founder and CEO Ellicium Solutions
Chandrashekhar Ghuge
Assistant Professor
P.E.S Modern College of Engineering Department of I.T.
ABSTRACT
In the Big Data age, it is necessary to remodel the traditional data warehousing and Online Analytical Processing (OLAP) system. Many challenges are posed to the traditional platforms due to the ever increasing data. In this paper, we have proposed a system which overcomes the challenges and is also beneficial to the business organizations. The proposed system mainly focuses on OLAP on Hadoop platform using Apache Kylin. Kylin is an OLAP engine which builds OLAP cubes from the data present in hive and stores the cubes in HBase for further analysis. The cubes stored in HBase are analyzed by firing SQL-like analytics queries. Also, reports and dashboards are further generated on the underlying cubes that provides powerful insights of the company data. This helps the business users to take decisions that are profitable to the organization. The proposed system is a boon to small as well as large scale business organizations. The aim of the paper is to present a system which builds OLAP cubes on Hadoop and generate insightful reports for business users.
Keywords
Analytics, OLAP, Hadoop, Kylin, Hive, Datawarehouse
1.
INTRODUCTION
1.1
Background
Complexity and volume of the data in world is exploding. Data is being collected and stored at unprecedented rates. [3] Because of the huge data volumes, many companies do not keep their big data, and thus do not realize any value out of this [3]. Big Companies that want to truly benefit from big data must also integrate these new types of information with traditional corporate data, and fit the insight they glean into their existing business processes and operations [3].This is posing various challenges to the traditional platforms. Due to the intrinsic nature of Big Data application scenarios ,it is natural to adopt Data Warehousing and OLAP methodologies with the goal of collecting, extracting, transforming, loading, warehousing and OLAPing such kinds of datasets, by adding significant add-ons supporting analytics over Big Data [13]. Almost every day, we see another article on the role that big data plays in improving profitability, increasing productivity, solving difficult scientific questions, as well as many other areas where big data is solving problems and helping us make better decisions [5].
There has been a lot of research on how Hadoop is used as an alternative for data warehousing (e.g. 1, 4, 7, 9, and 11). Only storing the data in the datawarehouse is not profitable to the business until, the underlying data is analysed to gain business insights. Online Analytical Processing (OLAP) is an approach to answer multidimensional analytical queries swiftly, and provides support for decision-making and intuitive result views for queries [8].However, the traditional OLAP implementation, namely the ROLAP system based on RDBMS, appears to be inadequate in face of big data environment [8]. New massively parallel data architectures and analytic tools go beyond traditional parallel SQL datawarehouses and OLAP engines [8]. Therefore, some databases such as SQL Server and MySQL are able to provide OLAP-like operations, but the performance cannot be satisfactory [14]. There is a need to design a system for solving the problems of computing OLAP data cubes over Big Data.
This is the main motivation behind designing an efficient system which can be beneficial to many. In this paper, we have proposed a system which overcomes some critical problems faced by traditional data warehousing and OLAP. The proposed system is advantageous to businesses is many scenarios, to help them take smart and profitable decision for their organization.
1.2
Related Work
OLAP was introduced in the work done by [14]. Considering the past two decades have seen explosive growth, both the number of products and services offered and in the adoption of these technologies in industry, their other work [14] gave the introductions of OLAP and data warehouse technologies based on the new challenges of massively parallel data architecture [8].
Paper [15] presented OLAP approach based on MapReduce parallel framework. First, a file type was designed, which was based on SMS (Short Message Service) data structure.
Paper [8] presents the design, implementation, and evaluation of HaoLap, an OLAP system for big data. HaoLap is built on Hadoop and based on the proposed models and algorithm: (1) specific multidimensional model to map the dimensions and the measures; (2) the dimension coding and traverse algorithm to achieve the roll up operation on hierarchy of dimension values; (3) the chunk model and partition strategy to shard the cube; (4) the linearization and reverse linearization algorithm to store chunks and cells; (5) the chunk selection algorithm to optimize OLAP performance; and (6) the MapReduce based OLAP and data loading algorithm.[8] They compared HaoLap performance with Hive, HadoopDB, HBaseLattice, and Olap4Cloud on several big datasets and OLAP applications.[8]
1.3
Overview
This paper is organised as follows. In section 2, the limitations of the existing data warehouse and OLAP platforms are mentioned. The next section i.e. section 3 consists of the features, system architecture and the implementation of the proposed system. Advantages of the proposed system and limitations of the DW and OLAP on Hadoop platform are mentioned in section 4 and 5 respectively.
2.
LIMITATIONS OF EXISTING DW
AND OLAP PLATFORMS
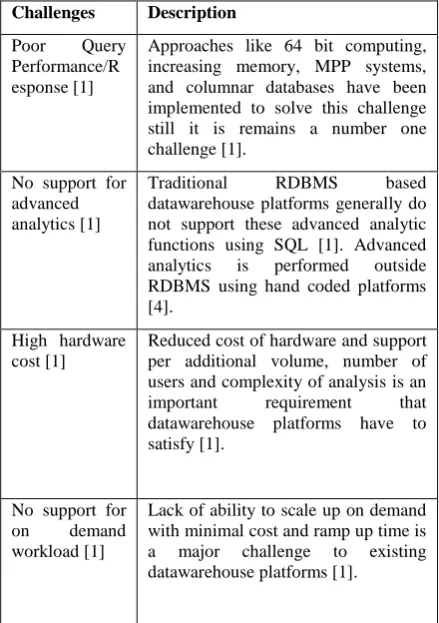
Some challenges related to the traditional datawarehouse platforms mentioned in [1] are as follows:
Table 1: Challenges related to traditional DW platforms Challenges Description
Poor Query Performance/R esponse [1]
Approaches like 64 bit computing, increasing memory, MPP systems, and columnar databases have been implemented to solve this challenge still it is remains a number one challenge [1].
No support for advanced analytics [1]
Traditional RDBMS based datawarehouse platforms generally do not support these advanced analytic functions using SQL [1]. Advanced analytics is performed outside RDBMS using hand coded platforms [4].
High hardware cost [1]
Reduced cost of hardware and support per additional volume, number of users and complexity of analysis is an important requirement that datawarehouse platforms have to satisfy [1].
No support for on demand workload [1]
Lack of ability to scale up on demand with minimal cost and ramp up time is a major challenge to existing datawarehouse platforms [1].
These challenges are overcome by using Hadoop as a DW platform and for the data’s further processing. Also, Traditional OLAP solutions are not capable to deal with
computing OLAP data cubes over Big Data, mainly due to two intrinsic factors of Big Data repositories [13]:
1. Size, which becomes really explosive in such data sets; [13]
2. Complexity (of multidimensional data models), which can be very high in such data sets (e.g., cardinality mappings, irregular hierarchies, dimensional attributes etc.).[13]
Some of the critical problems discussed in paper [13] that arise when computing OLAP cube are as follows:
3. Size: fact tables can easily become huge when computed over Big Data sets – this adds severe computational issues as the size can become a real bottleneck from practical applications [13].
4. Complexity: Building OLAP data cubes over Big Data also implies complexity problems which do not arise in traditional OLAP settings (e.g., in relational environments) – for instance, the number of dimensions can really become explosive, due to the strongly unstructured nature of Big Data sets, as well as there could be multiple (and heterogeneous) measures for such data cubes [13].
5. Design: Designers must move the attention on the following critical questions:[13]
a. What is the overall building time of the data cube to be designed (computing aggregations over Big Data may become prohibitive)?
b. How the data cube should be updated?
c. Which maintenance plan should be selected?
d. Which building strategy should be adopted?
6. End-user performance: OLAP data cubes computed over Big Data tend to be huge, hence end-user performance easily becomes poor on such cubes, especially during the aggregation and query phases – therefore, it follows that end-user performance must be included as a critical factor within the design process of OLAP data cubes over Big Data.[13]
7. Analytics: There exist several problems to be investigated, running from how to design an analytical process over OLAP data cubes computed on top of Big Data to how to optimize the execution of so-obtained analytical processes, and from the seamless integration of OLAP (Big) data cubes with other kinds of unstructured information (within the scope of analytics).[13]
The above mentioned problems that arise when computing OLAP cubes traditionally, could possibly be overcome by using Kylin as an OLAP solution on Hadoop platform.
3.
PROPOSED SYSTEM
3.1
Features
Handles huge amount of complex data with simplicity-Hadoop is known to handle a variety of data with simplicity.
Provides random, real-time access to its data - OLAP cubes are stored in HBase, which supports real time analytics.
Supports horizontal scalability
Fault-tolerant
Can be integrated with reporting and data visualization tools to obtain powerful insights from the underlying data.
3.2
System Architecture
The following figure depicts the architecture of the proposed system:
Figure 1: System Architecture
First Tier: The first tier consists of the data warehouse which resides in the SQL Server. As per the requirements, the ETL (Extract, Transform and Load) process can be performed on the traditional platforms i.e. on RDBMS or on Hadoop platform using Hive as mentioned in [2]. Companies storing their data warehouse on traditional platforms, can migrate the data warehouse to the Hadoop platform using Apache Sqoop. Apache Sqoop allows users to import data from structured data sources into Hadoop for further processing.
Second Tier: The important components of the second tier are Hive, Kylin and HBase. The data imported from the first tier is stored in Apache Hive. The Hive is an open source data warehousing solution built on top of Hadoop [12]. The Metastore stores all the information about the tables, their partitions, the schemas, the columns and their types [12]. This information is further required by Apache Kylin.
Apache Kylin is an open source Distributed Analytics Engine designed to provide SQL interface and multi-dimensional analysis (OLAP) on Hadoop supporting extremely large datasets, original contributed from eBay Inc. [16]. Apache Kylin lets you query massive data set at sub-second latency in 3 steps [16].
1. Identify a Star Schema on Hadoop.
2. Build Cube from the identified tables.
3. Query with ANSI-SQL and get results in sub-second, via ODBC, JDBC or RESTful API.
Kylin Ecosystem consists of the following elements mentioned in [16]:
Kylin Core
Extensions
Integration
User Interface
Drivers (ODBC and JDBC)
Apache Kylin User interface consists of many useful facilities that makes or cube build process much easier. The UI consists of the following fields:
Table 2: Fields present in UI of kylin
Fields Description
Table It is definition of hive tables as source of cubes, which must be synced before building cubes [16].
Data Model It describes a STAR SCHEMA data model, which defines fact/lookup tables and filter condition [16].
Cube Descriptor
It describes definition and settings for a cube instance, defining which data model to use, what dimensions and measures to have, how to partition to segments and how to handle auto-merge etc. [16].
Cube Segment
It is actual carrier of cube data, and maps to an Htable in HBase. One building job creates one new segment for the cube instance [16].
Aggregation Group
It is a subset of dimensions, and builds cuboid with combinations inside .It aims at pruning for optimization [16].
Dimensions and Measures can be described as follows:
1. Mandatary –If a dimension is specified as “mandatory”, then those combinations without such dimension are pruned [16].
2. Hierarchy –If dimension A, B, C forms a “hierarchy” relation, then only combinations with A, AB or ABC shall be remained [16].
3. Derived – On lookup tables, some dimensions could be generated from its PK, so there’s specific mapping between them and FK from fact table [16].
4. Count Distinct (Precise) – Precise COUNT DISTINCT measure will be pre-calculated basing on Roaring Bitmap, currently only int or bigint are supported [16].
5. Top N – For example, with this measure type, user can easily get specified numbers of top sellers/buyers etc. [16].
Other measures like min, max, average etc. can also be described along with the above mentioned. Cube actions such as BUILD, REFRESH, MERGE and PURGE can be performed on the cube after describing it.
makes cube building process a cake walk as a programmer as well as a non-programmer can build a cubes effortlessly. Kylin stores the OLAP cubes in HBase. HBase is a distributed column-oriented database built on top of HDFS. Storing the OLAP cubes in HBase is quite beneficial in real-time analytics.
Third Tier: The Third Tier consists of the reporting or data visualization tools. QlikView, Tableau, PowerBI or Excel can be seamlessly integrated with Kylin. Apache Kylin, from the second tier of the architecture can be connected to the reporting or data visualization tools by using ODBC or JDBC drivers. Further, creative visualizations, reports and dashboards can be created to obtain powerful insights from the underlying data. The reports will help the business users to make important and crucial decisions.
3.3
Implementation
For experimental purpose, the hardware and software requirements are as mentioned below. Some of the below mentioned can be altered according to requirements.
Hardware
1. Processor- Intel core i5 or i7
2. RAM- Minimum 8GB
Software
1. Microsoft SQL Server 2016
2. Hortonworks Sandbox 2.4 (Hive is pre-installed along with other useful components of Hadoop).
3. Apache Kylin (downloaded from the official site [16] and installed manually on Hortonworks Sandbox).
The following steps are followed to implement the proposed system for analytics:
In the first subtask, migration of the data warehouse from the SQL server 2014 to Hadoop platform takes place. The AdventureWorks 2012 data warehouse is used for experimental purpose. It contains data about the sales records of the hypothetical bicycle company. The Fact tables in the DW consists of approximately 60,000 rows each. For migrating the DW, it is required to connect Hadoop and SQL Server with the help of Sqoop agent. Sqoop uses a jdbc driver to connect the two. After establishing a connection between SQL Server and Hadoop, insert queries are executed to insert the DW tables from SQL Server into Hive. On successful execution of all the insert queries, the DW is now available in Hive Warehouse for further processing.
In the second subtask, OLAP cubes are created from the DW which is available in Hive environment. Apache Kylin, installed on top of Hadoop, is used to create OLAP cubes. In Kylin, firstly, you create a new project, in which you will load all the necessary DW tables’ Metadata from Hive Metastore. Kylin then calculates the cardinalities of each column in the table. Then, a data model is defined before creating a cube. In the model creation phase, the fact tables, lookup tables, new join conditions, etc. are selected according to the requirements. On successful creation of the data model, the second phase is to create a cube based on the data model. While creating the cubes, dimensions, measures, aggregation groups, etc. are selected as per the requirements. In each aggregation group, it is optional to select the mandatory, joint and hierarchical dimensions. The cube is now defined and
ready to be built. After a cube BUILD action is selected, Kylin starts working internally by first querying the Hive tables, retrieving results from those tables and storing the results in the form of Htable into HBase. This process may take time depending on the size of data as well as the aggregation groups. The SQL like business queries are fired once the cube is ready, in order to get appropriate results. Results are also viewed in the form of bar charts, pie charts etc. in Kylin.
In the final subtask, reports are generated in QlikView. Reports are generated on the basis of the OLAP cubes generated by Kylin. Initially, a connection will be established between QlikView and Kylin using ODBC driver. On successful connection, the required data is loaded and then reports are generated in form of bar charts, pie charts, dashboards etc. according to the requirements.
4.
ADVANTAGES OF THE PROPOSED
SYSTEM
Following are the advantages of the Proposed System:
1. Low Query Latency: Kylin reduces the query latency on Hadoop for 10+ billions of rows of data [16].
2. ANSI SQL interface: Kylin allows you to query the underlying data using SQL like queries supporting most of the SQL query functions [16].
3. Cubes can be optimized by selecting the appropriate :
i. Joint Dimensions
ii. Mandatory Dimensions
iii. Hierarchical Dimensions
4. Comparison with other tools on Hadoop: The latency time is comparatively very less on Kylin than Hive.
For example, consider the following Query:
select OrderDate, CustomerKey, sum(salesamount) as
total_sales, sum(taxamt) as total_taxes from
FactInternetSales group by OrderDate,CustomerKey order by OrderDate,CustomerKey ;
Table 3: Comparison of Query response time using different tools
Tools Results
Kylin (approx. 60,000 rows)
0.36s approx.
Hive (approx. 60,000 rows)
18.27s approx.
According to the results mentioned in Table 3, it is clear that Kylin processes analytics queries faster than Hive.
1. If the aggregation groups are selected appropriately, then the cube is built in comparatively less time than the time taken by traditional platforms.
2. Query result is cached to provide a faster response when the query is rerun several times.
3. Advantageous to developers with less coding skills.
5. Partitions on date column can be mentioned to allow the new data to seamlessly integrate with the existing data. Further, the cube is refreshed to rebuild the particular updated segment and then finally it is merged with the existing cube which saves the cube rebuild time to a greater extent.
6. Kylin can be seamlessly integrated with BI tools such as Tableau, QlikView, PowerBI, and Excel etc. to provide powerful business insights.
5.
LIMITATIONS OF OLAP AND DW
ON HADOOP:
1. Cube is created based on the star schema data model only. No other data models such as Fact constellation or Snowflake schema are supported by Kylin.
2. Hadoop does not support row level update queries. This makes it difficult to use Hadoop for dimensional tables in datawarehouse that require updates for slowly changing dimension(s) (SCDs) tables [1].
6.
FUTURE SCOPE
The system is implemented by considering a small dataset i.e. in MBs and the results are concluded on the basis of this small dataset. There is a need to implement the proposed system on large datasets i.e. in GBs, TBs, and PBs and so on to verify that the results obtained are similar to the results present in this paper. Hence, the system needs to be implemented on a large dataset to ensure that the system presented in this paper is equally advantageous when a large dataset is used.
7.
CONCLUSION
In this paper, we have summarized the limitations of data warehouse and OLAP platforms. The critical problems are recognized and an efficient solution is presented. The proposed system has various features that are beneficial to the business organizations.
The main objective of the paper is to present a system which overcomes most of the challenges posed by the big data. We aimed to build OLAP data cubes on Hadoop platform and use it to generate insightful reports for business users. A brief description of the proposed system followed by its implementation details is mentioned in the paper. The proposed system should be implemented by considering a large dataset to ensure that the system will equally be advantageous as mentioned in section 4 of this paper. Also, there are few limitations of DW and OLAP on Hadoop platform that needs to be researched for a full-proof system.
8.
REFERENCES
[1] Kuldeep Deshpande, and Dr. Bhimappa Desai “Limitations of datawarehouse platforms and Assessment of Hadoop as an alternative”, IJITMIS, Volume 5, Issue 2, pp. 51-58, 2014.
[2] Shruti Tekadpande, Leena Deshpande “Analysis and Design of ETL process using Hadoop”, IJEIT, Volume 4,
Issue 12, pp. 171-174 2015.
[3] T.K.Das and Arati Mohapatro, “A Study on Big Data Integration with Data Warehouse”, International Journal of Computer Trends and Technology (IJCTT) – volume 9, number 4, Mar 2014.
[4] Merv Adrian and Colin White, “Analytic Platforms: Beyond the Traditional Data Warehouse”, BeyeNETWORK Custom Research Report, 2010.
[5] Clark Bradley, Ralph Hollingshead, Scott Kraus, Jason Lefler, Roshan Taheri, “Data Modeling Considerations in Hadoop and Hive”, Technical paper, SAS, 2013.
[6] Bo Wang, Hao Gui, Mark Roantree, Martin F. O’Connor, “Data Cube Computational Model with Hadoop MapReduce”, WEBIST, 2014.
[7] Marissa Rae Hollingsworth, Hadoop and Hive as Scalable Alternatives to RDBMS: A Case Study, Boise State University, 2012.
[8] Jie Song, Chaopeng Guo, Zhi Wang, Yichan Zhang, Ge Yu, et al.. “HaoLap: a Hadoop based OLAP system for big data”, Journal of Systems and Software, Elsevier, 2015, vol. 102, pp.167-181.
[9] Cohen, J., Dolan, B., Dunlap, M., Hellerstein, J.M., and Welton, C. MAD Skills: New Analysis Practices for Big Data. PVLDB 2(2), 2009.
[10] Yongqiang He et all “RCFile: A Fast and Space-efficient Data Placement Structure in MapReduce-based Warehouse Systems”, ICDE 2011.
[11] Philip Russom, Next generation Datawarehouse platforms, The Datawarehousing Institute, 2009
[12] Ashish Thusoo, Joydeep Sen Sarma, Amit Jain, Zheng Shao, Prasad Chakka, Ning Zhang, Suresh Antony, Hao Liu and Raghotham Murthy, Hive – A Petabyte Scale Data Warehouse Using Hadoop, IEEE, 2010.
[13] Alfredo Cuzzocrea, Il-Yeol Song, Ladjel Bellatreche, “Data Warehousing and OLAP over Big Data: Current challenges and future research directions”, DOLAP '13 Proceedings of the sixteenth international workshop on Data warehousing and OLAP, Pages 67-70.
[14] Gray, J., Chaudhuri, S., Bosworth, A., Layman, A., Reichart, D., Venkatrao, M., Pellow, F., and Pirahesh, H. Data Cube: A Relational Aggregation Operator Generalizing Group-by, Cross-Tab, and Sub Totals. Data Mining and Knowledge Discovery 1(1), 1997.
[15] Tian, X., 2008. Large-scale SMS messages mining based on map-reduce, IEEE International Symposium on Computational Intelligence and Design. Piscataway, NJ, USA, October 17–18, 2008, pp. 7–12.