Risk Management and Healthcare Policy 2018:11 139–158
Risk Management and Healthcare Policy
Dovepress
submit your manuscript | www.dovepress.com 139
O R i g i n a l R e s e a R c H open access to scientific and medical research
Open Access Full Text Article
The effect of consensus on demand for voluntary
micro health insurance in rural india
David Mark Dror1,2
atanu Majumdar1
arpita chakraborty3
1Research Department, Micro
insurance academy, garhi, east of Kailash, new Delhi, india; 2school
of Health Policy and Management, erasmus University Rotterdam, Rotterdam, the netherlands; 3centre
for economic studies and Planning, school of social sciences, Jawaharlal nehru University, new Delhi, india
Introduction: This study deals with examining factors that catalyze demand for community-based micro health insurance (MHI) schemes. We hypothesize that demand for health insurance is a collective decision in the context of informality and poverty. Our hypothesis challenges the classical theory of demand which posits individual expected diminishing utility. We examine factors beyond the traditional exogenous variables.
Methods: This study uses data collected through a household survey conducted among self-help groups in rural India in the states of Uttar Pradesh and Bihar before the implementation of three community-based MHI schemes. Additional information was extracted from the management information system maintained by the schemes. At the first step, we compared the estimated probability of a household joining the scheme (obtained by applying logistic regression) to the actual uptake. In the next step, we analyzed the role of consensus within groups on demand for health insurance (by applying ordinary least square regressions).
Results: The results of the logistic regressions indicated that exogenous household characteristics could not explain the probability of joining health insurance. We observed that group consen-sus on several critical issues, such as the price of the insurance, perceptions about exposure to adverse health events, and perceptions of the quality of service of local health care providers, was the important determinant of demand for insurance.
Conclusion: Based on the analysis, we reject the null hypothesis that demand is an individual decision at the household level. The analysis upholds the assumption that demand is created through a process of consensus building on perceptions of risk exposure, welfare gains from the insurance, and quality of local health care provision. Success in catalyzing demand for health insurance in the informal sector depends on encouraging group dialog.
Keywords: Community-based Health Insurance, micro insurance, consensus coefficient, con-sensus building, demand for micro insurance, collective decision
Introduction
The United Nations (UN) and the World Health Organization (WHO) promote the uni-versalization of health insurance coverage to provide financial protection from health shocks (a policy called Universal Health Coverage [UHC]).1 However, in many low- and
middle-income countries (LMIC), the efforts of government to implement UHC are unsuccessful because much of the population is in the “informal sector”, ie, outside the reach of most governmental social programs and ill-informed about the advantages of being included.2 India is a case in point: notwithstanding health insurance schemes in
some 30 states (also known as social health insurance [SHI] schemes) in 2017,3 uptake
was limited in 2015–2016 to ~29% of the population.4 Uninsured households had to pay
correspondence: David Mark Dror Micro insurance academy, a-153 (ground Floor), DDa Double storey Flats, garhi, east of Kailash, new Delhi 110065, india
Tel +41 78 790 6789 email [email protected]
Journal name: Risk Management and Healthcare Policy Article Designation: Original Research
Year: 2018 Volume: 11
Running head verso: Dror et al
Running head recto: Consensus-driven demand for MHI DOI: http://dx.doi.org/10.2147/RMHP.S170299
Risk Management and Healthcare Policy downloaded from https://www.dovepress.com/ by 118.70.13.36 on 27-Aug-2020
For personal use only.
Dovepress Dror et al
a large share of health care costs out of pocket.5 Moreover, as
loans often fund out of pocket spending (OOPS), the welfare losses extended beyond the cost of care to include the cost of interest (called “hardship financing”).6 Estimates from India
of the outright impoverishment due to these cumulative costs vary from 2.2%7 to 3.3%8 and to 3.5% of the total
popula-tion annually.9 Even in the face of these severe consequences
and the fact that there are no effective alternatives to health insurance (HI) to deal with OOPS in the informal and rural sector,10,11 most people do not join on a voluntary basis. This
situation begs an answer to the question: “If the benefits of HI are positively provable, how can theory explain the conditions under which the 3 billion or so in the informal sector of LMIC would seek voluntary health insurance?”12
Classical theories of demand for HI posit the hypothesis that the decision to purchase HI is individual and based on the expected payoffs relative to individual risk perception.13,14
Dror and Firth12 developed an alternative theory of demand,
stating that in the environment of poverty and informality in LMICs, group consensus influences personal decisions to join and pay and that groups reach consensus when they are comfortable that the local governance of the scheme will uphold the priorities that each group sets for its plan. This approach reflects a departure from the classical top-down delivery model of HI, in which the promoters (often the government) decide both the package design and governance issues. This study sets out to provide the proof that the effect of group consensus on demand for voluntary enrollment of households in health insurance is determinant.
Since the late 1990s, there has been a gradual increase in piloting of a bottom-up approach to extending health insur-ance under the name micro health insurinsur-ance (MHI).15–17 One
form of MHI is mutual aid of a local community, which also owns and operates the plan on a not-for-profit basis, often called Community-based Health Insurance (CBHI). In this study, we examine the null hypothesis that individuals decide independently to join CBHI. If that hypothesis is rejected, we aim to determine the influence of consensus on the decision of individuals belonging to the same community to enroll in CBHI (“the social effect”). If we can prove the existence of a social effect, we will aim to identify the factors that affect the formation of a consensus on enrollment into the CBHI by the members of the group.
The study of the effect of consensus on demand for voluntary MHI uses data from rural India. However, the relevance of this study extends much beyond India, con-sidering that several other developing countries, notably Burkina Faso, China, Ethiopia, Ghana, Philippines, Rwanda,
Senegal, Tanzania, and Vietnam, have implemented CBHI schemes.18 We reviewed the literature on CBHI schemes,
with the view to exploring that the research question we pose in this article is not yet resolved. Early reviews confirmed, albeit with substantial variation across schemes, that CBHI schemes were able to mobilize resources to finance health care.19,20 Ekman21 confirmed that such schemes could reach
low-income groups, although rarely the poorest. Acharya et al22 confirmed that some of these schemes had provided
significant protection from high OOPS, though the impact on the poor was limited. Beiseitov et al23 confirmed that
social networks and “word-of-mouth” played a more deci-sive role than formal sources of information, and Chat-terjee et al24 confirmed in particular that word-of-mouth
dissemination of information resulted in higher scheme utilization. Several publications provided evidence that solidarity, trust, community networks, civil–society links, and state–society links at the local level (all of which are components of social capital) positively affected the uptake of CBHI25 and that the willingness of farmers to join CBHI
in China was significantly and positively associated with community-level and individual-level social capital.26 Trust
and peer effects emerged as the key determinants of demand in a review of 41 articles published between 2000 and early 2013,27 as well as in the analysis of the uptake of
index-based drought insurance among coffee farmers in eastern Kenya.28 In Senegal, information received from family and
friends was trusted and positively associated with uptake in a scheme.29 A systematic review of 54 studies concluded
that the uptake of CBHI in LMICs depends on the socio-economic characteristics of the household (income, educa-tion, and age of head), recent episodes of chronic illness in the family, knowledge, and understanding of insurance and the scheme, access to and quality of the health facilities, and trust in the scheme management.18 Finally, another
study about the uptake of the New Cooperative Medical Scheme in rural China pointed to the significant role of social learning.30 While several previous studies mentioned
the important role of peers in affecting the demand for CBHI in the informal sector, none of the previous studies has addressed the theoretical framing of the influence of peers on decisions to join CBHI. We aim to provide such theoretical analysis in this study.
Data, ethical clearance, locations,
and methods
Data
The following four sources provided the data for this analysis:
Risk Management and Healthcare Policy downloaded from https://www.dovepress.com/ by 118.70.13.36 on 27-Aug-2020
Dovepress consensus-driven demand for MHi
(1) Household survey: A total of 3,685 households (21,373 individuals) were surveyed in March–May 2010 as a part of the cluster randomized controlled trial (CRCT) study design,31
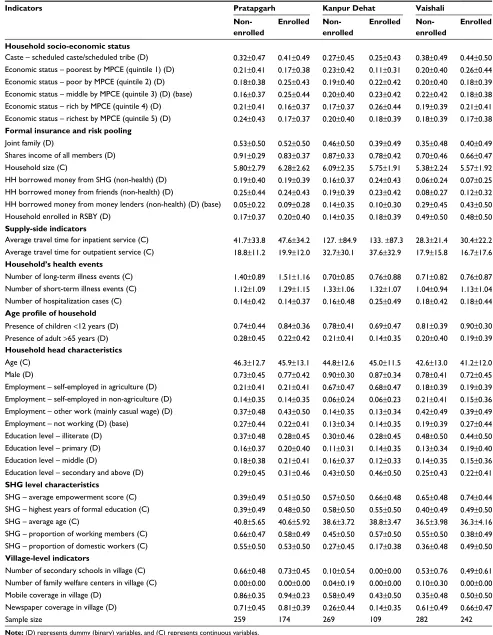
where at least one female member of the household was a member of a self-help group (SHG) affiliated to selected partner non-governmental organizations (NGOs). The survey questionnaire covered issues related to the socio-demographic and economic profile of the household, self-reported incidence of acute and chronic illness, hospitalization events, the cost of health events, and sources of financing it. A year later, in 2011, 1,335 households (from these 3,685) were offered to join CBHI by paying a premium, of which 525 joined. In 2012, these 1,335 households, during a repeat survey, were asked to confirm their reasons for joining/not joining.
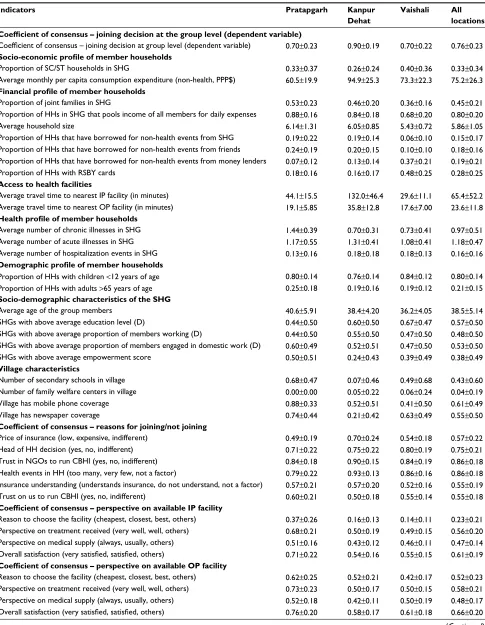
The study population was characterized by low educa-tion (44%–48% of the household heads of the combined sample were illiterate) and low economic background (aver-age monthly per capita expenditure (MPCE) was around purchasing power parity $ (PPP$) 75) (Tables S1 and S2). Nearest inpatient facility was located around 0.5–2 hours away, and the nearest outpatient facility was located around 20–40 minutes away. The study locations were around 75 km away from the nearest urban areas.32
(2) Management information system (MIS): Information on actual enrollment was collected from the MIS system maintained for the CBHI schemes under this study.
(3) Census, 2011: Village-level socio-demographic and infrastructural indicators were collected from the Village Directory of Census of India, 2011.33
(4) Qualitative data: Qualitative data were obtained from 35 focus group discussions (FGDs) (10 in Pratapgarh, 12 in Kanpur Dehat, and 13 in Vaishali) conducted with both the enrolled and non-enrolled members of the SHGs during July– August 2011, after the enrollment process was completed. The qualitative surveys were deductive. The objective of conducting FGDs was to gain an in-depth understanding of the key factors that motivated the households to join/not to join the CBHI. The FGDs were moderated by a team of two highly qualified (at least post-graduate) researchers trained in qualitative methods and techniques, who were proficient in the local language (Hindi). The qualitative data were audio recorded, along with notes taken by the researchers. The data were then first transcribed (verbatim) in Hindi by local researchers and then cleaned and translated into English by the qualitative researchers. The qualitative data were then coded as per thematic responses (such as household decision, group decision, trust, and so on) and analyzed theme-wise.
The FGD participants were all females whose average age was ~40 years (Table S2). Average years of formal education
of the participants were ~3–4 years with the majority being illiterate (50%–70%). Approximately 60%–70% of the respondents were engaged in domestic duties.
ethical clearance
This project obtained ethical clearance first from the ethics committee of the University of Cologne, Germany (knowl-edge partner in the project) in February 2010. A follow-up approval of changes introduced to the questionnaires after the baseline study was issued by the same committee in February 2012. A third approval was issued by the ethics committee of the Micro Insurance Academy (New Delhi) in August 2015 to confirm that the survey tools, data collec-tion, and analysis methodologies complied with the ethical requirements as practiced in India, in addition to the clearance already obtained earlier.33
study locations
The data relate to three CBHI schemes implemented in rural Pratapgarh and Kanpur Dehat districts of Uttar Pradesh state and in Vaishali district of Bihar state, India. The schemes were implemented through three grassroots NGOs, with technical assistance and facilitation from the Micro Insurance Academy, New Delhi.
Methods
Quantitative methods
Ceteris paribus, when the household decides to join CBHI independently of its reference group, the choice is expected to be dependent on the socio-economic characteristics, financial profile, access to health facilities, and recent health events of that household34 (see Table S1 for details of the variables).
The model can be presented as:
CBHIh=a SESh+bFIRPh+g SSh+d HEh+eh (1) Where CBHIh is a binary variable with a value of 1 if household h has joined CBHI, else 0.
SESh consists of the socio-economic characteristics of the household that include caste, MPCE quintile in which the household is, age, gender, educational attainment, and employment status of the household head.
The financial profile of the household is represented by the vector FIRPh (formal insurance and informal risk pooling mechanism), consisting of subscription status to Rashtriya Swasthya Bima Yojna (RSBY, government hospital insur-ance) household type (joint or nuclear), household size, whether the household shares the income of the earning members for day-to-day activities, and sources of borrowing for non-health purpose in recent past.
Risk Management and Healthcare Policy downloaded from https://www.dovepress.com/ by 118.70.13.36 on 27-Aug-2020
Dovepress Dror et al
The supply side of health characteristics is captured by the vector SSh (travel time to the nearest inpatient and out-patient facility).
HEh represents the health profile of the household (num-ber of long-term, short-term illnesses and hospitalization events).
eh is the error term that captures the unobservable
char-acteristics, which may affect CBHIh.
To address the first research question, the predicted prob-ability of each household (CBHIh) is estimated using equa-tion 1. In the next step, the expected proporequa-tion of members joining CBHI from each SHG is estimated using CBHIh and then compared with the actual proportion of members that joined from each SHG, followed by a binomial testing of the difference to assess the significance of difference.
Method to determine consensus on enrollment decision
To answer the second research question on the role of consen-sus in enrollment decision, we define consenconsen-sus as a “general agreement/resolution arrived at by most of those concerned, after everyone’s opinions are heard and understood, and a solu-tion that everyone agrees to is reached” by following the studies by Sultana and Thompson35 and Mohammed and Ringseis.36
To measure consensus, we first estimated the coefficient of unalikeability (CUA), which measures the variability of the binary outcome (yes or no) – in our context the decision to join CBHI within a group of households affiliated with an SHG. In other words, CUA measures how often the deci-sions of households differ from one another.37 The CUA can
be explained as:
CUA C x x
n n
x x
x x
x x
i j i j
i j i j
i j
=
( )
−
≠ = =
≠
∑
,, ,
, ( , ) 2
1 0
where C (2)
Here, xi and xj are the possible outcomes (decision to join or not join), and C(xi, xj) is the number of events where the
decision is different. The denominator, n2–n, represents the
total number of possible combinations of outcomes.38
Next, we estimated the coefficient of consensus (CC) using the following formula:
CC = 1 – CUA (3)
A value of 1 means that all group members made an identical choice; a value of zero means that no two members held the same position. The higher the value, the stronger is the group consensus.
We calculated CC for the enrollment decision to join CBHI at the group level using equation 3. The explanatory variables mentioned in equation 1 were recalculated at the group level (see Table S2 for the details of the variables). In addition to that, we also included several village-level characteristics as explanatory variables. Hence, the model specification changes to:
CCg=a SESg+bFIRPg+g SSg+aHEg+ μSHGg+nVILLv+eg (4)
Here, CCg is a continuous variable representing the level of consensus for SHG g on the decision to join CBHI (CC-CBHI).
The explanatory variables are grouped under six cat-egories: (i) socio-economic characteristics of the household (SES), (ii) variables reflecting access to formal insurance and informal risk pooling mechanism within the household (FIRP), (iii) variables related to access to health facilities (SS), (iv) variables reflecting perception about the health status of the household members (HE), (v) variables reflect-ing the level of consensus with an SHG on the decision to join CBHI and other SHG level characteristics such as average education level within the group, proportion of working members, proportion of members engaged in domestic duties etc. (SHG) and finally, (vi) variables rep-resenting the characteristics of the village the household belongs to (VILL).
The vector also includes a variable to indicate the group’s (above average) empowerment score; this score represents the average level of empowerment of the members of each SHG in taking vital decisions in their household, calculated based on the average score of answers to five questions that the respondents were asked about their role in day-to-day household operations. The questions were whether the woman SHG member of the household decides 1) what food to buy, 2) what major goods to buy, 3) how much schooling to give children, 4) what to do when a child is sick, and 5) whether she needs permission from her husband/in-laws/ other adults in the household to visit the local market. If the answer was “yes, the SHG member takes the decision (or does not need permission to go to local market)”, a score of 1 was assigned to each response, else 0. The average score for each household was used at the group level to calculate the average empowerment score for the group (summation of empowerment score of the households in that SHG/total number of group members). A dummy variable was created to indicate if the group has an above average score of all the SHGs in that locality.
Risk Management and Healthcare Policy downloaded from https://www.dovepress.com/ by 118.70.13.36 on 27-Aug-2020
Dovepress consensus-driven demand for MHi
VILLv includes the village-level indicators (number of secondary schools and family welfare centers, whether there is mobile and newspaper coverage in the village).
An ordinary least square (OLS) regression was applied to estimate the determinants of CCg.
In the following step, we used only the variables that were significant, after having checked the R-square value (that represents the goodness of fit, which is how close the actual observations are to that of the estimated observation).
We modify equation 4 in the next step by adding other variables that represent the degree of consensus among the group members on why they decided to join/not to join CBHI, the households’ perceptions of the health facilities they normally visit for inpatient services, outpatient services, and to buy medicines (see Table S2 for details). The model specification changes to:
CCg=a SSg+bSHGg+gVILLg+aCC-RSNg+mCC-HSSg+eg (5)
In equation 5, we add the CC (vector CC-RSN) for each group to express the reasons the households specified to explain their decision to join or not join CBHI (responses related to the price of insurance, the decision of household head, trust that the NGOs will implement as promised, trust that group members can operate the scheme, insurance understanding, and health events in households).
In addition, in this model we used as explanatory vari-able the households’ consensus on existing health services, represented by the vector CC-HSS, which captures the CC of the households’ opinion (reason to choose that facility, perception on services provided by the staff, availability of medical supplies, and overall satisfaction) on the health facility they normally visit (inpatient, outpatient, and pharmacy).
We added the consensus vectors in a phased manner to capture the changes in R-square value and assess the impor-tance of each vector on the group consensus on joining CBHI using an OLS framework.
Qualitative methods
Once the enrollment process was over in 2011, the 141 SHGs that were offered to join CBHI were sub-divided into the following two broad categories in all three locations: 1) enrolled (86 SHGs with at least one member enrolled) and 2) no-one enrolled (55 SHGs from which no one enrolled). For the FGDs, 35 out of the 141 SHGs (25%) were randomly selected from each cohort (20 from enrolled and 15 from non-enrolled). The FGDs were conducted during June–July 2011 with ~90%–100% (~8–10 members) participation rate from
each sample group. The discussions focused on the reasons that influenced the groups’ and the households’ decision to join or not-to-join CBHI. All the FGDs were conducted in Hindi (the local language), qualitative data were then tran-scribed into English and fitted into the software package Atlas-Ti for coding and analysis.
Results
Quantitative results
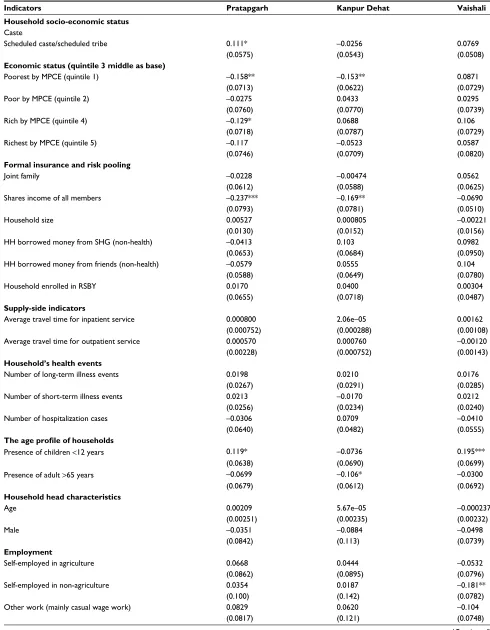
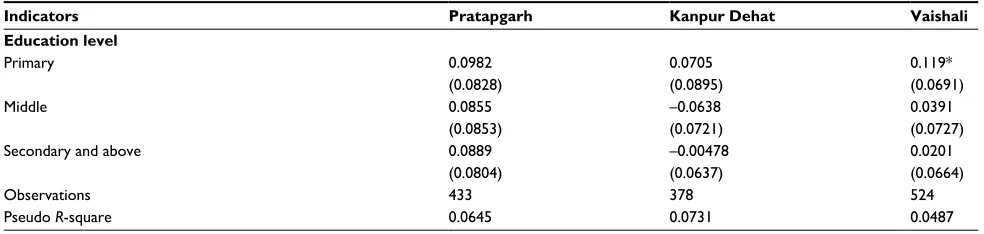
social effectThe results from the regression analysis of equation 1 are given in Table 1. The households classified as scheduled caste or scheduled tribe (SC/ST) were more likely to enroll in CBHI in Pratapgarh. Poorest-quintile households had a lower probability of enrolling than the middle expenditure-quintile households in Pratapgarh and Kanpur Dehat, and in Pratapgarh, the rich-quintiles had a higher probability of joining insurance compared to the middle quintile. House-holds in which family members share their income to meet daily expenses were less likely to enroll in Pratapgarh and Kanpur Dehat. Presence of children in the family positively influenced uptake in Pratapgarh and Vaishali, and the pres-ence of adults had a negative association in Kanpur Dehat. Formal education of the household head increased the likeli-hood of enrolling in Vaishali.
Table 2 contains the predicted proportion of group members who would join CBHI, estimated using only the characteristics of household h using equation 1 under the hypothesis that each household decides independently. The result was different from the observed proportion of members who had joined CBHI for all the groups in the study locations. For 73 groups, the actual proportion was less than the predicted proportion (the lowest difference was –0.46), whereas in the other 68 groups the actual pro-portion was higher than predicted (the highest difference was 0.69). The difference between the observed and the predicted proportions of joining CBHI was significant for 86 out of 141 groups (61%). The high number of groups for which the difference between the predicted and observed proportion was significant indicates that the decision of households to join CBHI is not explainable solely by the household indicators, which leads to the conclusion that the null hypothesis (that the probabilities of household participation in CBHI are independent of each other) does not hold for most groups. It also indicates a possible role of the group (ie, beyond the household level) and geographic influence on the decision-making process. We term this influence ‘the social effect’.
Risk Management and Healthcare Policy downloaded from https://www.dovepress.com/ by 118.70.13.36 on 27-Aug-2020
Dovepress Dror et al
Table 1 logit regression of marginal effect estimates (standard errors) at the household level with household-level characteristics
Indicators Pratapgarh Kanpur Dehat Vaishali
Household socio-economic status
caste
scheduled caste/scheduled tribe 0.111* –0.0256 0.0769
(0.0575) (0.0543) (0.0508)
Economic status (quintile 3 middle as base)
Poorest by MPce (quintile 1) –0.158** –0.153** 0.0871
(0.0713) (0.0622) (0.0729)
Poor by MPce (quintile 2) –0.0275 0.0433 0.0295
(0.0760) (0.0770) (0.0739)
Rich by MPce (quintile 4) –0.129* 0.0688 0.106
(0.0718) (0.0787) (0.0729)
Richest by MPce (quintile 5) –0.117 –0.0523 0.0587
(0.0746) (0.0709) (0.0820)
Formal insurance and risk pooling
Joint family –0.0228 –0.00474 0.0562
(0.0612) (0.0588) (0.0625)
shares income of all members –0.237*** –0.169** –0.0690
(0.0793) (0.0781) (0.0510)
Household size 0.00527 0.000805 –0.00221
(0.0130) (0.0152) (0.0156)
HH borrowed money from sHg (non-health) –0.0413 0.103 0.0982
(0.0653) (0.0684) (0.0950)
HH borrowed money from friends (non-health) –0.0579 0.0555 0.104
(0.0588) (0.0649) (0.0780)
Household enrolled in RsBY 0.0170 0.0400 0.00304
(0.0655) (0.0718) (0.0487)
Supply-side indicators
average travel time for inpatient service 0.000800 2.06e–05 0.00162
(0.000752) (0.000288) (0.00108)
average travel time for outpatient service 0.000570 0.000760 –0.00120
(0.00228) (0.000752) (0.00143)
Household’s health events
number of long-term illness events 0.0198 0.0210 0.0176
(0.0267) (0.0291) (0.0285)
number of short-term illness events 0.0213 –0.0170 0.0212
(0.0256) (0.0234) (0.0240)
number of hospitalization cases –0.0306 0.0709 –0.0410
(0.0640) (0.0482) (0.0555)
The age profile of households
Presence of children <12 years 0.119* –0.0736 0.195***
(0.0638) (0.0690) (0.0699)
Presence of adult >65 years –0.0699 –0.106* –0.0300
(0.0679) (0.0612) (0.0692)
Household head characteristics
age 0.00209 5.67e–05 –0.000237
(0.00251) (0.00235) (0.00232)
Male –0.0351 –0.0884 –0.0498
(0.0842) (0.113) (0.0739)
Employment
self-employed in agriculture 0.0668 0.0444 –0.0532
(0.0862) (0.0895) (0.0796)
self-employed in non-agriculture 0.0354 0.0187 –0.181**
(0.100) (0.142) (0.0782)
Other work (mainly casual wage work) 0.0829 0.0620 –0.104
(0.0817) (0.121) (0.0748)
(Continued)
Risk Management and Healthcare Policy downloaded from https://www.dovepress.com/ by 118.70.13.36 on 27-Aug-2020
Dovepress consensus-driven demand for MHi
Table 1 (Continued)
Indicators Pratapgarh Kanpur Dehat Vaishali
Education level
Primary 0.0982 0.0705 0.119*
(0.0828) (0.0895) (0.0691)
Middle 0.0855 –0.0638 0.0391
(0.0853) (0.0721) (0.0727)
secondary and above 0.0889 –0.00478 0.0201
(0.0804) (0.0637) (0.0664)
Observations 433 378 524
Pseudo R-square 0.0645 0.0731 0.0487
Note: Robust standard errors in parentheses; ***P<0.01, **P<0.05, and *P<0.1.
Abbreviations: HH, household; MPce, monthly per capita expenditure; RsBY, Rashtriya swasthya Bima Yojna government hospital insurance; sHg, self-Help group.
When asked about the reasons for joining/not joining CBHI, 16% of the households said that the price of the insur-ance was affordable, 23% said that it was too expensive, and the remaining 61% were indifferent to price. Most respon-dents reported that their household head’s decision to join CBHI, their trust in the NGO, and the group members’ ability to administer the schemes were not deciding factors to enroll in CBHI. However, their self-assessed understanding of the effects of being insured was quite varied: 21% mentioned that insurance could protect them when health needs arise, 29% reported that they did not understand the benefits of health insurance, and the remaining 50% were indifferent to insur-ance understanding. This result indicates that consensus on various issues related to the reasons for joining/not joining varied across the target population.
consensus on enrollment decision
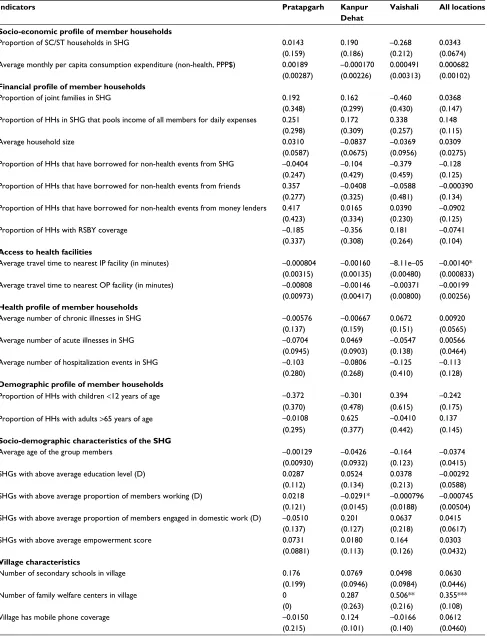
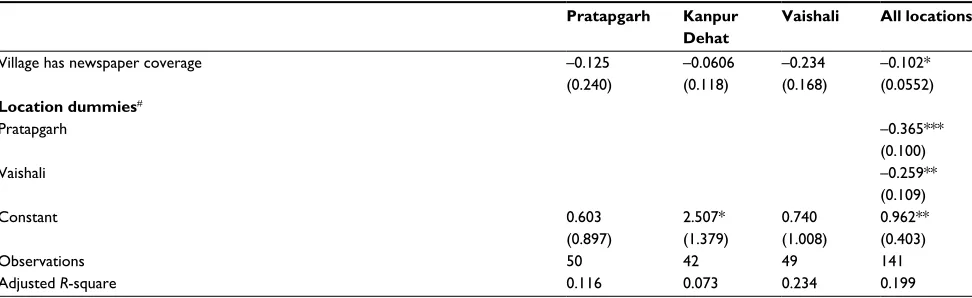
Table 3 contains the results of the OLS regression with the consensus of joining CBHI (CC-CBHI) at the group level. We explored both types of consensus: toward joining and toward not joining. There was a negative association in the pooled sample between the average travel time to the nearest hospital and CC-CBHI, ie, the longer the average travel time, the lower the degree of consensus on joining/not joining CBHI. In two locations, the CBHI reimbursed hospital fees and transportation costs for inpatient care, and all three schemes covered wage loss (up to a cap) in cases of hospitalization. Considering the low level of hospitalization benefits covered by the CBHI schemes, possibly the group members could not agree on joining. CC-CBHI was inversely linked to the proportion of working members in Kanpur Dehat. Hence, the larger the number of members working as self-employed/ casual labor/salaried, the lower the consensus on joining the CBHI. This could suggest that as contacts between group
members weaken, they may be less likely to participate in group deliberations and thus obviously less likely to share the same reasoning. Also, access to newspapers was negatively associated with CC-CBHI for the pooled data. On the flip side, in Vaishali and the combined sample, the presence of family welfare centers (these are places where village females meet regularly to discuss various family planning issues) was positively correlated with consensus on joining CBHI.
When CC-CBHI was regressed using only the significant variables in the previous step (estimation of equation 4), the trends of a negative association with access to inpatient care, proportion of working members in the SHG with access to a newspaper in the village and positive link with the fam-ily welfare centers, remained largely unchanged (Table 4, columns 1, 4, 7, and 10).
In the next step, we included the consensus relating to the reasons of households for joining/not joining CBHI (refer to columns 2, 5, 8, and 11 of Table 4). Consensus on the price of health insurance was positively correlated with the consensus of joining CBHI in Kanpur Dehat, Vaishali, and the whole sample. With a one-unit change in the con-sensus coefficient on price, CC-CBHI increased by 25% (P=0.051) in Kanpur Dehat, 53% in Vaishali (P=0.006), and 28% (P=0.002) for the combined data. Similarly, the consensus for the existing health events at household as a reason for joining/not joining CBHI was positively associ-ated with CC-CBHI in all three locations. A one-unit change in the consensus coefficient on the member households’ vulnerability toward health events increased CC-CBHI by 44% in Pratapgarh (P=0.009), 59% in Kanpur Dehat (P=0.022), 43% in Vaishali (P=0.052), and 34% for all locations together (P=0.001).
In the next step, we included in the model as explana-tory variables the consensus indicators of the households’
Risk Management and Healthcare Policy downloaded from https://www.dovepress.com/ by 118.70.13.36 on 27-Aug-2020
Dovepress Dror et al
Table 2
Difference between predicted (using only household characteristics) and actual proportion of total members from an
sH g to join c BH i
Group ID
Pratapgarh
Kanpur Dehat
Vaishali
Actual proportion of members joined Predicted proportion of members joined The difference (actual- predicted)
P
-value of difference Actual proportion of members joined Predicted proportion of members joined The difference (actual- predicted)
P
-value of difference Actual proportion of members joined Predicted proportion of members joined The difference (actual- predicted)
P
-value of difference
g roup 1 0.00 0.29 –0.29 0.095 0.89 0.28 0.61 0.000 0.86 0.47 0.39 0.003 g roup 2 0.78 0.35 0.43 0.011 0.00 0.20 –0.20 0.256 0.85 0.62 0.22 0.079 g roup 3 0.00 0.32 –0.32 0.032 0.00 0.23 –0.23 0.077 0.67 0.44 0.23 0.094 g roup 4 0.86 0.50 0.36 0.064 0.00 0.28 –0.28 0.101 0.00 0.46 –0.46 0.001 g roup 5 0.00 0.39 –0.39 0.012 0.56 0.31 0.25 0.111 0.69 0.49 0.20 0.120 g roup 6 0.00 0.33 –0.33 0.029 0.80 0.30 0.50 0.002 0.20 0.35 –0.15 0.436 g roup 7 0.08 0.46 –0.38 0.007 0.00 0.26 –0.26 0.046 0.29 0.39 –0.10 0.446 g roup 8 1.00 0.55 0.45 0.005 0.00 0.19 –0.19 0.125 0.50 0.49 0.01 0.606 g roup 9 0.86 0.43 0.42 0.029 0.00 0.25 –0.25 0.042 0.80 0.37 0.43 0.007 g roup 10 0.86 0.50 0.36 0.061 1.00 0.31 0.69 0.000 0.45 0.49 –0.04 0.519 g roup 11 0.50 0.39 0.11 0.301 0.00 0.22 –0.22 0.081 0.67 0.45 0.22 0.167 g roup 12 0.75 0.46 0.29 0.103 0.00 0.23 –0.23 0.056 0.00 0.48 –0.48 0.001 g roup 13 0.00 0.43 –0.43 0.004 0.00 0.21 –0.21 0.080 0.00 0.40 –0.40 0.011 g roup 14 0.67 0.38 0.29 0.151 0.18 0.26 –0.08 0.419 0.00 0.44 –0.44 0.005 g roup 15 0.00 0.35 –0.35 0.013 0.82 0.33 0.48 0.001 0.73 0.50 0.23 0.109 g roup 16 0.00 0.32 –0.32 0.014 0.57 0.38 0.19 0.258 0.00 0.45 –0.45 0.003 g roup 17 0.14 0.47 –0.32 0.088 0.00 0.22 –0.22 0.085 0.00 0.44 –0.44 0.002 g roup 18 0.63 0.45 0.17 0.266 0.00 0.29 –0.29 0.177 0.29 0.47 –0.19 0.272 g roup 19 0.83 0.42 0.41 0.052 0.00 0.32 –0.32 0.095 0.78 0.46 0.31 0.059 g roup 20 0.67 0.40 0.27 0.097 0.43 0.35 0.08 0.463 0.00 0.49 –0.49 0.002 g roup 21 0.69 0.41 0.29 0.036 0.67 0.35 0.31 0.027 0.80 0.57 0.23 0.126 g roup 22 0.40 0.34 0.06 0.555 0.00 0.27 –0.27 0.077 0.58 0.44 0.14 0.240 g roup 23 0.43 0.41 0.02 0.600 0.00 0.32 –0.32 0.030 0.60 0.48 0.12 0.325 g roup 24 0.00 0.32 –0.32 0.096 0.00 0.33 –0.33 0.028 1.00 0.46 0.54 0.000 g roup 25 0.00 0.36 –0.36 0.046 0.00 0.22 –0.22 0.107 0.00 0.38 –0.38 0.008 g roup 26 0.63 0.39 0.23 0.163 1.00 0.36 0.64 0.006 0.00 0.45 –0.45 0.002 g roup 27 0.18 0.37 –0.19 0.168 0.00 0.32 –0.32 0.315 0.80 0.49 0.31 0.049 g roup 28 0.00 0.31 –0.31 0.054 0.00 0.24 –0.24 0.148 0.55 0.51 0.03 0.534 g roup 29 0.88 0.39 0.48 0.007 1.00 0.30 0.70 0.000 0.65 0.51 0.14 0.177 g roup 30 0.00 0.36 –0.36 0.637 1.00 0.38 0.62 0.000 0.82 0.49 0.33 0.028 g roup 31 0.63 0.41 0.21 0.197 0.85 0.34 0.50 0.000 0.00 0.40 –0.40 0.006 g roup 32 0.07 0.33 –0.26 0.030 0.00 0.25 –0.25 0.044 0.59 0.41 0.18 0.105 g roup 33 0.29 0.36 –0.08 0.504 0.00 0.31 –0.31 0.153 0.00 0.41 –0.41 0.003 g roup 34 0.55 0.38 0.17 0.202 0.00 0.31 –0.31 0.012 0.62 0.52 0.09 0.347 g roup 35 0.17 0.31 –0.15 0.226 0.00 0.24 –0.24 0.049 0.00 0.43 –0.43 0.000 g roup 36 0.31 0.47 –0.17 0.179 0.00 0.36 –0.36 0.028 0.00 0.45 –0.45
0.002 (Continued
)
Risk Management and Healthcare Policy downloaded from https://www.dovepress.com/ by 118.70.13.36 on 27-Aug-2020
Dovepress consensus-driven demand for MHi
Table 2
(
Continued
)
Group ID
Pratapgarh
Kanpur Dehat
Vaishali
Actual proportion of members joined Predicted proportion of members joined The difference (actual- predicted)
P
-value of difference Actual proportion of members joined Predicted proportion of members joined The difference (actual- predicted)
P
-value of difference Actual proportion of members joined Predicted proportion of members joined The difference (actual- predicted)
P
-value of difference
g roup 37 0.70 0.35 0.35 0.024 0.00 0.26 –0.26 0.051 0.40 0.45 –0.05 0.508 g roup 38 0.60 0.48 0.12 0.333 0.00 0.28 –0.28 0.137 0.22 0.42 –0.19 0.202 g roup 39 0.00 0.30 –0.30 0.345 0.00 0.31 –0.31 0.054 0.67 0.38 0.28 0.045 g roup 40 0.43 0.49 –0.06 0.522 0.00 0.30 –0.30 0.010 0.00 0.44 –0.44 0.006 g roup 41 0.88 0.49 0.39 0.030 1.00 0.39 0.61 0.001 0.67 0.40 0.27 0.100 g roup 42 0.18 0.31 –0.13 0.284 0.80 0.36 0.44 0.006 0.60 0.51 0.09 0.411 g roup 43 0.00 0.41 –0.41 0.009 0.70 0.44 0.26 0.096 g roup 44 0.90 0.49 0.41 0.010 0.63 0.45 0.18 0.256 g roup 45 0.00 0.37 –0.37 0.007 0.91 0.47 0.44 0.003 g roup 46 0.60 0.48 0.12 0.470 0.67 0.52 0.15 0.287 g roup 47 0.70 0.42 0.28 0.067 0.08 0.36 –0.28 0.036 g roup 48 0.70 0.57 0.13 0.305 0.85 0.54 0.31 0.021 g roup 49 0.40 0.43 –0.03 0.546 0.82 0.55 0.26 0.068 g roup 50 0.38 0.37 0.01 0.613 Abbreviations: c BH i, c ommunity-based Health insurance; sH g
, self-help groups.
perspective on the existing health services (the reason to choose the facility [cheapest/closest/best/other], opinion about the quality of treatment by the medical staff [very well/other], availability of medical supplies [always/ usually/other], and overall satisfaction level with inpa-tient care, outpainpa-tient care, and pharmacy [very satisfied/ satisfied/other] [columns 3, 6, 9, and 12 of Table 4]). The consensus indicators relating to the price of insurance and health events remained largely unchanged. Consensus on joining CBHI was positively associated with consensus on the reasons to choose the hospital (cheapest/closest/best/ other) in Pratapgarh (coefficient =0.414, P=0.044) and overall (coefficient =0.159, P=0.096). Also, consensus on respondents’ satisfaction with the treatment provided by the medical staff at the inpatient facility (very well/well/ other) was positively associated with CC-CBHI in Vaishali (coefficient =0.696, P=0.032).
Overall, the availability of medical supplies at the outpa-tient facility had a positive influence on consensus, but the availability of a pharmacy had a negative influence in Kanpur Dehat and the full sample.
Additionally, the inclusion of consensus variables sub-stantially improved the adjusted R-square values, which indicate the percentage of variation explained only by the independent variables that affect the dependent variable of the regression models (adjusted R-square improved from 0.016–0.211 to 0.194–0.386, Table 4).
Qualitative results
Findings from the enrolled groups
When participants of the FGDs from the enrolled groups were asked about the reason for their decision to enroll in CBHI, the highest score was given to “group decision” in Pratapgarh (34%) and Vaishali (31%) (Table 5); in Kanpur Dehat it was also an important reason (25%), second only to affordability and coverage of outpatient services by local practitioners (both at 29%).
Initially, many respondents said that they could not under-stand the benefits and how the scheme operated. However, it seems that they were doubters or “fence-sitters” rather than opponents because once the group head decided to join, other members followed. One respondent in Pratapgarh said that: “I used to sit in the meetings, but I was unable to say anything. I could not form an opinion at the time as I could not understand it. I thought to myself when all the group members would join this scheme, I will also join it.” An SHG leader from Vaishali reported that: “when I decided to join, two other members followed immediately, and a bit later-on,
Risk Management and Healthcare Policy downloaded from https://www.dovepress.com/ by 118.70.13.36 on 27-Aug-2020
Dovepress Dror et al
Table 3 OLS regression with coefficient of consensus of joining CBHI within a group as dependent variable
Indicators Pratapgarh Kanpur
Dehat
Vaishali All locations
Socio-economic profile of member households
Proportion of sc/sT households in sHg 0.0143 0.190 –0.268 0.0343
(0.159) (0.186) (0.212) (0.0674)
average monthly per capita consumption expenditure (non-health, PPP$) 0.00189 –0.000170 0.000491 0.000682 (0.00287) (0.00226) (0.00313) (0.00102)
Financial profile of member households
Proportion of joint families in sHg 0.192 0.162 –0.460 0.0368
(0.348) (0.299) (0.430) (0.147)
Proportion of HHs in sHg that pools income of all members for daily expenses 0.251 0.172 0.338 0.148
(0.298) (0.309) (0.257) (0.115)
average household size 0.0310 –0.0837 –0.0369 0.0309
(0.0587) (0.0675) (0.0956) (0.0275) Proportion of HHs that have borrowed for non-health events from sHg –0.0404 –0.104 –0.379 –0.128
(0.247) (0.429) (0.459) (0.125)
Proportion of HHs that have borrowed for non-health events from friends 0.357 –0.0408 –0.0588 –0.000390
(0.277) (0.325) (0.481) (0.134)
Proportion of HHs that have borrowed for non-health events from money lenders 0.417 0.0165 0.0390 –0.0902
(0.423) (0.334) (0.230) (0.125)
Proportion of HHs with RsBY coverage –0.185 –0.356 0.181 –0.0741
(0.337) (0.308) (0.264) (0.104)
Access to health facilities
average travel time to nearest iP facility (in minutes) –0.000804 –0.00160 –8.11e–05 –0.00140* (0.00315) (0.00135) (0.00480) (0.000833) average travel time to nearest OP facility (in minutes) –0.00808 –0.00146 –0.00371 –0.00199
(0.00973) (0.00417) (0.00800) (0.00256)
Health profile of member households
average number of chronic illnesses in sHg –0.00576 –0.00667 0.0672 0.00920
(0.137) (0.159) (0.151) (0.0565)
average number of acute illnesses in sHg –0.0704 0.0469 –0.0547 0.00566
(0.0945) (0.0903) (0.138) (0.0464)
average number of hospitalization events in sHg –0.103 –0.0806 –0.125 –0.113
(0.280) (0.268) (0.410) (0.128)
Demographic profile of member households
Proportion of HHs with children <12 years of age –0.372 –0.301 0.394 –0.242
(0.370) (0.478) (0.615) (0.175)
Proportion of HHs with adults >65 years of age –0.0108 0.625 –0.0410 0.137
(0.295) (0.377) (0.442) (0.145)
Socio-demographic characteristics of the SHG
average age of the group members –0.00129 –0.0426 –0.164 –0.0374
(0.00930) (0.0932) (0.123) (0.0415)
sHgs with above average education level (D) 0.0287 0.0524 0.0378 –0.00292
(0.112) (0.134) (0.213) (0.0588)
sHgs with above average proportion of members working (D) 0.0218 –0.0291* –0.000796 –0.000745
(0.121) (0.0145) (0.0188) (0.00504)
sHgs with above average proportion of members engaged in domestic work (D) –0.0510 0.201 0.0637 0.0415
(0.137) (0.127) (0.218) (0.0617)
sHgs with above average empowerment score 0.0731 0.0180 0.164 0.0303
(0.0881) (0.113) (0.126) (0.0432)
Village characteristics
number of secondary schools in village 0.176 0.0769 0.0498 0.0630
(0.199) (0.0946) (0.0984) (0.0446)
number of family welfare centers in village 0 0.287 0.506** 0.355***
(0) (0.263) (0.216) (0.108)
Village has mobile phone coverage –0.0150 0.124 –0.0166 0.0612
(0.215) (0.101) (0.140) (0.0460)
(Continued)
Risk Management and Healthcare Policy downloaded from https://www.dovepress.com/ by 118.70.13.36 on 27-Aug-2020
Dovepress consensus-driven demand for MHi
everybody joined.” The early-joiner members played a vital role in convincing others to enroll by explaining the benefits payable by the CBHI scheme. One participant stated that “there were two or three members of our group who were not willing to join. So, we explained everything to them. Finally, they also joined.”
While further probing the discussions that preceded the decision to join CBHI, it was revealed that the participants thought that being part of the group was worthwhile and might lead to added benefits (more likely to get loans). In Kanpur Dehat, one female participant said that: “these groups are like support. We can withdraw our money or take a loan from the group. That is why we have taken everyone’s opinion and then decided to join.”
Participants also emphasized that one of the deciding factors in favor of enrollment was their trust in the scheme management. In Vaishali, one lady said that: “my husband told me that the villagers would do everything, outsiders will not decide anything. When the villagers are in charge of the decisions, go ahead and enroll in it.” Trust in the administrative structure, which included the villagers and the implementing NGOs, was the second highest cited factor for uptake in Pratapgarh (25%) (Table 5).
Findings from the non-enrolled groups
Inability to pay the premium was cited most frequently by SHGs as the reason for not enrolling: 37%–38% of replies in the three locations (Table 5). One participant in Kanpur Dehat stated that: “We have financial problems, as we must feed eight-nine people at home. How can we also pay for the insurance?” The timing of the enrollment (March–April),
which coincided with the season when farmers had to invest in farming, was also mentioned by many as a reason. One SHG member in Vaishali pointed that: “a farmer can pay the premium only during the harvest season. I have a family of 6, so my total premium amounts to about Indian rupees (INR) 1,000. Should I spend that to buy seeds or to buy insurance?”
The consensus among the groups not to join was noted with one group in Pratapgarh, following discussions during which the members understood that CBHI, unlike SHGs, would not lend money from the premium amounts collected; everyone from that SHG decided not to enroll as most preferred savings with loans over health insurance. Further probing revealed that many of the group members believed that health was a personal issue which should be taken care of at the household level, without involving the entire group. Not surprisingly, when most group members decided not to join the scheme, the remaining few that initially wanted to join also opted out.
In Vaishali, one member said that: “Our money will be deposited in the bank account of the president of the group. This is problematic. We do not trust her.” In this case, some members were reluctant to trust the CBHI administrator because of previous financial irregularities. In addition to lack of trust, some participants also doubted the quality of care they could expect from the scheme.
Discussion
This study sets out to provide a theoretical explanation, veri-fied by evidence, about whether the decision of each member to enroll in CBHI can be considered to be taken purely based on individual utility considerations or whether it is impacted by consensus among peers. The null hypothesis we probed Table 3 (Continued)
Pratapgarh Kanpur Dehat
Vaishali All locations
Village has newspaper coverage –0.125 –0.0606 –0.234 –0.102*
(0.240) (0.118) (0.168) (0.0552)
Location dummies#
Pratapgarh –0.365***
(0.100)
Vaishali –0.259**
(0.109)
constant 0.603 2.507* 0.740 0.962**
(0.897) (1.379) (1.008) (0.403)
Observations 50 42 49 141
adjusted R-square 0.116 0.073 0.234 0.199
Notes: standard errors in parentheses; ***P<0.01, **P<0.05, and *P<0.1. (D) indicates the dummy variable, with value of 1 if sHgs with above average value, else 0. #Values of the locational dummies equals 1 if the sHg is in that district, else 0.
Abbreviations: cBHi, community-based Health insurance; HH, households; iP, inpatient; MPce, monthly per capita expenditure; Ols, ordinary least square; OP, outpatient; PPP$, purchasing power parity $; sc, scheduled caste; sHg, self-help groups; sT, scheduled tribe.
Risk Management and Healthcare Policy downloaded from https://www.dovepress.com/ by 118.70.13.36 on 27-Aug-2020
Dovepress Dror et al
Table 4
OLS regression with coefficient of consensus of joining CBHI within a group as dependent variable
Indicators Pratapgarh Kanpur Dehat Vaishali All locations (1) (2) (3) (4) (5) (6) (7) (8) (9) (10) (11) (12)
Access to health facilities average travel time to nearest
iP facility (in minutes)
–0.003 –0.0026 0.00182 –0.0016** –0.0014* –0.00106 1.62e–1 0.00199 0.00449 –0.0017** –0.0013** –0.00070 (0.002) (0.0021) (0.0031) (0.00076) (0.00071) (0.00081) (0.0028) (0.0028) (0.0046) (0.00066) (0.00062) (0.00067)
Socio-demographic characteristics of the SHG above average proportion of members working (D)
# –0.0011 0.0473 –0.0321 –0.0229 –0.0126 –0.0303 –0.0477 –0.112* –0.0723 –0.0160 –7.21e–1 –0.00467 (0.067) (0.066) (0.092) (0.0588) (0.0531) (0.0616) (0.061) (0.063) (0.083) (0.0348) (0.0321) (0.0339)
Village characteristics number of family welfare centers in village
0 0 0 0.273** 0.385** 0.292 0.36*** 0.283** 0.267* 0.317*** 0.301*** 0.252** (0) (0) (0) (0.157) (0.162) (0.209) (0.126) (0.120) (0.148) (0.0991) (0.0938) (0.0984)
Village has newspaper coverage
0.0068 0.0701 0.0751 –0.0729 –0.0730 –0.0211 –0.107* –0.0601 –0.0427 –0.0631 –0.0284 –0.0210 (0.08) (0.079) (0.091) (0.0705) (0.0635) (0.0793) (0.064) (0.062) (0.085) (0.0389) (0.0366) (0.0381)
Coefficient of consensus – reasons for joining/not joining Price of insurance
0.249 0.310 0.246* 0.279* 0.53*** 0.568** 0.278*** 0.287*** (0.205) (0.232) (0.127) (0.142) (0.183) (0.240) (0.0878) (0.0894)
Head of HH decision
0.0851 0.200 –0.122 –0.144 –0.0934 –0.306 –0.0140 –0.0212 (0.149) (0.189) (0.124) (0.143) (0.165) (0.198) (0.0801) (0.0829) Trust on ng
Os to run
c BH i –0.0286 –0.0487 0.172 –0.0103 0.218 0.265 0.132 0.0814 (0.181) (0.198) (0.230) (0.270) (0.175) (0.226) (0.0996) (0.103)
Health events in HH
0.44*** 0.338* 0.592** 0.437 0.427* 0.381 0.342*** 0.278*** (0.159) (0.166) (0.245) (0.282) (0.213) (0.276) (0.0968) (0.0968) insurance understanding 0.0355 0.179 –0.0629 –0.00951 0.267 0.123 0.00716 0.00739 (0.182) (0.209) (0.134) (0.160) (0.180) (0.245) (0.0846) (0.0904)
Trust us to run
c BH i 0.109 0.140 –0.0948 –0.138 0.279 0.248 0.0522 0.0474 (0.149) (0.171) (0.145) (0.204) (0.223) (0.259) (0.0893) (0.0899)
Coefficient of consensus – perspective on available IP care Reason to choose the facility
0.414** –0.171 0.300 0.159* (0.196) (0.265) (0.476) (0.0950)
Perspective on treatment received
–0.318 0.205 0.696** 0.208 (0.370) (0.179) (0.308) (0.132)
Perspective on medical supply
–0.434 –0.445 –0.185 –0.235 (0.275) (0.320) (0.363) (0.145) Overall satisfaction 0.147 –0.344 –0.0920 –0.216 (0.387) (0.261) (0.296) (0.140)
Coefficient of consensus – perspective on available OP care Reason to choose the facility
–0.0875 0.104 0.104 0.0579 (0.213) (0.193) (0.303) (0.0922) ( Continued )
Risk Management and Healthcare Policy downloaded from https://www.dovepress.com/ by 118.70.13.36 on 27-Aug-2020
Dovepress consensus-driven demand for MHi Table 4 ( Continued ) Indicators Pratapgarh Kanpur Dehat Vaishali All locations (1) (2) (3) (4) (5) (6) (7) (8) (9) (10) (11) (12)
Perspective on treatment received
0.411 0.0635 –0.150 0.0856 (0.403) (0.246) (0.355) (0.143)
Perspective on medical supply
0.341 0.436 0.271 0.295** (0.298) (0.285) (0.324) (0.127) Overall satisfaction –0.0183 0.0567 0.0479 0.0328 (0.456) (0.266) (0.314) (0.143)
Coefficient of consensus – perspective on available pharmacy Reason to choose the facility
–0.126 0.0875 –0.0879 –0.0259 (0.201) (0.159) (0.343) (0.101)
Perspective on treatment received
–0.0950 0.0360 0.212 –0.0460 (0.280) (0.192) (0.315) (0.118)
Perspective on medical supply
–0.404 –0.445* –0.346 –0.283** (0.268) (0.232) (0.372) (0.127) Overall satisfaction –0.101 0.125 –0.0487 0.00732 (0.322) (0.215) (0.328) (0.126) Location dummies # Pratapgarh –0.31*** –0.170** –0.196** (0.0735) (0.0731) (0.0754) Vaishali –0.36*** –0.25*** –0.191** (0.0817) (0.0787) (0.0837) c onstant 0.84*** 0.160 0.0687 1.134*** 0.388 0.710 0.77*** –0.342 –0.453 1.139*** 0.409** 0.482** (0.108) (0.259) (0.310) (0.118) (0.234) (0.539) (0.101) (0.365) (0.523) (0.0966) (0.170) (0.188) Observations 50 50 50 42 42 42 49 49 49 141 141 141 R -square 0.016 0.130 0.194 0.037 0.318 0.348 0.119 0.299 0.265 0.211 0.352 0.386 Notes: standard errors in parentheses; *** P < 0.01, ** P < 0.05, and * P <
0.1. (D) indicates
the
dummy
variable, with value
of
1 if
sH
g
s with above
average
value, else 0.
#Values
of
the locational
dummies
equals
1 if the
sH
g
is in that
district,
else 0. Abbreviations:
c
BH
i,
c
ommunity-based Health
insurance; HH, household;
iP, inpatient;
ng
Os, non-governmental organizations; O
ls
, ordinary least square; OP, outpatient;
sH
g
, self-help groups.
Risk Management and Healthcare Policy downloaded from https://www.dovepress.com/ by 118.70.13.36 on 27-Aug-2020
Dovepress Dror et al
was that households decide whether to join CBHI indepen-dently from each other.
The findings of the study revealed that the household’s decision to join the scheme34 is significantly influenced by
factors such as the caste of the household, its income (proxy MPCE quintile it belongs to), resource-pooling practices within the household, and to a lesser extent age distribu-tion in the household and educadistribu-tion status of the household head. However, these factors cannot fully explain the prob-abilities of a household joining the scheme as the predicted proportion of SHG members joining, calculated based on household characteristics, was significantly different from the observed proportion for most groups. This indicated that the decision whether or not to join CBHI was influenced by factors other than household level characteristics. There-fore, we reject the null hypothesis. Based on the study by Manski,39 we ascribe the household decision to influences
of the group and to local characteristics, which we term as the “social effect”.
Dror and Firth12 identified several theoretical
inadequa-cies to the explanations of demand for health insurance based on individual exogenous variables (such as age, gender, education, occupation, and other socioeconomic characteristics) when these are applied to the informal sec-tor. They contended that the expected utility theory does not take account of the effect of information asymmetry. Furthermore, they argued in their seminal paper that the demand for insurance in the informal sector is a collective decision of informal groups to which people belong. Indeed, it is not very difficult to see that for an intricate product as insurance, most people would tend to seek an opinion from
their peers either when they have no information (when insurance is not sold at all) or to lend more credibility to information when obtained from peers than when dissemi-nated by commissioned insurance agents (in the rare cases that agents come to villages to sell health insurance). This is all the more relevant in the case of CBHI, where the com-munity plays a major role in designing the benefits package and in governing the scheme. Peer influence on information dissemination and demand generation has been studied by several other authors,24,39–41 who concluded that peer effects
(including information sharing within peer groups) posi-tively and significantly influence program participation and scheme utilization. These analyses support the assertion of Dror and Firth.12 Furthermore, Dror et al42 have shown that
voluntary and contributory CBHI for members of SHGs relied on an engaging experience of the members with peers to validate perceived priorities of the target group and that, moreover, the strongest motive for choice (more than price or package-composition) was the wish to join a consensus and the intention that many members should benefit. As they also showed that the degree of consensus improved with iterative discussions among the members, we now seek to explain what issues influence the level of consensus within a group on joining an insurance scheme.
To that effect, we built a model to explain other influ-ences on individual decision-making when the process is undertaken by groups rather than by individuals in isolation from peers. We examined variables that remain constant at the group level, such as access to health care facilities, the average socio-demographic profile of the groups, and other village-level characteristics (Table 3). That model identified Table 5 Reason to enroll/not-enroll in cBHi – percentage distribution of responses by broad categories during FgDs
Categories Pratapgarh Kanpur Dehat Vaishali
Enrolled
group decision 34.4 25.0 30.7
Trust factor/ngO suggested 25.0 10.7 12.0
ability to pay 15.6 28.6 17.3
Benefit package understanding 0.0 0.0 5.3
Financial protection 18.8 7.1 20.0
Benefit of local doctors and medicine (low cost high frequency) 6.3 28.6 14.7
Non-enrolled
ability to pay 38.1 36.8 37.5
Financial liquidity 0.0 0.0 6.3
group decision 38.1 21.1 25.0
Trust factor 4.8 0.0 16.7
Household decision 9.5 10.5 6.3
Quality of care 9.5 31.6 8.3
Abbreviations: cBHi, community-based Health insurance; FgDs, focus group discussions; ngO, non-governmental organization.
Risk Management and Healthcare Policy downloaded from https://www.dovepress.com/ by 118.70.13.36 on 27-Aug-2020
Dovepress consensus-driven demand for MHi
only one factor that strengthens the propensity to join – better access to health care facilities – but when its adjusted
R-square values are considered, this factor did not infer a
major improvement.
We then examined qualitative variables capturing opinions and views of the respondents on various aspects of the insurance scheme. As explained in the “Methods” section, we constructed a consensus coefficient (a tweak of the CUA)37,38 in which 1 signifies full consensus and 0
no consensus at all (full variance). We added the consensus coefficient as an independent variable of the linear regression model estimating the proportion of members who joined the schemes so that we could assess the effect of the percep-tion about pricing, trust in the institupercep-tions, the likelihood of adverse health events occurring in the household, and so on. We now observed a substantial increase in the adjusted
R-square values of the model (Table 4), indicating improved
goodness-of-fit in each of the three locations separately and in the data for all three schemes combined. The findings included the following:
1. Consensus on “perceptions about the pricing” of the product emerged significant in two of the three locations separately and in combined data for the three locations (CC-CBHI increases by 25% in Kanpur Dehat [P=0.051], 53% in Vaishali [P=0.006], and 28% overall [P=0.002] for one-unit change in consensus on the price of insurance). 2. Consensus on the “likelihood that the household would
experience adverse health events” was significant in all three locations separately and in the combined dataset (increase in CC-CBHI is 44% [P=0.009], 59% [P=0.022], 43% [P=0.052], and 34% [P=0.001] for Pratapgarh, Kan-pur Dehat, Vaishali, and pooled sample, respectively). 3. Consensus on the “parameters for choosing an inpatient
health care facility” emerged significantly in one location (increase in CC-CBHI is 41%, P=0.044) and also in the three locations combined (increase in CC-CBHI is 16%,
P=0.096).
4. Consensus on the “perceptions about the quality of service at the nearest inpatient” health care facility emerged sig-nificantly for one location (increase in CC-CBHI=70%,
P=0.032).
5. Consensus on the “perceptions about the quality and availability of medical supplies” in the “nearest outpa-tient health care” facility emerged significantly for the combined dataset (increase in CC-CBHI=30%, P=0.022). 6. Consensus on the “perceptions about the quality and
availability of medical supplies received” from the
“near-est pharmacy” was significant for one location (decrease in CC-CBHI=45%, P=0.070) and the combined dataset (decrease in CC-CBHI=28%, P=0.028).
These results bring to the fore two aspects of the effect of consensus on catalyzing demand for health insurance. First, the process through which the groups reached con-sensus reduced information asymmetry by supplementing perceptions based only on individual experience with the experiences and perceptions of other trusted peers. The focus was to reach a collective decision, based on the col-lective perception of welfare gains to many members of the group. Second, the topics that influenced the groups’ decisions to join the insurance were mainly qualitative about the likelihood to experience certain cost-generating health events and about the collective perception of the quality of care.
It is self-explanatory why an individual in isolation from other people deciding whether or not to join cannot be informed about the collective qualitative evaluations of exposure to risk or the quality of care she/he might expect when seeking care. Nor can a single individual deciding in isolation get a sense of the considerations that the entire ref-erence group shares in defending the interests of the group. A solo decision-maker is thus deprived of information on the issues that were most instrumental in catalyzing demand for insurance. Such information cannot be provided by an insurance agent or any other person outside the group, who is neither informed about these things nor motivated to seek and share such information at the village level.
Limitation
For the quantitative methods, the small sample size that was used for the consensus analysis (total of 141), particularly at the locational level, limits the generalizability of these findings. At the same time, one of the team members who facilitated the FGDs was from the implementing NGOs and thus very familiar with the participants. This familiarity with the group was an advantage as it sets the participants at ease to share their experiences. We recognize that the familiarity could also have been a barrier to get the non-enrolled par-ticipants to participate fully.
Conclusion
The redeeming message of these insights is that persons in the informal sector, in settings of poverty and informality, would seek voluntary health insurance when they could par-ticipate with their peers in formulating collective perceptions
Risk Management and Healthcare Policy downloaded from https://www.dovepress.com/ by 118.70.13.36 on 27-Aug-2020
Dovepress Dror et al
of (qualitative) welfare gains. These collective perceptions are context-dependent and cannot be divorced from the specific conditions applying in each location, such as the local evaluation of service quality of health care provid-ers. These conditions are fundamentally different from an individual measure of utility gains. The postulate proposed by Dror and Firth12 is thus upheld.
The policy ramifications of this new evidence are that success in catalyzing voluntary and contributory demand for health insurance in the informal sector is contingent on facilitating group dialog within targeted communities, with the view to reaching consensus on collective perceptions of their exposure to risks, perceptions of the quality of care they might expect, the fairness of the price, and more generally a collective assessment of the welfare gains that the group can expect from being insured.
Acknowledgments
The authors gratefully acknowledge funding to collect the data used provided by European Commission seventh Framework Program; grant ID HEALTH-F2-2009-223518 – Community-based Health Insurance in India. The authors thank Dr Nihar Jangle for his inputs in conceptualizing the analysis methods for this study and Chandan Kumar for his inputs in data analysis at the initial stage. The authors gratefully acknowledge the extensive and substantive con-tribution of the Micro Insurance Academy and its staff in data collection and cleaning, as well as in analytical inputs, and the implementing partners (BAIF, Shramik Bharti, and Nidan) as well as the respondents for their willingness to share information.
Author contributions
All authors contributed toward data analysis, drafting and critically revising the paper and agree to be accountable for all aspects of the work.
Disclosure
The authors report no conflicts of interest in this work.
References
1. WHO [webpage on the Internet]. Health Systems Financing: The Path to Universal Coverage – The World Health Report 2010. Geneva, Switzerland: World Health Organization; 2010. Available from: http:// www.who.int/whr/2010/en/. Accessed August 2, 2018.
2. Prinja S, Kaur M, Kumar R. Universal health insurance in India: ensuring equity, efficiency, and quality. Indian J Community Med. 2012;37(3):142–149.
3. Jain N. Role of Government-Funded and Community-Based Health Insurance Schemes in Moving toward Universal Health Coverage in India. Bethesda, MD: Abt Associates Inc; 2017.
4. International Institute of Population Studies. National Family Health Survey 4: India Fact Sheet; 2017. Available from: http://rchiips.org/ nfhs/pdf/NFHS4/India.pdf. Accessed April 24, 2017.
5. WHO. Global Health Expenditure Database; 2016. Available from: http://apps.who.int/nha/database/Country_Profile/Index/en. Accessed April 24, 2017.
6. Binnendijk E, Koren R, Dror DM. Hardship financing of healthcare among rural poor in Orissa, India. BMC Health Serv Res. 2012;12(1):23. 7. Bhandari L, Berman P, Ahuja R. The Impoverishing Effect of Healthcare Payments in India: New Methodology and Findings. Econ Polit Wkly. 2010;45(16):65–71.
8. Garg CC, Karan AK. Reducing out-of-pocket expenditures to reduce poverty: a disaggregated analysis at rural-urban and state level in India. Health Policy Plan. 2009;24(2):116–128.
9. Hooda SK. Out-of-pocket Payments for Healthcare in India: Who Have Affected the Most and Why? J Health Manag. 2017;19(1):1–15. 10. Dhanaraj S. Economic vulnerability to health shocks and coping
strategies: evidence from Andhra Pradesh, India. Health Policy Plan. 2016;31(6):czv127–758.
11. Philip N, Srinivasan K. Utilization of comprehensive health insurance scheme, Kerala: a comparative study of insured and uninsured BPL households. BMC Proc. 2012;6(Suppl 5):P10.
12. Dror DM, Firth LA. The demand for (micro) health insurance in the infor-mal sector. Geneva Pap Risk Insur – Issues Pract. 2014;39(4):693–711. 13. Friedman M, Savage LJ. The utility analysis of choices involving risk.
J Polit Econ. 1948;56(4):279–304.
14. Kahneman D, Tversky A. Prospect theory: an analysis of decision under risk. Econometrica. 1979;47(2):263–291.
15. Dror DM, Jacquier C. Micro-insurance: extending health insurance to the excluded. Int Soc Secur Rev. 1999;52(1):71–97.
16. ILO/STEP-GIZ. The Role of Micro-Insurance as a Tool to Face Risks in the Context of Social Protection. Geneva, Switzerland: International Labour Organization. Available from: http://www.ilo.org/wcmsp5/ groups/public/---ed_protect/---soc_sec/documents/instructionalmate-rial/wcms_secsoc_93.pdf. Accessed on December 24, 2017. 17. UNDP. Building Security for the Poor: Potential and Prospects for
Microinsurance in India. Colombo, Sri Lanka: United Nations Devel-opment Programme; 2009. Available from: http://www.asia-pacific. undp.org/content/rbap/en/home/library/human_development/building-security-for-the-poor-2nd-edition.html. Accessed December 24, 2017. 18. Dror DM, Hossain SA, Majumdar A, Pérez Koehlmoos TL, John D,
Panda PK. What factors affect voluntary uptake of community-based health insurance schemes in low- and middle-income countries? A systematic review and meta-analysis. PLoS One. 2016;11(8):e0160479. 19. Jakab M, Krishnan C. Community Involvement in Health Care Financ-ing: A Survey of the Literature on the Impact, Strengths and Weak-nesses; 2001. Available from: https://openknowledge.worldbank.org/ handle/10986/13706. Accessed April 26, 2017.
20. Preker AS, Carrin G, Dror D, Jakab M, Hsiao W, Arhin-Tenkorang D. Effectiveness of community health financing in meeting the cost of illness. Bull World Health Organ. 2002;80(2):143–150.
21. Ekman B. Community-based health insurance in low-income countries: a systematic review of the evidence. Health Policy Plan. 2004;19(5):249–270.
22. Acharya A, Vellakkal S, Taylor F, et al. The Impact of Health Insurance Schemes for the Informal Sector in Low- and Middle-Income Countries: A Systematic Review. World Bank Res Obs. 2013;28(2):236–266. 23. Beiseitov E, Kubik JD, Moran JR. Social Interactions and the Health
Insurance Choices of the Elderly: Evidence from the Health and Retire-ment Study. Rochester, NY: Social Science Research Network; 2004.
Available from: https://papers.ssrn.com/abstract=1809901. Accessed
January 11, 2018.
24. Chatterjee C, Joshi R, Sood N, Boregowda P. Government health insur-ance and spatial peer effects: New evidence from India. Soc Sci Med. 2018;196(Suppl C):131–141.
25. Mladovsky P, Mossialos E. A conceptual framework for community-based health insurance in low-income countries: social capital and economic development. World Dev. 2008;36(4):590–607.
Risk Management and Healthcare Policy downloaded from https://www.dovepress.com/ by 118.70.13.36 on 27-Aug-2020