INTRODUCTION
Medak District with an area of 9702 km2
is located at 17°3’N Latitude and 78°15’ longitude on the North-Eastern part of Andhra Pradesh state in India. It is located on the banks of river Manjera. This area was predominantly an agricultural land. . The Patancheru Industrial Estate was set up in 1975 as part of Govt’s initiative to bring in more industries and to industrialize the backward areas in the State of Andhra Pradesh, India. As a result the Medak has been transformed into Industrial belt.
www.orientjchem.org
CODEN: OJCHEG 2011, Vol. 27, No. (4): Pg. 1679-1684 Est. 1984
An International Open Free Access, Peer Reviewed Research Journal
Assessment of Surface Water and Ground Water Quality
of Industrial Areas in Medak, Andhra Pradesh, (India)
MUSHTAQ HUSSAIN
1, T.V.D. PRASAD RAO
2,
HASHMATH ALI KHAN
3and M. SATYANARAYANAN
41Department of Chemistry, Deccan College of Engineering and Technology, Hyderabad (India).
2Department of Chemistry, Osmania University, Hyderabad (India).
3Asst. Professor, Deccan College of Engineering and Technology, Hyderabad (India).
4National Geophysical Research Institute, Uppal Road Hyderabad (India).
(Received: August 30, 2011; Accepted: October 04, 2011)
ABSTRACT
A study was conducted for the analysis of pollution load in surface water and ground water at Kazipally IDA, Gaddapotheram IDA, and Bollaram IDA during the rainy season. Samples were analyzed for various physical and chemical parameters like pH, EC, TDS, Nitrates, Phosphates, Flourides, Sodium, Potassium, Calcium and magnesium. The heavy metals such as Fe, Mn, Ni, Zn and Cd were analysed. All the results were compared with US-EPA and WHO standands and it was found that surface water and ground water are highly polluted and they are neither fit for irrigation nor safe for drinking purposes.
Key words: Assessment, Industrial effluent, Medak, A.P., Physical and Chemical parameters.
Subsequently numerous Industries were established at Kazipally, Gaddapotharam and Bolaram and other places in Medak District.
Industrial effluents are discharged into water bodies containing toxic chemicals (i.e., inorganic, organic and synthetic chemicals) from various industries. The toxicity of various pollutants contaminate the water bodies and they poison the aquatic life. Synthetic chemicals are released by industries, but they never produced in nature. Many of these chemicals are so stable that they cannot be break down by the existing common effluent treatment plants.
Ponds, Tanks, lakes, Streams and Rivers are the natural sources for all kinds of chemical reactions. In the presence of sunlight, wind, convention currents of water and the potential energy of the stream will mix and stir the water of the water bodies. It is also alarming that most of the industries discharging large quantities of industrial effluents directly into water bodies resulting in serious pollution. This loss of water quality is causing health hazards, death of aquatic lives and crop failures.
This problem is aggravated by lack of awareness, lack of wastewater treatment facilities, lack of financial resources and insufficient environmental laws.
The objective of this study was therefore to assess the extent of chemical pollution in receiving water bodies and ground water, which are affected by industrial effluent discharged therein.
Present studies were carried out at Kazipally IDA, Gaddapotheram IDA, Bolaram IDA. The industries of Kazipally IDA, Gaddapotheram IDA are discharging their effluents into Kazipally lake. From Kazipally lake, the water drained into Gandigudem lake and polluting the water in the down stream natural bodies such as Kistareddy pet lake, Asanikunta pond, , palma vagu, Peddavagu Stream all the way upto river Manjera.
MATERIAL AND METHODS
Samples were collected from Kazipally Lake, Gandigudam Lake, Asanikunta Pond, kistareddypet Lake, palma vagu stream,
Pedda Vagu stream and ground water samples from the areas surrounding. Samples were collected in clean and dry plastic bottles in such a way that no bubbles were formed in bottles. After collection, the samples were analyzed for all physical and chemical parameters. All the analytical work was carried out in chemistry Lab National Geo-physical Research Institute (Ngri), Hyderabad.
Chemical Analysis
pH was measured using a Systronics pH digital meter, Electrical conductivity by conductivity meter and TDS by TDS meter 308. Na and K were determined by using flame photometer. Chlorides, Sulphates, nitrates, Phosphates, Flourides were determined by using Ion-Chromatograph. Ca, Mg and total hardness by titri-metric method. Zn, Fe, Cd, Ni, Mn were analysed by F–AAS (Flame- Atomic absorption spectrophotometer) by using specific cathode lamp.
Goaddapotharam
ID A
Kazipaly IDA
Kazipally Lake
Gandigudem
Lake
Asani Kunta Pond
Kistareddy lake
River Manjeera
F–AAS was calibrated for each element using standard solution of known concentration, before sample injection (APHA 1992).
RESULTS AND DISCUSSION
The pH of the surface water of water bodies and ground water found to be in the range of 6.98 to 7.89. The pH of all the of surface water and ground water are with in the permissible limits of US-EPA and WHO standards (6.0-8.5).
Electrical condutivity of water is a measure of total dissolved solids, is one of the most important water quality parameters, which effects the water intake of the crops. The electrical conductivity of water is less than 1.5 mS/cm then water is considered to be safe and more than 1.5 mS/cm is not safe for crops it may create salinity/ alkalinity problems in the soil in due course. However, the conductivity is more than 2.25 mS/cm the water is considered to be dangerous for crops.
The EC is found to be in the range of 5.0 – 10.6 mS/cm for lakes. The EC of Kazipally lake is found to be 7.0 mS/cm. The high value of EC for Kazipally lake may be due to direct discharging of effluents from industries of Kazipally IDA and Gaddapotharam IDA into lake. The EC of Gandigudam lake is 5.0 mS/cm. The low value for Gandigudam lake is due to fact that it is not receiving effluents directly from the industries. EC is found to be highest in Asanikunta i.e 10.1ms/cm. This is due to the inflow of effluents from Gandigudam lake and also from Bolaram Industries. The EC for Kistareddy pet lake , Pedda Vagu Stream, palma Vagu Stream was found to be 5.8 ms/cm,10.6 ms/ cm , 8.2 ms/cm respectively.
Na is found to be in the range of 563-931 mg/L for lakes and 287-834 mg/L for ground water. Upto moderate concentration of Na there is no adverse impact, but high concentration may effect the soil structure as well as permeability resulting in alkaline salts and becomes toxic to plants. For both surface and ground water having Na concentration above permissible limit of 20 mg/L (US-EPA).
K is found to in the range from 26-170 mg/
L for lakes and 32-76.1 mg/L for ground water. Potassium is not known for harmful or toxic effect on human health but it helps in plant growth as an essential nutrient.
Ca is found to be in the range from 205-487mg/L for lakes and 122-230 mg/L for ground water. Ca has no hazardous effect on human health, infact; it is one of the most important nutrients required by the organism. Calcium can also aid in maintaining the structure of plant cells and soils.
Magnesium is found to be in the range of 87-201 mg/L for lakes and 87-134 mg/L for ground water. Magnesium is regarded as non-toxic to human health.
Chloride is found to have range from 350-1500 mg/L for lakes, which is above the permissible limit of 250mg/L as per US-EPA. The lowest value found in chinna vagu stream (350 mg/L) and the highest value in Asanikunta Pond (1500 mg/L). If chloride is more than 250 mg/L in water it is unfit for both irrigation and drinking purposes. Chloride increases the electrical conductivity of water and thus increases its corrosivity. In metal pipes, chloride reacts with metal ions to form soluble salts thus increasing levels of metals in water. In Pb pipes, a protective oxide layer is built up, but chloride enhances the galvamic corrosion. It can also increase the rate of pitting corrosion of metal pipes.
The chloride is found to be in the range of 300 - 500 mg/L for ground water, which is above the permissible limits. Sulphate ranged from 100-250 mg/L for lakes and in the range of 300 - 500 mg/L for ground water. Both surface water and ground water are having sulphate concentration above the permissible limit of 150 mg/L as per US-EPA.
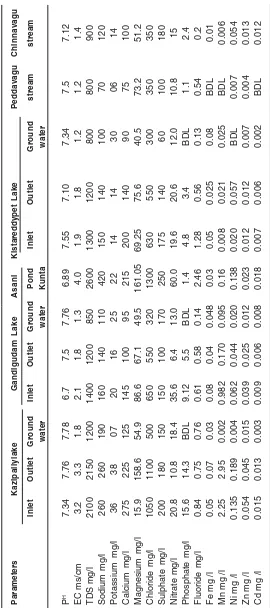
T
a
b
le 1:
Results of the ph
ysico-c
hemical c
haracterisation of surface water and gr
ound water Parameters Kazipallylake Gandigudam Lake Asani Kistareddypet Lake Peddavagu Chinnavagu Inlet Outlet Ground Inlet Outlet Ground Pond Inlet Outlet Ground stream stream water water K u n ta water P H 7.34 7.76 7.78 6 .7 7 .5 7.76 6.89 7.55 7.10 7.34 7 .5 7.12 EC ms/cm 3 .2 3 .3 1 .8 2 .1 1 .8 1 .3 4 .0 1 .9 1 .8 1 .2 1 .2 1 .4 TDS mg/l 2 1 0 0 2 1 5 0 1 2 0 0 1400 1200 850 2600 1300 1200 800 800 900 Sodium mg/l 2 6 0 2 6 0 1 9 0 1 6 0 1 4 0 1 1 0 4 2 0 1 5 0 1 4 0 1 0 0 7 0 1 2 0 P
otassium mg/l
US-EPA and WHO standards for drinking water
Contaminants U.S.EPA WHO
(mg /L) (mg/L)
Color Colorless Colorless
Odor Odorless Odorless
Taste Tasteless Tasteless
Temperature - 12°C
PH 6.0 - 8.5 6.5 - 9.2
DO 4 - 6 3
TDS 500 500
TSS 0 - 5 5
CI- 250 200-500
Sulphates 250 200-400
Nitrate/Nitrite 100 45
Calcium 100 100
Magnesium 30 150
COD 4.0 10
Sodium 20 200
Potassium --12
E.C 300 400
Arsenic 0.05 0.05
Cadmium 0.01 0.05
Fluoride 2.2 1.5
Mercury 0.002 0.001
Iron 0.3 0.3
above 45 ppm may cause methamoglobinaemia in children. The toxicity of nitrate to human beings is mainly due to its reduction to nitrite. The major biological effect of nitrate in human beings is its involvement in the oxidation of normal Hb to met-Hb, which is unable to transport oxygen to the tissue. When met-Hb concentration reaches 10%
and above normal-Hb concentration, the condition is called methamoglobinaemia. The nitrate was found to be in the range from 10.89 - 60 Mg/L for lakes. It is above the permissible limits of 45 mg/L in Asanikunta (60 mg/L) and it ranges from 12 -18.4 mg/L for ground water, which is within the permissible limits. Phosphate is found to be between 1.1. mg/L - 15.6 mg/L. It is found to be lowest in Peddavagu stream (1.1. mg/L) and highest in Kazipally lake (15.6 mg/L). The phosphate concentration is below detectable level in ground water.
Fluoride was found to be in the range of 0.2 - 2.46 mg/L for lakes and It ranges from 0.13 to 0.76 mg/L for ground water. Except asanikunta lake (2.46mg/L), all other lakes are having fluoride concentration within permissible limit of 1.5mg/L (WHO), but flouride is within limits for ground water. Fluoride can have adverse effect on tooth enamel and may give rise to mild dental flourosis at a concentration between 0.9 to 1.2 mg/Litre (Dean, 1942)
The concentration range of individual heavy metals found to be Fe (0.1 - 0.8 mg/L) Mn (0.006 - 2.95), Ni (0.007 - 0.189) Zn (0.004 - 0.054 mg/L) Cd (0.006 - 6.015 Mg/L). The concentration of heavy metal found to be high In Kazipally lake. The low concentration levels of metals determined in other lakes could be ascribed to dilution, sedimentation and depuration. Slow flow conditions enhance sedimentation, especially in the presence of high levels of iron and manganese in the system as observed from the analysis of sediments (Okoye Metals in lakes
Metal Max Kazipally lake Gandigudam Asani Kistareddy Chinna Pedda
Limit lake kunta lake Vagu Vagu
US-EPA stream stream
mg/L Inlet Outlet Inlet Outlet Inlet outlet
Fe (mg/L) 0.1 0.05 0.07 0.08 0.04 0.03 0.05 0.025 BDL 0.01
Mn (mg/L) 0.05 2.25 2.95 0.982 0.170 0.16 0.008 0.021 BDL 0.006
Ni (mg/L) 1 0.135 0.189 0.062 0.044 0.138 0.02 0.057 0.007 0.054
Zn (mg/L) 5.0 0.054 0.045 0.039 0.025 0.023 0.012 0.012 0.004 0.0134
etal, 1989). This sedimentation would likely becomes the more important mechanism for removing heavy metals and other pollutants from the water thus the cumulative impact is that heavy metal levels are kept low inspite high fluxes from industrial wastes.
The study has shown that the effluents from the industries have huge impact on the water quality of receiving lakes. Although, the values in some cases were lower than the allowable limits, the continued discharge of the effluents in the lakes may result in severe accumulation of the contaminants, which inturn effect the lives of the people. The following conclusions may be arrived at, based on the study.
´ The industrial effluents had severely polluted
the lakes especially Kazipally lake, Asanikunta pond.
´ The ground water is not fit for drinking in
many areas around the lakes.
´ The surface and ground water is not safe for
irrigation.
´ The lakes are degraded in its quality due to
excessive input of industrial effluent from the industries.
´ The lakes had turned to Eutrophic.
The following steps should be taken for proper treatment of industrial effluents before discharging into water bodies
´ Govt. has to take necessary steps to monitor
the treatment of industrial effluents periodically by industries.
ˇ Kazipally lake, Asanikunta pond, kistareddy
pet lake, which are identified as highly effected by toxic industrial discharges and for which remedial steps should be taken immediately.
´ All the contaminated lakes must be treated
immediately.
REFERENCES
1. APHA, Standard methods of water and
wastewater examination. American Public Health Association, USA (1992).
2. Richard, LA, Diagnoses and improvement
of Saline and Alkali Soils. Agriculture Hand Book 60 USDA, USA (1954).
3. Boyd CE, Water quality in Ponds, Birmingham
Publishing Co. UK (1990).
4. O. Phiri, P. Mumba, B.H.Z. Moyo and W.
Kadewa., Assessment of the impact of industrial effluent on water quality of receiving rivers in urban areas of Malawi. Int. J. Environ. Sci Tech. 2(3):PP 237-244 (2005).
5. Nasrullah, Rafia Naz, Hamida Bibi,
Mudassar Iqbal and M. Ilyas Durrani, Pollution in industrial effluent and ground water of Gadoon Amazai Industrial Estate. Journal of Agricultural and biological science 1(3): pp 18-24 (2006).
6. Manivasakam N. (1996) Physico-Chemical
Examination of Water, Sewage and Industrial Effluent, Meerut (India).
7. Tirvedy R.K. and Goel P.K. (1986) Chemical
and Biological Methods for water pollution studies. Environmental publications Karad India.
8. Premlata Vikal and Sandhya Tyagi (2007)
Assessment of water quality of lake Pichhola before and after rains in Arjun, Udaipur, Rajasthan Poll. Res. 26(2): 249-252 (2007) Environ media.
9. Ch. Srinivas, Ravi Shankar Piska, C.
Venkateshwar M.S. Satyanarayan Rao and R. Ravindra Reddy, Studies on ground water quality of Hyderabad. Poll. Res. 19(2): 285-289 (2000).
10. Gupta M.K. Vibha Singhs, Poonam