RVC OPEN ACCESS REPOSITORY – COPYRIGHT NOTICE
This is the peer reviewed version of the following article:
Houssaye, A., Waskow, K., Hayashi, S., Cornette, R., Lee, A. H. and Hutchinson, J. R. (2016) 'Biomechanical evolution of solid bones in large animals: a microanatomical investigation', Biological Journal of the Linnean Society, 117(2), 350-371.
which has been published in final form at http://dx.doi.org/10.1111/bij.12660.
This article may be used for non-commercial purposes in accordance with Wiley Terms and Conditions for Self-Archiving.
The full details of the published version of the article are as follows:
TITLE: Biomechanical evolution of solid bones in large animals: a microanatomical investigation
AUTHORS: Alexandra Houssaye, Katja Waskow, Shoji Hayashi, Raphaël Cornette, Andrew H. Lee, John R. Hutchinson
JOURNAL TITLE: Biological Journal of the Linnean Society PUBLISHER: Linnean Society of London / Wiley
Solid bones in large animals: a microanatomical investigation
Alexandra Houssaye1,*
* Corresponding author
Email: [email protected]
Katja Waskow2
Email: [email protected]
Shoji Hayashi3
Email: [email protected]
Raphaël Cornette4
Email: [email protected]
Andrew H. Lee5
Email: [email protected]
John R. Hutchinson6
Email: [email protected]
1UMR 7179 CNRS/Muséum National d'Histoire Naturelle, Département Ecologie et Gestion
de la Biodiversité, 57 rue Cuvier CP-55, 75000 Paris, France
2Steinmann Institut für Geologie, Mineralogie und Paläontologie, Universität Bonn,
Nussallee 8, 53115 Bonn, Germany
3Osaka Museum of Natural History, Higashi-sumiyoshi-ku, Osaka, 546-0034, Japan
4UMR CNRS/MNHN/UPMC/EPHE 7205, Institut de Systématique, Evolution, Biodiversité
(ISYEB), Muséum National d'Histoire Naturelle,45 rue Buffon, 75005 Paris, France
5Department of Anatomy, Midwestern University, 19555 N 59th Avenue, Glendale, AZ 85308,
USA
6Department of Comparative Biomedical Sciences, Structure and Motion Laboratory, The
Abstract
Background
Graviportal taxa show an allometric increase of the cross-sectional areas of supportive bones
and are assumed to display microanatomical changes associated with an increase in bone
mass, presumably to offer greater resistance to loads produced by their gigantic size. This
evokes osteosclerosis, i.e., an increase in bone compactness, that is also observed in some
aquatic amniotes. This study investigates the changes in bones’ inner structure associated with
graviportality and how comparable they are with aquatically acquired osteosclerosis in order
to better understand the adaptation of bone to the different functional requirements associated
with graviportality in giant tetrapods, and with buoyancy and body trim control in secondarily
aquatic tetrapods.
Results
This microanatomical and cross-sectional investigation of long bones and ribs of graviportal
and other related tetrapod taxa shows changes of inner structure that are not solely attributable
to allometry. Bones of graviportal taxa display a thicker cortex and a proportionally smaller
medullary cavity, with a wider transition zone between these domains. This inner cancellous
structure may enable better impact energy absorption and marrow support. Moreover, the
cross-sectional geometric parameters indicate increased resistance to stresses engendered by
bending and torsion as well as compression.
Conclusions
Although not all graviportal taxa converge on the same inner organization of their bones, a
clear general pattern is evident across graviportal tetrapods. The increase in bone mass,
although it might be mistaken with aquatically related osteosclerosis, is nevertheless more
restricted than the osseous specialization observed in some shallow water swimmers or
bottom-walkers among almost exclusively aquatic amniotes. Adaptation to a graviportal
posture should thus be taken into consideration when analysing possibly amphibious taxa with
a terrestrial-like morphology. This consideration is particularly important for paleoecological
inferences about large extinct tetrapods that might have been amphibious and, more generally,
Keywords
Graviportality, Stylopod, Ribs, Bone mass increase, Osteosclerosis, Gigantism, Amphibious
adaptation
Background
Animals with extremely large body masses and with massive pillar-like limbs adapted to
support their weight are said to be graviportal [1, 2]. Their typically columnar limbs help to
resist bending and torsional loads generated by flexion and rotation of the limbs during
locomotion [3–5]. They also display proportionally much longer stylopodial elements
(humerus, femur), relatively to the more proximal zeugopodials and autopodials, and,
especially, limb bones of much larger diameter. These larger bones result from allometric
changes that help them to resist gravity [2, 6, 7], because body mass (and thus gravitational
loading) tends to increase by a factor of eight when body length proportionately increases by a
factor of two ([8]; p. 43).
The allometric increase of the cross-sectional areas of supportive bones is a
well-known characteristic of graviportal vertebrates [9]. However, further adaptations at the
microstructural scale may occur -- for example, Doube et al. ([10]) showed how the trabecular
mesh of larger species becomes more robust across a wide range of lineages of terrestrial
tetrapods. Oxnard [11, 12] posited that there may be a general trend in some graviportal
tetrapods to fill in the marrow cavities of the long bones in order to not only resist
compressive loads from gravity but also to help absorb more kinetic energy when the feet
impact the ground (see Warner et al., 2012), avoiding “crushing fractures”, as well as to
provide scaffolding to support the heavy bone marrow itself.
Graviportal long bones and ribs are thus considered more massive than in other
terrestrial taxa ([2, 13]) and should show an increase in bone mass at the microanatomical
scale. The aforementioned increase in bone mass in graviportal land animals may be
analogous to osteosclerosis observed in comparable bones of aquatic amniotes. These
secondarily aquatic tetrapods are generally shallow water swimmers relying on a hydrostatic
control of buoyancy and body trim (see [14]). Thus, ironically, the increased compactness of
appropriate buoyancy and balance in water, a low-gravity environment, as compared to land;
and (2) improve resistance to gravity, enabling the limits of body size in terrestrial tetrapods
to be pushed to greater extremes (e.g., Hokkanen, REF). Indeed, Wall [15] already observed
that some graviportal taxa seem to show an increase in bone deposition, so that they can be
mistaken for aquatic taxa, especially bottom-walkers. In mustelids, the observation of high
density in the bones of wolverines seems more associated with their increased body mass than
with aquatic habits [16]. Moreover, the high compactness in the ribs of rhinoceroses [17] also
illustrates this trend, in combination with varying aquatic habits in extant and extinct
rhinocerotoids (Prothero, 1992; [18]REFS).
Here, we investigate microanatomical and cross-sectional specializations in the bones
of graviportal and other related tetrapod taxa with both qualitative and quantitative methods,
and in a phylogenetic context because microanatomical structures can show phylogenetic
signal [19]. We first seek to evaluate the bone microanatomical changes observable in
graviportal taxa and to determine how comparable this pattern is to the specialization
observed in aquatic amniotes. We then synthesize our comparative results in order to better
understand the adaptation of bone to the different functional requirements associated with
graviportality in giant tetrapods, and notably focus on how the resulting patterns in graviportal
taxa may sometimes be similar to changes associated with buoyancy and body trim control in
secondarily aquatic tetrapods.
Institutional abbreviations
AMP: Ashoro Museum of Paleontology, Hokkaido, Japan; BYU: Brigham Young University,
Utah, USA; CMC: Cincinnati Museum Center, Ohio, USA; FMNH: Field Museum of Natural
History, Chicago, Illinois, USA; HMNS: Hayashibara Museum of Natural Sciences,
Okayama, Japan; JRHRVC: uncatalogued research collection of John R. Hutchinson at The
Royal Veterinary College, Hatfield, United Kingdom; MDE: Musée des Dinosaures,
Espéraza, France; MNHN: Museum national d’Histoire naturelle, Paris, France; MPC:
Mongolian Paleontological Center, Ulaanbaatar, Mongolia; NHMUK: Natural History
Museum, London, United Kingdom; NMB: Naturhistorisches Museum Basel, Switzerland;
NMW: National Museum of Vienna, Austria; NSM: National Science museum, Tokyo, Japan;
OMNH: Sam Noble Oklahoma Museum of Natural History, USA; OMNH*: Osaka Museum
of Natural History, Osaka, Japan; PIMUZ: Paläontologisches Institut und Museum,
Universität Zürich, Switzerland; RTMP: Royal Tyrrell Museum of Palaeontology,
Universität Bonn, Germany; UCMP: University of California Museum of Paleontology, USA;
UFGK:Ur- und Frühgeschichte Köln, Köln, Germany; UMNH: Utah Museum of Natural
History, USA; UMZC: University Museum of Zoology, Cambridge, United Kingdom; YPM:
Yale Peabody Museum of Natural History, New Haven, Connecticut, USA; ZFMK:
Zoologisches Forschungsmuseum Alexander Koenig, Bonn, Germany; ZMZ, Zoologisches
Museum der Universität Zürich, Switzerland.
Results
Qualitative analysis
Humerus
Most taxa exhibit humeri showing the standard tubular structure for a tetrapod long bone; i.e.,
a layer of compact cortex surrounding a large open medullary cavity (Fig. 1A). The cortex is
thicker in the bipedal dinosaurs (the theropods Tarbosaurus, Allosaurus and the thyreophoran
Scutellosaurus) and in the nilgai (Boselaphus) and the African buffalo (Syncerus) than in most
tubular bones. The pygmy hippopotamus Choeropsis (which is only poorly amphibious; Wall
[15]) also displays a tubular bone organization without a particularly thick cortex (Fig. 1B).
The tapir shows a wide transition zone between the cortex and the open medullary cavity, and
the polar bear shows a thin cortex associated with a wide transition zone (as described in
[20]). The giant anteater (Myrmecophaga) displays a wide loose spongiosa with no open
medullary cavity; and the southern tamandua shows a similar organization but with a rather
small open medullary cavity. The peculiarity of the microanatomical features of these
Xenarthra taxa was already raised in Straehl et al. ([21]) and Amson et al. [22], matching
similar observations of other Xenarthra by Oxnard ([11, 12]).
Among the other taxa sampled, several types of inner organization are observable: 1)
absence of an open medullary cavity but a relatively wide medullary area occupied by a
spongiosa (higher number of, and thinner osseous trabeculae than in the two xenarthrans
above); in Hippopotamus (Fig. 1C), the sauropods Ampelosaurus (Fig. 1D) Apatosaurus and
the ceratopsian Centrosaurus (Fig. 1E); 2) a similar pattern but associated with a much thicker
cortex; in Ceratotherium (Fig. 1F), Rhinocerosunicornis (Fig. 1G) and R. sondaicus, the
specimen of Dicerorhinus; 3) a thick cortex and a narrow medullary cavity with only a few
thick trabeculae; in the extant proboscideans Elephas (Fig. 1H) and Loxodonta, the
rhinocerotids Dicerorhinus (one specimen), Diceros (Fig. 1I) and Diceratherium and the
ceratopsian Protoceratops. The latter (third) kind of inner bone organization was already
observed in the sirenian Trichechus [20] (Fig. 1J), whereas the two other relatively slow
swimmers sampled, the desmostylian Paleoparadoxia (Fig. 1K)and the sirenian Dugong
(Fig. 1L), display an extremely compact structure with no medullary cavity.
Femur
As observed for the humerus, most taxa display a tubular structure of the femoral midshaft
(Fig. 2A). There are substantial variations in the thickness of the cortex, being relatively
maximal in Syncerus (Fig. 2B) and Ursus thibetanus. In the giant anteater, the femur exhibits
a pattern similar to its humerus, whereas in the tamandua the femur shows a better defined
and larger open medullary cavity than its humerus. Most other taxa have a cortex with a
thickness similar to the maximum values observed in the taxa displaying a tubular structure,
but with a spongiosa occupying the whole medullary area; for example, in Ceratotherium,
Rhinoceros unicornis (Fig. 2C), Rhinoceros sondaicus (Fig. 2D) but also in the tapir. Similar
to pattern observed in the humerus, other taxa show a thick cortex and a medullary area
occupied by a medullary cavity with no or only a few thick trabeculae; in Elephas (Fig. 2E),
Loxodonta, Mammuthus (Fig. 2F), Hippopotamus (Fig. 2G) and Ceratotherium (one
specimen). Diceratherium shows an inner organization that is almost tubular, except that a
rather poorly extended transition zone between the cortex and the medullary cavity is
occupied by a spongiosa. Stegosaurus (Fig. 2H) shows a thick cortex and a reduced medullary
area with a small medullary cavity and a lightly built spongiosa.
Rib
In amniotes, there is a high diversity of rib internal morphologies, notably in the thickness of
the cortex and the number of infilling trabeculae, as already highlighted in Hayashi et al. [20].
This reflects a natural diversity but also relies on the difficulty of making homologous
comparisons with ribs, as bone microanatomical features are known to vary both along the rib
and between ribs along the ribcage (e.g., [23, 24]).
Typically in our sample, the ribs of quadrupedal taxa show a clear medullary area with
no or a few thick trabeculae (Fig. 3A-B). Weakly active swimmers are characterized by a
extremely high in all sirenians (Trichechus, Dugong and Halitherium; AH unpublished
observations) with an almost complete bone filling. Most dinosaurian taxa sampled, especially
graviportal thyreophorans (stegosaurs [Fig. 3D] and ankylosaurs) and sauropods (Fig. 3E-F),
but also bipedal taxa (Fig. 3G), display ribs with a thick cortex and no open medullary cavity,
but rather a dense spongiosa with reduced intertrabecular spaces in most taxa (Fig. 3D-E).
However, some dinosaur taxa present a thick cortex but a rather loose inner spongiosa (e.g.,
the sauropod Spinophorosaurus and the moderately large theropod Lourhinhanosaurus; Fig.
3F). The mammoth specimen and Rhinoceros (R. unicornis and R. sondaicus) show an
organization grossly similar to that of other large quadrupedal mammals, except that the
spongiosa is made of numerous rather thin trabeculae (Fig. 3H-I).
Quantitative analyses
The K statistics calculated are all much lower than 1 for all three bones analysed
(0.34<K<0.68 for the humerus, 0.37<K<0.55 for the femur, and 0.39<K<0.67 for the rib; see
Suppl. 1). However, randomization tests are unable to reject the possibility of a significant
phylogenetic signal in the data, except for C, S and CSS for the rib. This justifies the need to
account for the effects of phylogenetic pseudoreplication [23].
Linear regressions on the independent contrast data show that only J is affected by size
(MD) for the three bones, but not strongly. The other parameters show either no or a rather
weak impact of size, depending on the bones concerned (see Suppl. 1).
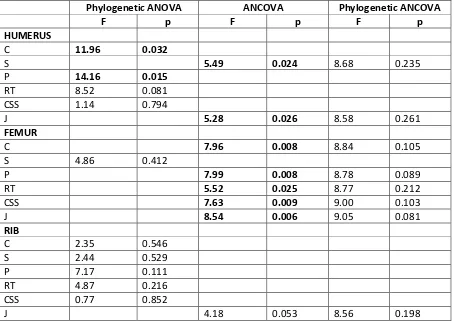
Analyses of variance show that only the parameters C and P for the humerus vary
significantly (Table 4) depending on the group number (1-4). Analyses of covariance all show
a significant signal when phylogeny is not taken into consideration (except the parameter J for
the rib), but lose this significance when phylogeny is incorporated (Table 4). Similarly, the
multivariate analyses of variance are significant for the humeri and the femora (F=2.83,
p=0.021 for the humeri; F=6.00, p<0.001 for the femora; F=1.99, p=0.12 for the ribs) but
become not significant when phylogeny is taken into consideration (F=5.41, p=0.284 for the
humeri; F=6.20, p=0.668 for the femora; F=2.77, p=0.730 for the ribs). Bone compactness is
greater in aquatic and graviportal (especially in the femur) taxa, which also show a wider
transition zone (high S; except in the ribs of the graviportal taxa). Bipedal taxa also display
compact ribs with a wide transition zone and a thicker cortex. Aquatic taxa have a more
This reduced medullary cavity and thicker cortex are also observed, but to a much lesser
extent, in graviportal taxa but only in long bones (especially in the femur), not in the ribs. The
cross-sectional shape index (CSS) evidences different signals depending on the bone sampled.
The polar second moment of area (J) reveals higher values for aquatic (for the humerus; lower
values in the ribs), graviportal and bipedal taxa.
Our PCA of bone microanatomy in the humerus shows that the two main axes explain
77.9% of the variance (58.5 and 19.4% respectively). This analysis demonstrates which
variables co-varied: P and R/t correlate inversely to C (compactness). The smaller medullary
cavity in aquatic and graviportal tetrapods is thus consistently associated with a relatively
thicker cortex and a higher compactness values (Fig. 4A). It is particularly interesting to note
that graviportal taxa group together (and with aquatic taxa), being essentially discriminated by
the first axis, whereas they are randomly distributed based on PC2 and PC3. Our
between-groups PCAs generally show for all bones that the first axis mainly discriminates based on
bone microanatomical features (C, S, P, R/t), and the second axis essentially based on bone
shape parameters (CSS and J; Fig. 4B,5B,6B). The between-groups PCA for the humerus
distinguishes the four groups, with aquatic taxa displaying the strongest compactness, thicker
cortex, smaller medullary cavity, and more rounded geometry (CSS closer to 1; as opposed to
quadrupedal taxa with CSS diverging from 1). Additionally, graviportal taxa, as opposed to
bipedal and aquatic ones, display (for obvious reasons of gravitational support) a higher polar
second moment of area (J) and larger transition zone between the cortex and medullary cavity
(Fig. 4B). The two main axes explain 95.0% of the variance (79.2 and 15.8%, respectively).
Our K-NN classifications indicate that 74.5% of specimens were well-classified and thus
show a clear and doubtless signal.
Similar to the humerus, our PCA analysis for the femur shows that the two main axes
explain 81.0% of the variance in our microanatomical data (64.7 and 16.3% respectively).
Similar co-variations are observable between C, P, and R/t. However CSS in this case vary
almost antagonistically to P and R/t. Again, graviportal taxa group together, being
discriminated based essentially on the first axis (Fig. 5A). The between-groups PCA for the
femur shows that graviportal taxa are distinct from the other quadrupedal and the bipedal taxa
in showing a much higher compactness, proportionally thicker cortex, and higher polar
second moment of area (Fig. 5B). Bipedal taxa differ from quadrupedal ones in showing a
higher polar second moment of area (J) and less rounded cross-sections (CSS further from 1).
The two main axes explain 100% of the variance, 95.8 and 4.2%, respectively, showing that
results for the humerus, we find from the K-NN classifications that we reliably assigned
69.8% of our specimens to groups a priori.
The PCA analysis for the ribs shows that the two main axes explain 67.6% of the
variance (50.6 and 17.0% respectively). In our rib sample, C still varies antagonistically to R/t
and P, and in a direction almost orthogonal to those of the polar second of moment area and
cross-sectional shape (Fig. 6A). Graviportal taxa continue to group together. However it is
interesting to note that the bipedal taxa are within the distribution area of the graviportal ones
and that the two aquatic taxa are much closer to the graviportal forms than to the other
terrestrial ones. For ribs, the first axis does not clearly distinguishes graviportal taxa since
aquatic and bipedal ones display in fact a much higher compactness, whereas graviportal taxa
display microanatomical features closer to those of the other terrestrial forms. The second axis
discriminates graviportal taxa from the other ones, notably based on the more rounded shape
of the cross-sections (in contrast to the increased eccentricity evident for the humerus and
femur; also see [24]) and higher polar second moment of area. These two main axes explain
97.4% of the variance, 68.1and 29.3%, respectively. For ribs, we obtained a relatively poor
result for the K-NN classifications: 46.2% of specimens as well-classified.
Comparisons between the classical and between-groups PCAs show that the same
parameters drive the distributions of data for both the mean representatives of the groups and
for all individuals.
Discussion
We found that only certain key microanatomical and cross-sectional traits distinguish how
humeri, femora and ribs of tetrapods change their shape and internal bone structure with
increasing graviportal or aquatic adaptations. In particular, the ribs show stronger changes of
compactness with aquatic habits than with graviportality. Otherwise, as we proposed in the
Introduction, there are remarkable qualitatively and quantitatively similar patterns in how
bones change their internal geometry with lifestyles as different as giant, graviportal land
animals vs. secondarily aquatic tetrapods, especially increasing bone compactness and
reduced medullary cavities along both evolutionary trajectories. As for bipedal taxa, they tend
to show a strong change in femoral cross-sectional area and an increased internal robustness
Phylogenetic signal
Our quantitative analyses show that there is a phylogenetic signal in the dataset for most
parameters, but that it is somewhat weak. Despite its relative weakness, when phylogeny is
taken into consideration, our analyses of (co)variance do not show any significant change
between the four groups defined. Although a historical signal is common in bone
cross-sectional geometry and microanatomical data, as previously mentioned (e.g. [25]), our
findings might also reflect the fact that adaptations to an aquatic lifestyle and to a graviportal
morphology occurred only infrequently in amniote evolution, so that the extant taxa showing
such adaptations form a few groups on the phylogeny. More thorough sampling of Tetrapoda
might show a different phylogenetic signal -- our dataset of <75 total species is far from
comprehensive. Our results, however, might still reveal the the occurrence of fundamental
trends of anatomical construction that transcend phylogenetic constraints.
Cross-sectional geometry versus microanatomical parameters
Various comparative studies have focused on long bone sections in order to analyse the link
between inner bone structure and the structural and functional requirements of extant
organisms and to make inferences about the lifestyle of extinct taxa (e.g., [26–29]). Of course,
individual bones-- let alone whole skeletons-- of extinct taxa are not always complete. Given
the fragmentary nature of fossil material, body size or mass is difficult to estimate precisely.
Our aim was to determine how similar the cross-sectional geometry of tetrapod bones is
across a continuum encompassing bipedal, quadrupedal, graviportal and aquatic forms with a
particular focus on graviportal taxa. In addition to the microanatomical parameters commonly
used, we included some cross-sectional geometry parameters. As linear regressions on the
independent contrast data showed a strong impact of body size (i.e., maximal diameter) on
parameters Per, CSA and Zpol, the latter were considered to display redundant information
and were removed from further analyses. However, the parameters J and CSS showed their
own patterns of variability and are of appreciable interest in such comparative studies (see
Table 4).
Our comparative analysis highlights different trends of bone adaptation to a
graviportal limb construction. Although some parameters were, for some bones, covarying
with MD (size parameter), it was never the case for all bones (see Suppl. 1) -- hence all the
Graviportal taxa are large animals with relatively larger cross-sections in their humeri, femora
and ribs, reflecting greater resistance to compression and tension as well as greater bone mass,
especially in the stylopodia. They are also characterized by a thicker cortex and a
proportionally smaller medullary cavity, with a wider transition zone between the cortex and
the medullary cavity, notably linked to the filling of the medullary area by a spongiosa with
variations in trabecular thickness and size of intertrabecular spaces. This inner cancellous
structure may add benefits for impact energy absorption and marrow support [11, 12]. Wall
[15] noted the filling of the medullary cavity in Ceratotherium,suggesting a link with the
animal’s great weight, and the differences in the type of spongiosa between Ceratotherium
and Hippopotamus. Our results also show that graviportal taxa exhibit higher values for the
midshaft polar second moment of area, indicating increased resistance to stresses engendered
by bending and torsion [30] that predominate in vertebrate limb bones during locomotion
[31]. Results concerning the two stylopodial limb bones are strongly congruent.
However, rib microanatomical adaptation differs as summarized above. If there is a
clear increase in bone mass in the ribs of some graviportal taxa, comparable to that observed
in graviportal long bones, a similar phenomenon seems to occur for the bipedal forms
sampled -- but conversely not for the rhinoceroses and mammoth. Our analyses thus showed
an absence of significant signal in the rib MANOVA and a low K-NN classification power for
this bone. Considering the difficulty of making homologous comparisons with ribs (see
comments in [25, 32]), it appears necessary to increase taxon sampling and to analyse
variations along the rib and the ribcage in various taxa (as in [33] for one sauropod) in order
to better document and understand rib adaptations to changes of biomechanical constraints.
Distinguishing graviportal and amphibious adaptations
The variations we have detected among graviportal taxa are interesting—not all graviportal
tetrapods converge on the same bone inner morphologies. Alexander and Pond [7] established
that, although elephants, rhinoceroses and hippopotamus are considered graviportal taxa,
elephants strongly differ from the two other groups in their relatively much longer legs
(predominated by long stylopodia). The posture and gait of elephants is often
mis-characterized as uniformly “columnar” and restricted to simply walking (see [34, 35]) but is
nonetheless very distinct from rhinos and hippos in form and hence likely biomechanical
function as well. Likewise, hippos are known only to trot on land, never gallop, whereas even
behavioural disparity exists even between these taxa. Such gross differences between these
three groups of extant mammals are not evident at the microanatomical level (see “Qualitative
analysis”).
Despite this variability, a clear trend is observed across graviportal tetrapods examined
here. The increase in bone mass (as represented by the infilling of marrow cavities and
increased bone compactness; also see Christiansen, REF) observed in graviportal taxa,
including the amphibious Hippopotamus, is more restricted compared to that observed in
some other amniotes, especially some shallow water swimmers or bottom-walkers that are
almost exclusively aquatic (see [20, 28, 29]). Adaptation to a graviportal morphology and
related behaviours is thus not to be mistaken for the specialization of bone mass increase
observed in these aquatic taxa.
However, it is difficult to determine if the pattern observed in Hippopotamus reflects
its graviportal limbs or the benefit of a slight increase in bone mass in its legs in order to be
used as ballast and to stabilize in water. As a result both adaptations might be mistaken, or
even synergistic and pointless to try to untangle from their evolutionary integration.
Adaptation to a graviportal limb morphology should thus be taken into consideration when
analysing possibly amphibious taxa displaying a terrestrial-like morphology, and thus notably
in the study of the early stages of adaptation to an aquatic life in amniotes. This cautionary
note is particularly relevant for interpreting less well understood large extinct forms such as
some south American endemic ungulates (AH, unpublished observations), some giant
xenarthrans and marsupials, Arsinoitherium and related giant tethytheres (including basal
Proboscidea), and the diversity of large and small Rhinocerotoidea (e.g., [34–36]).
Methods
Material
The material analysed consists of humeri, femora and ribs of a large sample of fossil and
extant mammals and reptiles. The taxa were chosen based on availability (including good
preservation of the bone mid-diaphysis and feasibility of obtaining good quality digital
imaging data, in addition to general accessibility to our research team) with the aim of
including large forms and of representing diverse postures and locomotor habits (e.g.,
terrestrial vs. aquatic) (see Tables 1-3; Fig. 1). Our final sample consisted of 54 humeri of 49
phylogenetic position could not be determined precisely, so that they could not be
incorporated in analyses taking the phylogeny into consideration, they could increase the
sample of bipedal taxa), and 25 ribs of 25 species. Stylopodial bones were chosen because
they are thought to have a stronger ecological signal than zeugopodial ones [26, 27] and show
a much larger cross-sectional area in graviportal taxa ([7], REFS). Complete cross-sectional
microanatomical data for stylopodial bones are rare for giant sauropods because of practical
constraints imposed by the bone size. Conversely, whole transverse rib sections were
available, which explains why ribs were also chosen for the analysis.
Bone section analysis
Some bones were sectioned using standard petrographic thin-section techniques (e.g. [37];
Tables 1-3). Others were scanned using high-resolution computed tomography
(GEphoenix∣X-ray v∣tome∣xs 240) at the Steinmann-Institut, University of Bonn (Germany)
and at the AST-RX platform of the Muséum National d’Histoire naturelle (UMS 2700) or at
the Equine Diagnostic Imaging Centre at the Royal Veterinary College (GE Lightspeed), with
reconstructions performed using datox/res or similar software (e.g., in case of the GE
Lightspeed scans, Medview software (www.Medimage.com)). Image segmentation and
visualization were performed from the reconstructed image data using VGStudioMax 2.0 and
2.2 (Volume Graphics Inc., Heidelberg, Germany). These techniques have already been
shown neither to introduce artefacts nor to bias interpretation of the results for comparative
analyses [25, 38]. New virtual thin-sections were made from the microtomographic data in
cross-sectional planes of interest that serve as references for our comparative studies. For long
bones, these were diaphyseal transverse sections showing the thickest cortex, and thus
assumed to cross the growth centre (see [39, 40]). Rib transverse sections were made at about
the first third of the proximodistal distance along the rib’s perimeter, which has been shown to
be the location of the growth centre in ribs [33].
Scans of the classical (physical) thin-sections, performed at high resolution (i.e.,
between 6400 and 12800 dpi) using an Epson V750-M Pro scanner, and virtual thin-sections
were transformed into single-bit digital images using Photoshop CS3 (where black represents
bone and white cavities), and analysed using the software Bone Profiler [41]. Some additional
sections, either histological thin sections or virtual thin sections, come from previous studies
[20, 21, 42]. Quantitative parameters were measured directly on these images, again via Bone
Profiler [41] but also via the ImageJ plugin BoneJ [43], except for maximal bone diameter
details and illustrations): (1) C: compactness of the whole section (i.e., surface occupied by
bone divided by whole sectional area); (2) P: the extent of the medullary cavity as measured
by the relative distance fromthe centre of the section to the point where the most abrupt
change in compactness occurs; (3) S: the width of the transitional zone between the compact
cortex and the medullary cavity as measured by the reciprocal of the slope of the compactness
profile at the inflection point; (4) MD: maximum bone diameter at the level of section (here
considered asa proxy for body size); (5) R/t: outside radius of the bone divided by the
thickness of the cortex ([44]); (6) CSS: cross-sectional shape (=Imax/Imin; the ratio of maximal
to minimal second moments of area); (8) J: polar second moment of area (=Imax + Imin); (9)
Zpol: polar section modulus (see for definitions of these measurements #6-9 and usage in
BoneJ software); and (10) Per: perimeter of the section.
Statistical analyses
All data were log10 transformed prior to analyses (CSA and Zpol were first raised to the power
of 0.50 and 0.33, respectively, reducing them to dimensions more comparable to linear
values) to meet assumptions of normality and homoscedasticity required for parametric
analyses. Considering that the parameter maximal diameter (MD) is usually considered as an
estimate of overall body size [41], and actual body mass data were not available for our
specimens, we performed linear regression analyses on the various microanatomical
parameters in order to evaluate the scaling of each parameter vs. MD in the dataset. Because
of the very strong impact of MD on the parameters Per, CSA and Zpol (r~0.99), the later were
removed from the analyses, to avoid multiplying the same signal. The amount of phylogenetic
signal was investigated for the different parameters analysed, as follows. Statistical tests were
performed using an approximate “consensus” phylogeny, derived from several published
phylogenies [45–52] (Fig.7). We calculated the K-statistic following Blomberg, Garland &
Ives [53], which compares the observed phylogenetic signal in a trait to the signal under a
Brownian motion model of trait evolution. Species means were used when several specimens
were available for the same species. A K-value lower than one implies less similarity between
relatives than expected under Brownian motion. We then performed linear regression analyses
on all parameters in order to evaluate the allometry in the data. As a phylogenetic signal
generally was detected, we calculated independent contrasts and forced regressions through
the origin. We then conducted a Principal Components Analysis (PCA) in order to explore the
distribution of the different taxa in morphospace. Four groups were defined based on their
relatively long stylopodia; likely columnar posture), (2) Quadrupedal (graviportal taxa
excluded), (3) Bipedal and (4) Aquatic (groups 1-3 being predominantly terrestrial taxa). In
order to clearly visualize the trends between the different groups, a between-groups PCA was
performed (on the mean values for each group). We also performed a pattern recognition
analysis using the K-nearest neighbours algorithm (see [54]) in order to discriminate between
our groups while avoiding possible biases linked to more classical discriminant analyses
(notably as a result of the small number of specimens for some groups). Phylogenetic
ANOVAs and ANCOVAs (when a size effect was detected), as well as phylogenetic
MANOVAS were performed as tests to determine if the group number had a significant
correlation with the various parameters analysed.
All statistical analyses were performed using the statistical software R [55] except
phylogenetic ANCOVAs that required the use of the PDSIMUL and PDANOVA routines
implemented in PDAP [56]. In the PDSIMUL program, we used Brownian motion as our
model for evolutionary change and ran 1000 unbounded simulations to create an empirical
null distribution against which the F-values from the original data could be compared.
Competing interests
The authors declare that they have no competing interests
Authors’ contributions
AH designed the study. AH, KW, SH, AHL and JRH participated to the data acquisition. AH
conducted the analyses and drafted the manuscript, with significant inputs from RC and JRH,
respectively. All authors contributed to the final manuscript, read it and approved it.
Acknowledgments
We warmly thank O. Dülfer, P. Göddertz, Y. Nakajima, P.M. Sander, R. Schellhorn and J.
Schultz, (Steinmann-Institut, University of Bonn, Bonn, Germany), C. Bens and J. Lesur
(Muséum National d’Histoire naturelle, Paris, France), N. Klein (Staatliches Museum für
Naturkunde, Stuttgart, Germany), O. Mateus (Museu da Lourinha, Lourinha , Portugal), R.
Scheetz (Brigham Young University, Utah, USA), W. Simpson (Field Museum of Natural
History, Chicago, USA), F. Straehl, T. Scheyer and M. Sanchez-Villagra (Universität Zurich,
Zurich, Switzerland), R. Barsbold, K. Tsogtbaatar and C. Tsogtbaatar (Mongolian
Museum, Yale University, New Haven, USA), S. Ishigaki, M. Saneyoshi and S. Suzuki
(Hayashibara Museum of Natural Sciences, Okayama, Japan), H. Taruno (Osaka Museum of
Natural History, Osaka, Japan), T. Ando, H. Sawamura and T. Shinmura (Ashoro Museum of
Paleontology, Ashoro, Japan), S. Kawada, M. Manabe, R. Miyawaki, R. Tajiri and T. Yamada
(National Science Museum, Tokyo, Japan), Y. Kobayashi, K. Nakamura and H. Nomura
(Hokkaido University, Sapporo, Japan), H. Berke (Universität Köln, Köln, Germany), K.
Padian and S. Werning (University of California Museum of Paleontology, Barkley, USA), R.
Irmis (Utah Musum of Natural History, Utah, USA), T. Bolliger and H.J. Siber
(Sauriermuseum Aathal, Switzerland), G.W. Storrs (Cincinnati Museum Center, Ohio, USA),
M. Lowe (University Museum of Zoology, Cambridge) and R. Sabin (Natural History
Museum, Department of Zoology, London) for the loan of specimens, sections or images.
Input on earlier, independent inceptions of this study from S. Shefelbine, M. Doube, M.
Laurin and S. Pierce is appreciated. We thank the Steinmann Institut (University of Bonn,
Germany) for providing beamtime and support, UMS 2700 outils et méthodes de la
systématique intégrative CNRS-MNHN and AST-RX, Plateau technique d’accès scientifique
à la tomographie à rayons X du MNHN, M. Garcia Sanz for performing the scans and
reconstructions at the AST-RX platform (MNHN, Paris, France), and UMR 7207 CR2P
MNHN CNRS UPMC-Paris6 for 3D imaging facilities. A.H. thanks F. Goussard (MNHN,
Paris, France) for discussions about graviportality and A.C. Fabre (Duke University, NC,
USA) for her help with statistics. A.H. acknowledges financial support from the
ANR-13-PDOC-001 and the A. v. Humboldt Foundation. J.R.H. was funded by grants from the Natural
Environment Research Council (UK). Funding was provided by the Japanese Society for the
Promotion of Science (JSPS) to S.H.
References
1. Gray J. Animal Locomotion. Lond Weidenfield Nicolson; 1968.
2. Polly PD, Hall B. Limbs in mammalian evolution. Fins Limbs Evol Dev Transform; 2007. p. 245-268.
3. Hildebrand M. Analysis of vertebrate structure; 1982.
4. Carrano MT. The evolution of dinosaur locomotion: functional morphology, biomechanics, and modern analogs; 1998.
6. Gregory WK. Notes on the principles of quadrupedal locomotion and on the mechanism of he limbs in hoofed animals. Ann N Y Acad Sci. 1912:22:267-294.
7. Alexander R, Pond C. Locomotion and bone strength of the white rhinoceros, Ceratotherium simum. J Zool. 1992:227:63-69.
8. Schmidt-Nielsen K. Scaling: Why Is Animal Size so Important? Cambridge University Press; 1984.
9. Ross MD. The influence of gravity on structure and function of animals. Adv Space Res. 1984:4:305–314.
10. Doube M, Kłosowski MM, Wiktorowicz-Conroy AM, Hutchinson JR, Shefelbine SJ: Trabecular bone scales allometrically in mammals and birds. Proc R Soc B Biol Sci. 2011: 278:3067-3073.
11. Oxnard CE. Bone and bones, architecture and stress, fossils and osteoporosis. J Biomech. 1993:26:63-79.
12. Oxnard C. From giant ground sloths to human osteoporosis: an essay on the architecture and biomechanics of bone. 1990:3:75-96.
13. Sander PM, Christian A, Clauss M, Fechner R, Gee CT, Griebeler E-M, Gunga H-C, Hummel J, Mallison H, Perry SF, Preuschoft H, Rauhut OWM, Remes K, Tütken T, Wings O, Witzel U. Biology of the sauropod dinosaurs: the evolution of gigantism. Biol Rev. 2011: 86:117-155.
14. Houssaye A. “Pachyostosis” in aquatic amniotes: a review. Integr Zool.2009:4:325-340.
15. Wall WP. The correlation between high limb-bone density and aquatic habits in recent mammals. J Paleontol. 1983:57:197-207.
16. Fish FE, Stein BR. Functional correlates of differences in bone density among terrestrial and aquatic genera in the family Mustelidae (Mammalia). Zoomorphology 1991, 110:339– 345.
17. De Buffrénil V, Canoville A, D’Anastasio R, Domning DP: Evolution of sirenian pachyosteosclerosis, a model-case for the study of bone structure in aquatic tetrapods. J Mamm Evol. 2010:17:101-120.
18. Clementz MT, Holroyd PA, Koch PL. Identifying aquatic habits of herbivorous mammals through stable isotope analysis. Palaios. 2008:23:574-585.
19. Cubo J, Ponton F, Laurin M, Margerie E de, Castanet J. Phylogenetic signal in bone microstructure of sauropsids. Syst Biol. 2005:54:562-574.
21. Straehl FR, Scheyer TM, Forasiepi AM, MacPhee RD, Sánchez-Villagra MR.
Evolutionary patterns of bone histology and bone compactness in xenarthran mammal long bones. PLoS ONE. 2013:8:e69275.
22. Amson E, Argot C, McDonald HG, de Muizon C. Osteology and functional morphology of the forelimb of the marine sloth Thalassocnus (Mammalia, Tardigrada). J Mamm Evol. 2014.
23. Garland Jr T. Phylogenetic comparison and artificial selection. In Hypoxia. Springer; 2001:107-132.
24. Carrano MT. Implications of limb bone scaling, curvature and eccentricity in mammals and non‐avian dinosaurs. J Zool. 2001:254:41-55.
25. Houssaye A, Tafforeau P, Herrel A. Amniote vertebral microanatomy–what are the major trends? Biol J Linn Soc. 2014:112:735-746.
26. Canoville A, Laurin M. Evolution of humeral microanatomy and lifestyle in amniotes, and some comments on palaeobiological inferences. Biol J Linn Soc. 2010:100:384-406.
27. Quemeneur S, Buffrénil V, Laurin M. Microanatomy of the amniote femur and inference of lifestyle in limbed vertebrates. Biol J Linn Soc. 2013:109:644-655.
28. Houssaye A, Lindgren J, Pellegrini R, Lee AH, Germain D, Polcyn MJ. Microanatomical and histological features in the long bones of mosasaurine mosasaurs (Reptilia, Squamata) -Implications for aquatic adaptation and growth rates. PLoS ONE. 2013:8:e76741.
29. Klein N, Houssaye A, Neenan JM, Scheyer TM. Long bone histology and microanatomy of Placodontia (Diapsida: Sauropterygia). Contrib Zool. 2015:84:59-84.
30. O’Neill MC, Ruff CB. Estimating human long bone cross-sectional geometric properties: a comparison of noninvasive methods. J Hum Evol. 2004:47:221-235.
31. Ruff CB. Long bone articular and diaphyseal structure in old world monkeys and apes. I: locomotor effects. Am J Phys Anthr. 2002:119:305-42.
32. Houssaye A, Bardet N. Rib and vertebral micro-anatomical characteristics of hydropelvic mosasauroids. Lethaia 2012:45:200:209.
33. Waskow K, Sander PM. Growth record and histological variation in the dorsal ribs of Camarasaurus sp. (Sauropoda). J Vertebr Paleontol. 2014:34:852-869.
34. Gheerbrant E, Tassy P. L’origine et l’évolution des éléphants. Comptes Rendus Palevol. 2009:8:281-294.
35. Antoine P-O, Ducrocq S, Marivaux L, Chaimanee Y, Crochet J-Y, Jaeger J-J, Welcomme J-L. Early rhinocerotids (Mammalia: Perissodactyla) from South Asia and a review of the Holarctic Paleogene rhinocerotid record. Can J Earth Sci. 2003. 40:365-374.
37. Houssaye A, Buffrenil V de, Rage JC, Bardet N. An analysis of vertebral “pachyostosis” in Carentonosaurus mineaui (Mosasauroidea, Squamata) from the Cenomanian (early Late Cretaceous) of France, with comments on its phylogenetic and functional significance. J Vertebr Paleontol 2008:28:685-691.
38. Dumont M, Laurin M, Jacques F, Pelle E, Dabin W, de Buffrenil V. Inner architecture of vertebral centra in terrestrial and aquatic mammals: a two-dimensional comparative study. J Morphol 2013:274:570-84.
39. Houssaye A, Scheyer TM, Kolb C, Fischer V, Sander PM: A new look at ichthyosaur long bone microanatomy and histology: Implications for their adaptation to an aquatic life. PLoS ONE. 2014:9:e95637.
40. Nakajima Y, Hirayama R, Endo H. Turtle humeral microanatomy and its relationship to lifestyle. Biol J Linn Soc. 2014:112:719-734.
41. Girondot M, Laurin M: Bone profiler: a tool to quantify, model, and statistically compare bone-section compactness profiles. J Vertebr Paleontol. 2003:23:458-461.
42. Laurin M, Canoville A, Germain D. Bone microanatomy and lifestyle: A descriptive approach. Comptes Rendus Palevol. 2011:10:381-402.
43. Doube M, Kłosowski MM, Arganda-Carreras I, Cordelières FP, Dougherty RP, Jackson JS, Schmid B, Hutchinson JR, Shefelbine SJ: BoneJ: Free and extensible bone image analysis in ImageJ. Bone 2010:47:1076-1079.
44. Currey JD, Alexander RM. The thickness of the walls of tubular bones. J Zool Lond. 1985:206:453-468.
45. Sereno PC: The evolution of dinosaurs. Science. 1999:284:2137-2147.
46. Gilbert C, Ropiquet A, Hassanin A. Mitochondrial and nuclear phylogenies of Cervidae (Mammalia, Ruminantia): Systematics, morphology, and biogeography. Mol Phylogenet Evol. 2006:40:101-17.
47. Remes K. Taxonomy of Late Jurassic diplodocid sauropods from Tendaguru (Tanzania). Foss Rec. 2009:12:23-46.
48. Todd NE. New phylogenetic analysis of the family elephantidae based on cranial-dental morphology. Anat Rec Hoboken. 2010:293:74-90.
49. Meredith RW, Janečka JE, Gatesy J, Ryder OA, Fisher CA, Teeling EC, Goodbla A, Eizirik E, Simão TL, Stadler T: Impacts of the Cretaceous Terrestrial Revolution and KPg extinction on mammal diversification. Science 2011:334:521-524.
50. Steiner CC, Ryder OA. Molecular phylogeny and evolution of the Perissodactyla. Zool J Linn Soc. 2011:163:1289-1303.
52. Thompson RS, Parish JC, Maidment SC, Barrett PM: Phylogeny of the ankylosaurian dinosaurs (Ornithischia: Thyreophora). J Syst Palaeontol. 2012:10:301-312.
53. Blomberg SP, Garland T, Ives AR. Testing for phylogenetic signal in comparative data: behavioral traits are more labile. Evolution. 2003:57:717-745.
54. Cornette R, Herrel A, Stoetzel E, Moulin S, Hutterer R, Denys C, Baylac M. Specific information levels in relation to fragmentation patterns of shrew mandibles: do fragments tell the same story? J Archaeol Sci. 2015:53:323-330.
55. Team RC. R: A language and environment for statistical computing. R Foundation for Statistical Computing, Vienna, Austria, 2012.
56. Garland T, Dickerman AW, Janis CM, Jones JA. Phylogenetic analysis of covariance by computer simulation. Syst Biol. 1993:42:265-292.
Figure legends
Figure 1. Schematic drawings illustrating the diversity of microanatomical patterns observed
in humeri of: A- Giraffa camelopardalis, B- Choeropsis liberiensis, C- Hippopotamus
amphibious, D- Ampelosaurus atacis, E- Centrosaurus apertus, F- Ceratotherium simum, G-
Rhinoceros unicornis, H- Elephas maximus, I- Diceros bicornis, J- Trichechus manatus, K-
Paleoparadoxia sp., L- Dugong dugon. Scale bars: 5 mm.
Figure 2. Schematic drawings illustrating the diversity of microanatomical patterns observed
in femora of: A- Giraffa camelopardalis; B- Syncerus caffer, C- Rhinoceros unicornis, D-
Rhinoceros sondaicus, E- Elephas maximus, F- Mammuthus sp., G- Hippopotamus
amphibious, H- Stegosaurus sp. Scale bars: 5 mm
Figure 3. Schematic drawings illustrating the diversity of microanatomical patterns observed
in ribs of: A- Martes foina, B- Ursus spelaeus, C- Paleoparadoxia sp., D- Miragaia
longicollum, E- Cathetosaurus sp., F- Lourinhanosaurus sp., G- Baryonyx sp., H-
Mammuthus primigenius, I- Rhinoceros unicornis. Scale bars: 5 mm (except for Martes: 0.5
Figure 4. Microanatomical clusters obtained by Principal Component Analyses (PCA)
conducted on the humeri of our sample. Graphs showing the distribution of the variance in all
taxa examined according to the PCA1 and PCA2 axes. A, classical PCA; B, between-groups
PCA. Abbreviations for the taxa in the PCA graphs as in Table 1.
Figure 5. Microanatomical clusters obtained by Principal Component Analyses (PCA)
conducted on the femora of our sample. Graphs showing the distribution of the variance in all
taxa examined according to the PCA1 and PCA2 axes. A, classical PCA; B, between-groups
PCA. Abbreviations for the taxa in the PCA graphs as in Table 2.
Figure 6. Microanatomical clusters obtained by Principal Component Analyses (PCA)
conducted on the ribs of our sample. Graphs showing the distribution of the variance in all
taxa examined according to the PCA1 and PCA2 axes. A, classical PCA; B, between-groups
PCA. Abbreviations for the taxa in the PCA graphs as in Table 3.
Figure 7. Consensus phylogenetic tree (based on [45–52]) with the 4 groups defined in the
present study illustrated (yellow: graviportal; green: quadrupedal (graviportal taxa excluded);
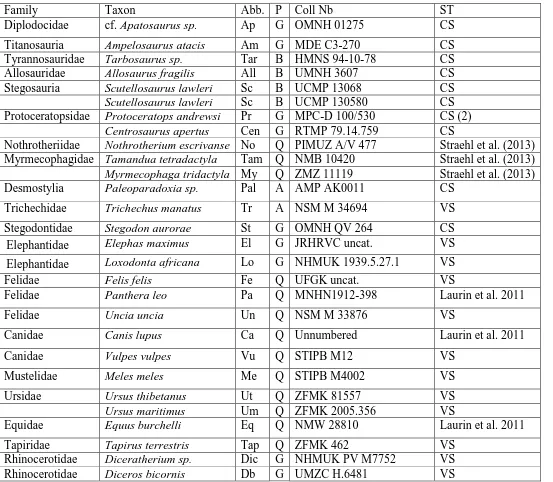
Table 1. List of the humeri analyzed in this study. Abb: abbreviations; P: posture; G: graviportal; B: bipedal; Q: quadrupedal; A: aquatic; ST: section type; CS: classical section; VS: virtual section.
Family Taxon Abb. P Coll Nb ST
Diplodocidae cf. Apatosaurus sp. Ap G OMNH 01275 CS
Titanosauria Ampelosaurus atacis Am G MDE C3-270 CS Tyrannosauridae Tarbosaurus sp. Tar B HMNS 94-10-78 CS Allosauridae Allosaurus fragilis All B UMNH 3607 CS Stegosauria Scutellosaurus lawleri Sc B UCMP 13068 CS
Scutellosaurus lawleri Sc B UCMP 130580 CS
Protoceratopsidae Protoceratops andrewsi Pr G MPC-D 100/530 CS (2)
Centrosaurus apertus Cen G RTMP 79.14.759 CS
Nothrotheriidae Nothrotherium escrivanse No Q PIMUZ A/V 477 Straehl et al. (2013) Myrmecophagidae Tamandua tetradactyla Tam Q NMB 10420 Straehl et al. (2013) Myrmecophaga tridactyla My Q ZMZ 11119 Straehl et al. (2013) Desmostylia Paleoparadoxia sp. Pal A AMP AK0011 CS
Trichechidae Trichechus manatus Tr A NSM M 34694 VS
Stegodontidae Stegodon aurorae St G OMNH QV 264 CS Elephantidae Elephas maximus El G JRHRVC uncat. VS
Elephantidae Loxodonta africana Lo G NHMUK 1939.5.27.1 VS Felidae Felis felis Fe Q UFGK uncat. VS
Felidae Panthera leo Pa Q MNHN1912-398 Laurin et al. 2011
Felidae Uncia uncia Un Q NSM M 33876 VS
Canidae Canis lupus Ca Q Unnumbered Laurin et al. 2011
Canidae Vulpes vulpes Vu Q STIPB M12 VS
Mustelidae Meles meles Me Q STIPB M4002 VS
Ursidae Ursus thibetanus Ut Q ZFMK 81557 VS
Ursus maritimus Um Q ZFMK 2005.356 VS
Equidae Equus burchelli Eq Q NMW 28810 Laurin et al. 2011
Rhinocerotidae Diceros bicornis Db G NHMUK M92402 VS Rhinocerotidae Ceratotherium simum Ce G JRHRVC uncat. VS Ceratotherium simum Ce G MNHN ZM MO 2005-297 VS Rhinocerotidae Dicerorhinus sumatrensis Di G UMZC H.6392 VS Dicerorhinus sumatrensis Di G MNHN ZM AC 1903-300 VS
Rhinoceros sondaicus Rs G MNHN ZM AC A7970 VS
Rhinoceros unicornis Ru G MNHN ZM AC 1960-59 VS Hippopotamidae Choeropsis liberiensis Ch G ZFMK 65 570 VS Hippopotamidae Hippopotamus amphibius Hi G UMZC H.10714 VS
Suidae Sus scrofa Su Q STIPB M56 VS
Giraffidae Giraffa camelopardalis Gi Q JRHRVC uncat. VS Giraffidae Okapia johnstoni Ok Q UMZC H.20302 VS
Cervidae Rangifer tarandus Ra Q STIPB M47 VS
Capreolus capreolus Cp Q MNHN CH 221 Laurin et al. 2011
Alces americanus Al Q UMZC H.17691 VS
Cervus elaphus Cer Q MNHN Unnumbered Laurin et al. 2011
Cervidae Megaloceros sp. Meg Q UCMP 63524 VS
Cervidae Megaloceros giganteus Meg Q UMZC H.17535 VS
Dama dama Da Q STIPB M1 VS
Bovidae Cephalophus sylvicultor Cep Q NHMUK ZD 1961.8.9.80-1 VS
Bovidae Ovis ammon Ov Q NMW 26499 Laurin et al. 2011
Bovidae Rupicapra Rup Q STIPB M1639 VS
Capra falconeri Cap Q NMW 12081 Laurin et al. 2011
Bovidae Boselaphus tragocamelus Bo Q NMW 25399 Laurin et al. 2011
Bovidae Taurotragus oryx Tau Q NMW 61319 Laurin et al. 2011
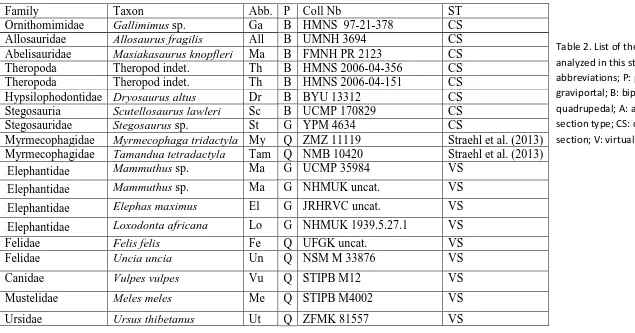
Table 2. List of the femora analyzed in this study. Abb: abbreviations; P: posture; G: graviportal; B: bipedal; Q: quadrupedal; A: aquatic; ST: section type; CS: classical section; V: virtual section.
Family Taxon Abb. P Coll Nb ST
Ornithomimidae Gallimimus sp. Ga B HMNS 97-21-378 CS Allosauridae Allosaurus fragilis All B UMNH 3694 CS Abelisauridae Masiakasaurus knopfleri Ma B FMNH PR 2123 CS Theropoda Theropod indet. Th B HMNS 2006-04-356 CS Theropoda Theropod indet. Th B HMNS 2006-04-151 CS Hypsilophodontidae Dryosaurus altus Dr B BYU 13312 CS Stegosauria Scutellosaurus lawleri Sc B UCMP 170829 CS Stegosauridae Stegosaurus sp. St G YPM 4634 CS
Myrmecophagidae Myrmecophaga tridactyla My Q ZMZ 11119 Straehl et al. (2013) Myrmecophagidae Tamandua tetradactyla Tam Q NMB 10420 Straehl et al. (2013)
Elephantidae Mammuthus sp. Ma G UCMP 35984 VS
Elephantidae Mammuthus sp. Ma G NHMUK uncat. VS
Elephantidae Elephas maximus El G JRHRVC uncat. VS
Elephantidae Loxodonta africana Lo G NHMUK 1939.5.27.1 VS Felidae Felis felis Fe Q UFGK uncat. VS Felidae Uncia uncia Un Q NSM M 33876 VS
Canidae Vulpes vulpes Vu Q STIPB M12 VS
Mustelidae Meles meles Me Q STIPB M4002 VS
Ursus maritimus Um Q ZFMK 2005.356 VS Tapiridae Tapirus terrestris Ta Q ZFMK 462 VS Rhinocerotidae Ceratotherium simum Ce G MNHN ZM MO 2005-297 VS
Ceratotherium simum Ce G JRHRVC uncat. VS
Dicerorhinus sumatrensis Di G MNHN ZM AC 1903-329 VS
Rhinoceros sondaicus Rs G MNHN ZM AC A7970 VS
Rhinoceros unicornis Ru G MNHN ZM AC 1960-59 VS Hippopotamidae Choeropsis liberiensis Ch Q ZFMK 65 570 VS Hippopotamidae Hippopotamus amphibius Hi G UMZC H.10714 VS Camelidae Lama guanicoe La Q STIPB M7388 VS
Suidae Sus scrofa Su Q STIPB M56 VS
Giraffidae Okapia johnstoni Ok Q UMZC H.20302 VS Giraffidae Giraffa camelopardalis Gi Q JRHRVC uncat. VS
Cervidae Dama dama Da Q STIPB M1 VS
Cervidae Megaloceros sp. Meg Q UCMP 63524 VS Cervidae Rangifer tarandus Ra Q STIPB M47 VS
Capreolus capreolus Cp STIPB M1452 VS
Cervidae Alces americanus Al Q UMZC H.17691 VS Bovidae Cephalophus sylvicultor Cep Q NHMUK ZD 1961.8.9.80-1 VS
Bovidae Rupicapra Ru Q STIPB M1639 VS
Bovidae Syncerus caffer Sy Q NHMUK ZD 1874.11.2.4 VS
Bovidae Bos taurus Bos Q NHMUK 47 VS
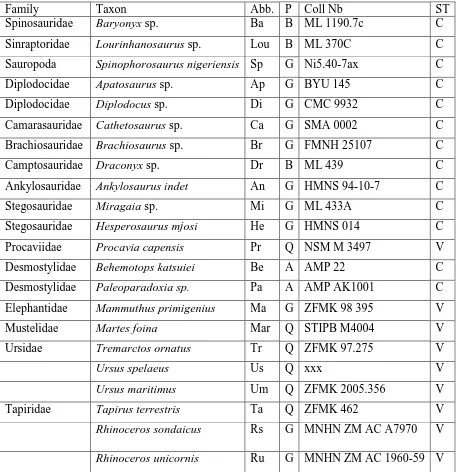
Table 3. List of the ribs analyzed in this study. Abb: Abbreviations; P: posture; G: graviportal; B: bipedal; Q: quadrupedal; A: aquatic; ST: section type; CS: classical section; V: virtual section.
Family Taxon Abb. P Coll Nb ST
Spinosauridae Baryonyx sp. Ba B ML 1190.7c C
Sinraptoridae Lourinhanosaurus sp. Lou B ML 370C C
Sauropoda Spinophorosaurus nigeriensis Sp G Ni5.40-7ax C
Diplodocidae Apatosaurus sp. Ap G BYU 145 C
Diplodocidae Diplodocus sp. Di G CMC 9932 C
Camarasauridae Cathetosaurus sp. Ca G SMA 0002 C
Brachiosauridae Brachiosaurus sp. Br G FMNH 25107 C
Camptosauridae Draconyx sp. Dr B ML 439 C
Ankylosauridae Ankylosaurus indet An G HMNS 94-10-7 C
Stegosauridae Miragaia sp. Mi G ML 433A C
Stegosauridae Hesperosaurus mjosi He G HMNS 014 C
Procaviidae Procavia capensis Pr Q NSM M 3497 V
Desmostylidae Behemotops katsuiei Be A AMP 22 C
Desmostylidae Paleoparadoxia sp. Pa A AMP AK1001 C
Elephantidae Mammuthus primigenius Ma G ZFMK 98 395 V
Mustelidae Martes foina Mar Q STIPB M4004 V
Ursidae Tremarctos ornatus Tr Q ZFMK 97.275 V
Ursus spelaeus Us Q xxx V
Ursus maritimus Um Q ZFMK 2005.356 V
Tapiridae Tapirus terrestris Ta Q ZFMK 462 V
Rhinoceros sondaicus Rs G MNHN ZM AC A7970 V
Hippopotamidae Choeropsis liberiensis Ch Q ZFMK 65 570 V
Bovidae Bison bonasus Bi Q ZFMK 2010-303 V
Table 4. Table showing the F and p values obtained for the various analyses of (co)variance. In bold
when p<0.05.
Phylogenetic ANOVA ANCOVA Phylogenetic ANCOVA
F p F p F p
HUMERUS
C 11.96 0.032
S 5.49 0.024 8.68 0.235
P 14.16 0.015
RT 8.52 0.081
CSS 1.14 0.794
J 5.28 0.026 8.58 0.261
FEMUR
C 7.96 0.008 8.84 0.105
S 4.86 0.412
P 7.99 0.008 8.78 0.089
RT 5.52 0.025 8.77 0.212
CSS 7.63 0.009 9.00 0.103
J 8.54 0.006 9.05 0.081
RIB
C 2.35 0.546
S 2.44 0.529
P 7.17 0.111
RT 4.87 0.216
CSS 0.77 0.852
Phylogenetic Signal Linear Regressions on the independent contrast data
Humerus K p p adjusted R2
C 0.68 <0.001* 0.91 -0.02
S 0.55 <0.001* 0.01* 0.11
P 0.49 <0.001* 0.81 -0.02
RT 0.56 <0.001* 0.50 -0.01
MD 0.40 <0.001* - -
CSS 0.34 0.041* 0.09 0.04
J 0.37 0.002* 0.04* 0.07
Femur
C 0.46 <0.001* 0.01* 0.16
S 0.55 <0.001* 0.33 0.00
P 0.47 0.004* 0.01* 0.15
RT 0.48 0.003* 0.01* 0.13
MD 0.37 0.006* - -
CSS 0.51 0.007* <0.01* 0.32
J 0.45 0.005* <0.01* 0.54
Rib
C 0.47 0.139 0.61 -0.03
S 0.39 0.550 0.15 0.05
P 0.65 0.016* 0.98 -0.04
RT 0.56 0.049* 0.47 -0.02
MD 0.67 0.017* - -
CSS 0.43 0.282 0.30 0.01