NT Mud Crab Fishery by Enhancing
Post-Harvest Survival of Mud Crabs
Sue Poole, John Mayze
Paul Exley, Carl Paulo
NT CRAB
FISHERMEN’S
ASSOCIATION
Project No. 2003/240
Maximising Revenue
within the
NT Mud Crab Fishery by
Enhancing Post-Harvest
Survival of Mud Crabs
Sue Poole, John Mayze
Paul Exley, Carl Paulo
Project No. 2003/240
ISBN 978-0-7345-0407-4
Maximising Revenue within the NT Mud Crab Fishery by Enhancing Post-Harvest Survival of Mud Crabs.
Sue Poole, John Mayze, Paul Exley, Carl Paulo.
Final report of project number 2003/240 submitted to the Fisheries Research and Development Corporation in December 2008.
Copyright Fisheries Research and Development Corporation and Department of Primary Industries and Fisheries, Queensland. 2008.
This work is copyright. Except as permitted under the Copyright Act 1968, no part of this publication may be reproduced by any process, electronic or otherwise, without the specific written permission of the copyright owners. Information may not be stored electronically in any form whatsoever without such permission.
Disclaimer
The authors do not warrant that the information in this document is free from errors or omissions. The authors do not accept any form of liability, be it contractual, tortuous, or otherwise, for the contents of this document or for any consequences arising from its use or any reliance placed upon it. The information, opinions and advice contained in this document may not relate, or be relevant, to a readers particular circumstances. Opinions expressed by the authors are the individual opinions expressed by those persons and are not necessarily those of the publisher, research provider or the FRDC.
Information in this report is provided as general advice only.
For application to specific circumstances, professional advice should be sought.
The Department of Primary Industries and Fisheries, Queensland, has taken all reasonable steps to ensure that the information contained in this publication is accurate at the time of publication. Readers should ensure they make appropriate inquiries to determine whether new information is available on the particular subject matter
The Fisheries Research and Development Corporation plans, invests in and manages fisheries research and development throughout Australia. It is a statutory authority within the portfolio of the federal Minister for Agriculture, Fisheries and Forestry, jointly funded by the Australian Government and the fishing industry.
For enquiries or further copies of this report, contact
Innovative Food Technologies
Department of Primary Industries and Fisheries, Queensland 19 Hercules St
HAMILTON QLD 4007 AUSTRALIA
Or
Fisheries Research and Development Corporation P.O. Box 222
Acknowledgements
Heartfelt thanks go to Doug Neville, President, NT Crab Fishermen’s Association
and Co-investigator on this project. Without his ready, willing support and frequent positive contributions, this research would not have been possible. Doug always displayed charming forbearance of the authors’ constant queries and quest for current information. Additional thanks go to Darryl Everett, past president of the NT
Crab Fishermen’s Association, for his assistance in the early phases of the project and providing access to Association information as well as commercial data.
Enormous appreciation is extended to all the mud crab harvesters for their ready facilitation of access to mud crabs and crab harvesting camps. In the NT: particular thanks go to Roy Wright, Wearyan River, NT; Mike Fraser, Adelaide River, NT; Goldie Tybell, Finniss River, NT; Jimmy and Tong, McArthur River, NT. In Qld,
Ross Menso, NQ; David Perkins, past Chairman, Crab Management Advisory
Committee.
Further enormous thanks go to Chris Calogeras of C-AID Consultants for his
endless support throughout the project work. Chris assisted in every phase from project application, assisting in field work, access to wholesale premises and data, as well as positive critical comment on presenting findings to the stakeholders. Again, this project would not have been possible without his constant support.
Similarly, we extend huge and heartfelt gratitude to Tracy Hay, leader of mud crab
research within the NT Fisheries Research, DBIRD during the early stages of this project. Tracy engendered the success of this project through her wonderful assistance in enabling initial field work and her extremely generous introductions to crab harvesters, sharing of knowledge, and operational know-how within the NT mud crab fishery.
We are sincerely grateful for all the boundless help we received from industry stakeholders throughout the mud crab supply chain. Huge thanks are especially extended to Long and Serina Tran of Seaking Seafood Supplies; Ziko and Carmel Ilic, Darwin Fish Market for the willing tolerance of our regular invasion of their
commercial premises and for all their invaluable assistance with data provision and industry trials. Equally our enormous gratitude is extended to Harry and Kristina Georges, Samies Girl for access to mud crabs, conduction of industry trials and
food for the crabs when we needed to recover the animals to full robustness. Numerous industry personnel and businesses provided invaluable assistance at the wholesale and retail levels and we remain hugely appreciative of every contribution. Of special mention are: Neil Green, President Queensland Industry Association for
his keen interest, knowledge sharing and supply of industry contacts; Donna Brown, Morgans Seafood for assistance with the industry survey and enabling our
involvement in the Redcliffe seafood festival; Mark Boulter, Sydney Fish Market for
access to the live mud crab market auction and willing provision of retail level information and revenue data. Enormous thanks also go to all participants of the industry survey who provided confidential commercial information so willingly.
Special thanks go to Wal Newman, Fisherman, Moreton Bay, for generously and
regularly supplying fresh ‘bait’ crab food whatever the hurdles. Further huge appreciation is extended to Alan Snow, Seafood Services Australia, for his
Further grateful thanks go to Dr. Tim Ward for his permission to use data and to Dr. Richard Musgrove for useful discussions on crustacean haemolymph colour.
Last, but definitely not least, the authors would like to extend hugely appreciative thank to other QDPI staff who contributed to achieving the project goals:
Very special thanks to Jimmy Baker, Scientific Assistant, for his years of constantly
happy willingness to take care of the mud crabs while held for experimental work and the prolonged hours put into monitoring and feeding crabs, cleaning tanks and assisting with trial research.
Sharon Pun, Analytical Technician, IFT, for expert analysis of an enormous number
of haemolymph samples for lactate presence. Additional thanks here go to David Williams and Caterina Torrisi.
Dr Craig Davis, Senior Biochemist, IFT, for valuable scientific discussions,
assistance in trial work and excellent editing.
Kerrie Abberton,Mel Kippen, Stephanie Kirchhoff, Steve Grauf and Jeff Herse,
IFT staff who made noteworthy contributions in many different ways.
Dr Brian Paterson and Bev Kelly, Bribie Island Aquaculture Research Centre – for
generous sharing of knowledge and crabs for trials.
The authors wish to fully acknowledge the generous funding support of the
Fisheries Research and Development Corporation without which this research
2003/240 Maximising revenue within the Northern Territory mud crab fishery by enhancing post-harvest survival of mud crabs (Scylla serrata)
PRINCIPAL INVESTIGATOR: Sue Poole
ADDRESS: Innovative Food Technologies
Department of Primary Industries & Fisheries 19 Hercules Street
Hamilton QLD 4007
Tel: 07 3406 8689 Fax: 07 3406 8698
OBJECTIVES:
1. Analyse available industry data (including anecdotal information from commercial operators) for correlation between high mortality rates and specific environmental or conditional factors
2. Document current mortality data in specifically designed logs to capture all possible factors
3. Establish physiological factors and stress level indicators for harvested mud crabs
4. Determine stress contributed by current post-harvest practices
5. Advance strategies for through-chain product traceability to differentiate crabs
6. Develop specific cost-effective handling procedures which minimise stress to crabs
7. Update industry of results through participation in trials
NON TECHNICAL SUMMARY:
OUTCOMES ACHIEVED TO DATE
The supply chain for mud crabs in Australia relies solely on live product and the major outcome of this project was increased survival of mud crabs through the chain. This was achieved through identification of stress biomarkers that were used as tools to understand which handling steps along the chain impose the greatest stress to the crabs. With this information, alternative handling practices were developed to minimise stresses experienced and consequently improve survival rates.
Current immediate post-harvest handling methods, when undertaken in line with the Code of Practice for the Northern Territory Mud Crab Fishery, can be an effective method of holding crabs. However, working closely with industry stakeholders, we were able to demonstrate the benefits of additional alternative handling practices through the supply chain. Feedback from harvesters, wholesalers and the retail sector has indicated increased survival and improved vigor of mud crabs when the alternative handling methods have been employed. Industry has reported a 50% reduction in mortalities in the processor sector and a further 10% reduction at retail level. Mud crabs reach the consuming public in premium quality, raising public confidence and perception of the commercial operators.
The information from this research provides a sound basis for commercial decisions with respect to operational procedures. It has created an ability to supply distant markets, including export markets, with greater confidence. Sustained adoption of the results from this project will also result in improved market perception of mud crab quality, leading to greater market demand and increased revenue for the industry. Increased survival of the crabs within this fishery not only improves resource sustainability, but also improves public perception of commercial activities within the mud crab fishery. Greater resource sustainability has flow on effects for the recreational sector and the indigenous community.
Mud crabs are a high value commodity and are harvested in remote coastal locations in the northern half of Australia. The fishery has a low production and there is little opportunity to increase catch volume. The maximum revenue potential from live mud crabs must be realised for the industry to remain successful. Losses can be unacceptably high, varying between 4 and 10%, with up to 35% mortality in extreme situations. A 10% loss to the Northern Territory (NT) mud crab fishery represents 60-100 tonnes of crabs with a retail value of ~$2 million/year. The supply chain from harvest to market for mud crabs from the NT fishery can be up to 15 days. The physical demand on the crabs is extreme as they are transported and distributed in air. The market requirement is that the crabs arrive in a lively and vigorous condition.
was strongly influenced by changes in the metabolism of the crabs, but unlike many other crustaceans, mud crabs do not suffer acidosis. Urate and ammonia levels in the blood did not correlate directly with stress in the crabs. However, the rate of ammonia excretion after the crabs were returned to water was strongly indicative of the stress experienced by the animals.
The live mud crab supply chain was evaluated to determine the handling steps that caused most stress to the crabs. The major causes of stress include emersion (holding crabs out of water), handling disturbance and temperature changes. As mud crabs are aquatic animals, emersion results in several changes: respiratory metabolic stress because the crab is unable to obtain sufficient oxygen, accumulation of ammonia which is toxic to the crab and dehydration of the animal. When mud crabs are emersed, but held quietly, undisturbed and in a moist environment, stress levels are low. Dehydration is a significant factor as the consequent water loss from the crabs reduces the total weight of a crab which has implications for the all sectors of the industry with respect to crab revenue return. Mud crabs are handled frequently at different points during the supply chain. Each handling event involves physical movement of the crabs and often a degree of shock, with all such disturbances adding stress to the crabs. If carried out gently and with care, the physical disturbance of the daily checking of the crabs while stored only imposes temporary stress on the crabs, from which they recover quickly. Grading and loading/unloading for transport involves greater physical movement and was found to be stressful to the crabs. A particular stress factor was exposure of the crabs to breeze which caused very high stress levels and resulted in a high proportion of mortalities.
Holding crabs at an appropriate temperature and limiting temperature change is optimal for minimising stress. Sudden variations in temperatures within the supply chain are common and the damp hessian is not always effective in moderating these changes. In this study, mud crabs were held at temperatures between 10°C and 35°C for a two day period to establish what level of stress this caused the crabs. It was concluded that mud crabs best tolerate a temperature range between 25°C and 30°C. Temperatures outside this range impose an increasing amount of stress on the animals and temperatures in the low range (≤15°C) can result in extreme stress.
Knowledge of factors that cause the most stress to mud crabs allowed the development of alternative handling practices to minimise any adverse effects. Working directly with crab harvesters, wholesalers and retailers provided excellent opportunities to select best practices and perform industry trials to demonstrate the handling modifications which benefit the industry. The major recommendation from this study is the inclusion of a recovery step within the distribution chain for live mud crab. It is important to include a purge step of 2-3 hours where the crabs are returned to aerated water to allow excretion of accumulated ammonia. The crabs can then be held in fresh seawater tanks to fully recover.
Feedback from harvesters, wholesalers and the retail sector has indicated that adopting the alternative handling methods and inclusion of a recovery step has increased survival and improved vigor of mud crabs. The industry has reported a 50% reduction in mud crab mortality rate.
KEYWORDS:
Table of Contents
1 Background...1
2 Need ...3
3 Objectives...4
4 Methods ...5
4.1 Sampling and preparation of mud crab haemolymph ...5
4.2 pH ...6
4.3 Total protein (spectrophotometric method) ...6
4.4 Total protein (Refractive Index, RI) ...6
4.5 Total protein (conversion of refractive index) ...6
4.6 Glucose...7
4.7 Ammonia...7
4.8 Ammonia of purge water ...7
4.9 Uric acid ...8
4.10 Temperature logging...8
4.11 Humidity logging ...8
4.12 Lactic acid ...8
5 Results and Discussion ...9
5.1 Harvesting and handling through the live mud crab distribution chain...9
5.1.1 Harvesting/handling operations ...9
5.1.2 Transport from harvest location to wholesaler ...10
5.1.3 Pack-out to live market ...11
5.1.4 Importance of temperature during storage and transport stages...12
5.1.4.1 Adelaide River...13
5.1.4.2 Wearyan River ...16
5.1.5 Summary...20
5.2 Trend analysis of commercial mud crab data ...21
5.2.1 The Fishery ...21
5.2.2 Data source...23
5.2.3 Compromised crabs...24
5.2.4 Temperature and rainfall correlations with mud crab grade...28
5.2.4.1 Temperature ...28
5.2.4.2 Rainfall ...29
5.2.4.3 Harvesting region...31
5.2.5 Summary...36
5.3 Stress indicators ...37
5.3.1 Mud crab physiology ...37
5.3.1.1 Moulting cycle ...37
5.3.1.2 Vigour index ...38
5.3.2 Mud crab metabolism...39
5.3.3 Biochemical indices ...39
5.3.3.1 Glucose...40
5.3.3.2 Lactate ...41
5.3.3.3 Haemolymph pH ...44
5.3.3.4 Uric acid ...48
5.3.3.5 Ammonia...49
5.3.3.5.1 Ammonia in mud crab haemolymph ...50
5.3.3.7 Haemolymph colour...56
5.3.4 Summary ...57
5.4 Stress factors ...58
5.4.1 Introduction ...58
5.4.2 Current distribution chain...59
5.4.2.1 Seasonal differences ...60
5.4.2.1.1 Total protein in crab haemolymph ...60
5.4.2.1.2 Haemolymph pH ...61
5.4.3 Harvest, handling and transport chain ...62
5.4.3.1 Haemolymph biomarkers...64
5.4.4 Major stress factors along the handling chain ...71
5.4.4.1 Emersion...71
5.4.4.1.1 Crabs held emersed ...71
5.4.4.1.2 Dehydration ...73
5.4.4.1.3 Weight loss in emersed crab ...74
5.4.4.2 Disturbance...77
5.4.4.2.1 Handling for sorting and grading...77
5.4.4.2.2 Movement shock...79
5.4.4.2.3 Animal aggression ...80
5.4.4.2.4 Annoyance and increased activity ...82
5.4.4.2.5 Noise...84
5.4.4.2.6 Breeze ...85
5.4.4.3 Temperature ...88
5.4.4.3.1 Temperature change ...88
5.4.4.3.2 Effect of storage temperature on mud crabs ...89
5.5 Modified handling procedures...93
5.5.1 Background...93
5.5.2 Alternative holding systems ...93
5.5.2.1 Effect of spray or dip on stress levels ...94
5.5.2.2 Effect of dip duration on stress levels in mud crabs ...98
5.5.2.3 Inclusion of a recovery step within supply chains ...101
5.5.2.4 Comparison of a salt water or fresh water recovery dip...105
5.5.2.5 Alternative holding system proposed by harvester ...111
5.5.2.6 Confirmation of benefits from dipping daily...111
5.5.2.7 Recovery procedures developed ...113
5.5.2.8 Recovery and short term holding trials with Brisbane retailer...114
5.5.3 By request from industry: Cooking and cooling mud crab ...115
6 Benefits and Adoption ... 120
6.1 Crabs held emersed in various sectors of the industry ...120
6.1.1 Darwin wholesaler and retailer ...120
6.1.2 Brisbane local retailer (1)...121
6.1.3 Brisbane local retailer (2)...121
6.1.4 Brisbane seafood retailer (3) ...121
6.1.5 Brisbane seafood retailer (4) ...122
6.1.6 Melbourne seafood restaurant...122
6.1.7 Bundaberg mud crab farmer...123
6.1.8 Seafood Festival – mud crab races ...123
6.2 Crabs held immersed in various sectors of the industry ...124
6.2.1 Darwin distributor...124
6.2.2 Cairns distributor and wholesaler ...124
6.2.3 Mackay wholesaler and retailer ...125
6.2.4 Brisbane retail seafood market ...125
6.2.5 Brisbane Chinese restaurant specialising in live seafood...126
6.3.1 Brisbane wholesale and retail supplier ...126
6.4 Crabs held emersed with daily dips ...127
6.4.1 Mackay wholesaler and retailer ...127
6.4.2 Bundaberg distributor...127
6.5 Summary of improved handling practices ...128
7 Further Development...138
8 Planned Outcomes ...139
9 Summary ...140
9.1 Mud crab live supply chain...140
9.2 Stress biomarkers ...141
9.2.1 Vigour index ...141
9.2.2 Haemolymph glucose ...141
9.2.3 Haemolymph lactate ...142
9.2.4 Haemolymph pH ...142
9.2.5 Haemolymph urate...142
9.2.6 Haemolymph ammonia ...142
9.2.7 Ammonia excretion rate ...143
9.2.8 Total protein in haemolymph...143
9.3 Stress factors ...143
9.3.1 Emersion...143
9.3.2 Handling...144
9.3.3 Temperature ...145
10Conclusion ...146
10.1 Mud crab live supply chain...146
10.2 Stress biomarkers ...146
10.3 Stress factors ...146
10.4 Handling recommendations ...147
11References ...148
12Appendix 1: Intellectual Property...153
List of Tables
Table 5.1. Commercial grades used for mud crabs. ...12
Table 5.2. Commercial grading categories for less than ‘A’ grade mud crab...23
Table 5.3. Data recording BoM stations nearest main harvesting areas...28
Table 5.4. Vigour index for mud crabs used to assess liveliness...38
Table 5.5. Haemolymph glucose levels in crabs subjected to different stress. ...41
Table 5.6. Circulating lactic acid in response to disturbance stress...43
Table 5.7. Changes in ammonia levels in crab haemolymph...50
Table 5.8. Total haemolymph protein in crabs after subjection to different levels of stress...55
Table 5.9. Wearyan River supply chain stages. ...63
Table 5.10. Stress biomarkers in the haemolymph of crabs emersed for different periods...72
Table 5.11. Vigour index of crabs held dry in crate. ...74
Table 5.12. Haemolymph biomarkers in crabs subjected to daily handling or held undisturbed...78
Table 5.13. Haemolymph biomarkers in crabs with claws tied or untied (n=20). ...81
Table 5.14. Haemolymph pH in crabs exposed to noise...84
Table 5.15. Triangle test on meat from crabs recovered in different waters. ...109
Table 5.16. Haemolymph parameters in crab treated with a 15 min dip and crab held as per commercial practice. ...112
Table 5.17. Haemolymph values for 15 minute and 2 hours dipped crabs. ...112
List of Figures
Figure 5.1. Temperature of mud crabs held in hessian and crates at camp. ...13
Figure 5.2. Logged temperatures of crabs held at Adelaide River in September...14
Figure 5.3. Temperatures of crab logged between Sunday and Tuesday...15
Figure 5.4. Temperatures of crabs logged from camp holding at the Wearyan River to a Darwin wholesaler facility. ...17
Figure 5.5. Temperatures of mud crabs through the supply chain from the Wearyan River to Darwin...18
Figure 5.6. Temperature of crabs from capture through to arrival in Brisbane...19
Figure 5.7. Temperature of crabs from capture through to arrival in Brisbane...19
Figure 5.8. Location of major harvest areas for mud crabs in the Northern Territory showing proximity to Darwin...22
Figure 5.9. Catch and corresponding freight data for the NT Mud Crab Fishery from 1989-2005. (Reproduced from Ward et al, 2008 with the kind permission of Tim Ward)...22
Figure 5.10. Percentage of mud crab not suitable for further distribution against the total mud crab weight supplied to wholesale sector. ...24
Figure 5.11. Commercial grade categories for mud crabs by month with the total crabs supplied to wholesaler illustrated...25
Figure 5.12. The proportion of crab graded as commercially unsuitable crab, 2002 to 2005. ...27
Figure 5.13. Percentage of male mud crab within the total weight of crabs supplied to the wholesale sector...27
Figure 5.14. Mean monthly temperatures for main harvesting areas. ...28
Figure 5.15. Percentage of compromised crab against temperature differential...29
Figure 5.16. Total monthly rainfall for Borroloola, 1995-2004. ...30
Figure 5.17. Mean monthly rainfall for all main harvesting areas against total percentage of compromised crab...30
Figure 5.18. Compromised crab – Bynoe Harbour area...32
Figure 5.19. Compromised crab – Blue Mud Bay area. ...33
Figure 5.20. Compromised crab – Roper River area...34
Figure 5.21. Compromised crab – MCArthur River area...35
Figure 5.22. Compromised crab by major harvest region. ...36
Figure 5.23. Haemolymph glucose levels in rested mud crab (n = 341). ...40
Figure 5.24. Haemolymph glucose levels in rested and stressed crabs (n=425)...41
Figure 5.25. Haemolymph lactic acid levels in rested mud crabs (n = 462). ...42
Figure 5.26. Lactic acid response in individual mud crabs immediately post-emersion...43
Figure 5.28. Haemolymph pH of ‘rested’ and stressed mud crabs (n = 414). ...45
Figure 5.29. Haemolymph pH after emersion and recovery of individual crabs...45
Figure 5.30. Lactate and pH change when crabs are subjected to different stresses sequentially (n = 8)...46
Figure 5.31. Blood pH of individual crabs over the first 5 minutes immediately post-emersion...46
Figure 5.32. Blood pH of individual crabs during 50 minutes immediately post-emersion...47
Figure 5.33. Haemolymph pH of individual crabs during 2 hours immediately post-emersion...47
Figure 5.34. Uric acid levels in mud crab haemolymph (n = 110). ...48
Figure 5.35. Uric acid levels from trials of imposed stress to the crabs (n = 8)...49
Figure 5.36. Ammonia present in crab haemolymph before and after 3 days emersion...51
Figure 5.37. Ammonia excretion upon re-immersion after 3 days air exposure...52
Figure 5.38. Excretion rates of ammonia by crabs subjected to different stresses. .52 Figure 5.39. Ammonia excretion rates for crabs held at different temperatures for 48 hours prior. ...53
Figure 5.40. Total haemolymph serum protein in replicate trials (n = 10) at different times of day. ...55
Figure 5.41. Total protein during moult cycle and a starved crab (n = 318). ...56
Figure 5.42. Total haemolymph protein in individual crabs harvested in different seasons. ...60
Figure 5.43. Total circulating haemolymph protein of crabs obtained at different months...61
Figure 5.44. Haemolymph pH of crabs harvested in wet and dry seasons. ...61
Figure 5.45. Temperature of crabs during simulation trials. ...64
Figure 5.46. Relative humidity in middle of crab crate during simulation trials...64
Figure 5.47. Haemolymph glucose levels during simulation trials...65
Figure 5.48. Haemolymph lactate levels during simulation trials. ...65
Figure 5.49. Haemolymph pH of crabs at beginning and end of distribution chain. .66 Figure 5.50. Haemolymph urate levels during simulation trials...67
Figure 5.51. Haemolymph ammonia levels during simulation trial 1. ...68
Figure 5.52. Seawater ammonia levels from excretion by crabs after 90 minutes...68
Figure 5.53. Total protein levels in haemolymph during distribution simulation trials. ...69
Figure 5.54. Haemolymph biomarkers in mud crabs during simulated distribution chain...70
Figure 5.55. Ammonia efflux rates after different periods of emersion...73
Figure 5.56. Cumulative weight loss in mud crab emersed for 24 hours. ...74
Figure 5.58. Cumulative weight loss from crabs during the first hour of emersion...76
Figure 5.59. Cumulative weight loss from crabs held emersed, held under different conditions. ...77
Figure 5.60. Haemolymph pH of disturbed and undisturbed crabs. ...79
Figure 5.61. Haemolymph lactate levels in disturbed and undisturbed crabs. ...80
Figure 5.62. Glucose, lactate and pH levels in annoyed untied crabs (n = 10). ...83
Figure 5.63. Haemolymph pH in wind-blown crabs. ...85
Figure 5.64. Haemolymph lactate levels in wind-blown crabs...86
Figure 5.65. Haemolymph glucose levels in wind-blown crabs. ...86
Figure 5.66. Mean weights of draught-free and wind-blown crabs (n = 10). ...87
Figure 5.67. Temperature of crabs held as per commercial practice. ...88
Figure 5.68. Haemolymph pH of crabs exposed to different temperatures. ...90
Figure 5.69. Haemolymph glucose levels of crabs exposed to different temperatures. ...91
Figure 5.70. Ammonia excretion in seawater after temperature exposures. ...92
Figure 5.71. Haemolymph glucose in crabs held under different conditions for 5 days...95
Figure 5.72. Excretion of ammonia immediately after re-immersion following 5 days held under different conditions. ...96
Figure 5.73. Temperature of mud crabs held under different holding conditions (times of water addition or dip indicated by arrows). ...97
Figure 5.74. Excretion of ammonia immediately after re-immersion following 14 days held under different conditions. ...98
Figure 5.75. Haemolymph glucose levels in crabs after different dipping times...100
Figure 5.76. Haemolymph glucose levels in individual stressed crabs and after recovery in holding tank (n = 16). ...102
Figure 5.77. Mean haemolymph pH in crabs in the post recovery period. ...104
Figure 5.78. Average haemolymph glucose in crabs in the post recovery period. .104 Figure 5.79. Ammonia excretion upon re-immersion...105
Figure 5.80. Haemolymph pH in crabs held in salt or fresh water...107
Figure 5.81. Haemolymph pH in crabs during recovery. ...107
Figure 5.82. Haemolymph glucose in crabs held in salt or fresh water. ...108
Figure 5.83. Excretion of ammonia in recovery waters. ...109
Figure 5.84. Depletion of oxygen by crabs in purge water (n = 3)...113
List of Plates
Plate 4.1. Insertion point and syringe positioning and angle of the needle required to
extract mud crab haemolymph. ...5
Plate 5.1. Mud crab showing claws tied. ...9
Plate 5.2. Mud crab stored at harvest camp...10
Plate 5.3. Typical mud crab locations...10
Plate 5.4. Grading mud crabs in Darwin...11
Plate 5.5. Mud crabs packed out in cartons for air-transport to market...12
Plate 5.6. Mud crabs as packed in crate at crab camps...16
Plate 5.7. Colour range of haemolymph samples. ...57
Plate 5.8. Haemolymph loss from mud crab. ...81
Plate 5.9. Aggressive reaction of a mud crab...82
Plate 5.10. Crab holding conditions for spray system. ...94
Plate 5.11. Water sample being taken for ammonia efflux analysis...99
Plate 5.12. Active crabs in aerated purge tanks...103
Plate 5.13. Crabs in commercial steamer and crabmeat pickers in action...106
Plate 5.14. Bubbles from mud crab mouth that occurs upon re-immersion. ...110
Plate 5.15. Water flowing from crab mouth during recovery step...114
Plate 5.16. Probe inserted to crab centre...115
Plate 5.17. Logging temperature of crabs. ...115
Plate 6.1. Crabs packed for interstate transport...124
Plate 6.2. Industry recovery tanks. ...124
1 Background
The mud crab (Scylla serrata) is the basis of a highly valuable resource for commercial, recreational and indigenous interests in the Northern Territory. The commercial wild-harvest fishery alone provided a total landed value of over $10 million in 2000/2001. With catch volume dropping significantly in recent years, the sustainability of revenue from the resource relies heavily on optimising its use. The mud crab fishery in the Northern Territory is based predominantly in remote locations often with harsh environmental conditions and limited, if any, infrastructure. The majority of crab fishers work from dinghies and semi-permanent land-based camps where the crabs are stored prior to transport to Darwin. Crabs are caught in pots which remain set 24 hours a day and crab fishers service the pots one or more times per day depending on the tides. Individual mud crabs are checked for legal size and shell hardness, with those that are berried, undersize or recently moulted returned to the water. Crabs are tied to restrict claw movement and minimise damage either at the point of capture or after return to base camp. The live crabs are held at camp under different storage conditions according to the operator, and then generally transported once per week to wholesalers in Darwin. The basic commercial principle for holding crabs is to store them in a dark, shady, moist state out of the water. Crabs are transported to Darwin by road in trucks, usually inside crates lined with a damp hessian bag. From the more remote crab fishing areas, the transport distance can be considerable. At the wholesale/market premises the crabs are repacked in waxed cardboard or foam boxes for shipment interstate or to export markets. Crabs are held at the marketing premises for varying lengths of time according to trans-shipment timing and arrangements.
In the NT, the mud crab resource is harvested and managed sustainably, from both an ecologically and an economic perspective. This has developed through a concerted effort from both NT Fisheries Management and Research Divisions, as well as a strong commitment from the industry itself. There is continuing commitment to the robustness of the fishery by the NT Fisheries Research and the FRDC, as evidenced by the recently funded abundance and habitat study of mud crab populations (Hay et al. 2005).
While the resource management of this fishery is a prime example in the field, profitability within the fishery as a whole may not be reaching its full potential due to high morbidity, at times, amongst post-harvest animals.
Post-harvest product mortality is an issue in all live-market fisheries, with the severity of losses and sustainability of resource issues dictating that causes and remedies be found. A notable example, and one of similar implication to the NT mud crab fishery, is the Western Australia rock lobster industry where post-harvest mortalities caused unpredictable and enormous loss of revenue. Research conducted by Innovative Food Technologies (IFT), QDPI&F (Paterson et al. 2001) concluded that mortality was directly due to post-harvest stress within the animal and physiological stress indicators were investigated to provide an index for survival predictability. Additionally, alternative handling procedures were developed to minimise stress to the lobsters. Adoption of these procedures has resulted in greater post-harvest survival of the lobsters in the market.
reducing handling processes immediately post-capture was the critical step in minimising stress to the animal (Paterson et al. 1994). The successful outcomes of this research has resulted in sustainable and profitable use of the spanner crab resource and ensured a robust live-market industry.
In a similar vein, it is considered the losses caused by mortalities within the mud crab fishery can be minimised through development of specific simple post-harvest handling techniques at various points in the harvest-to-market chain. In general, crustaceans are not well equipped physiologically to survive in air and excretion of carbon dioxide is the limiting factor when the animals are out of water. The accumulation of carbon dioxide causes a symptomatic condition of acidosis in the animal because carbon dioxide dissolves readily in the blood causing the pH of the blood to drop severely. This syndrome is considered to be a major cause of mortality when crustaceans are removed from water for extended periods (Vermeer 1987; Whiteley and Taylor 1992).
In contrast to other crab species, mud crabs are known to leave the water voluntarily under certain circumstances. Their metabolic systems are apparently more adaptable to ‘breathing’ in air. Compared to other crustaceans, the mud crab has relatively high oxygen consumption in air and is able to handle the correspondingly high rates of carbon dioxide accumulation, along with an ability to reverse the acidosis condition (Varley and Greenaway 1992). This imparts an enormous operational advantage in successful post-harvest handling of these animals.
Certain physical factors are likely to have a bearing on the survival rates of mud crabs. For example, it is noted by the industry that mortalities are greater when seasonal temperatures are high which has been illustrated in investigative work by (Gillespie and Burke 1992). These researchers noted that at high temperatures, dehydration was the major determining factor in mortality as evidenced by weight losses recorded at death. They also found that temperature stress itself affected survival when mud crabs were at a temperature of 32oC, with such animals dying relatively quickly and often regurgitating a black fluid, taken to be an indicator of stress. With mud crabs from Queensland (Hill 1982), the optimum conditions for transporting the animals are a temperature range of 16o-20oC and in saturated humidity. Such conditions are rare during the wet season in the northern Australia. The physiological condition, moult stage, of the crab at capture also contributes to mortality with post-moult crabs being most susceptible. To increase the post-harvest survival of mud crabs, the contribution of harvest, holding and transport stress to animal mortality needs to be fully understood.
2 Need
The mud crab fishery in the northern half of Australia is a relatively low production fishery with a high market value of product. There is little opportunity to increase catch volume and retain a sustainable fishery, consequently full revenue potential from the fishery must be realised for the industry to remain successful.
The viability of the mud crab fishery depends solely on the live seafood market with dead or ‘slow’ crab unable to be sold. Currently, post-harvest mortalities of animals through the supply chain are limiting the sustainable use of the mud crab resource. Losses due to mortality can be unacceptably high, varying between 4-10% at the wholesale level dependent on season and transport delays. This accounts for a loss in excess of 60 tonnes of crab annually with a value of $1 million. In extreme circumstances due to operational breakdowns, there have reportedly been post-harvest mortality rates of up to 35%. Additionally, a further 10% is frequently lost at retail level. Such losses not only negate the viability of the vertical supply chain, but also confer perceptional lack of responsibility to the sustainable use of the resource by industry members.
High mortality rates in mud crab can be minimised through development of appropriate, practical and cost-effective post-handling procedures along the harvest-to-market supply chain. This project sought to address this need.
3 Objectives
• Analyse available industry data (including anecdotal information from commercial operators) for correlation between high mortality rates and specific environmental or conditional factors
• Document current mortality data in specifically designed logs to capture all possible factors
• Establish physiological factors and stress level indicators for harvested mud crabs
• Determine stress contributed by current post-harvest practices
• Advance strategies for through-chain product traceability to differentiate crabs
• Develop specific cost-effective handling procedures which minimise stress to crabs
• Update industry of our research findings through participation in trials
4 Methods
The following methods are the standard analytical techniques used in all trials undertaken in this project.
4.1 Sampling
and
preparation of mud crab haemolymph
A 22G x ¾” Terumo needle attached to a 3ml Terumo syringe was inserted at the synapse where the 3rd walking leg (from the front) joins the carapace. The leg joint must be extended to stretch out the membrane and reveal a white triangular marking. The needle was inserted 5-10mm into an interstitial cavity beneath the tip of the triangular marking on the membrane of the leg joint (Plate 4.1) and angled to follow an imaginary line to the apex of the belly flap. Haemolymph (1.5ml) was withdrawn slowly to avoid collapsing the cavity.
Plate 4.1. Insertion point and syringe positioning and angle of the needle required to extract mud crab haemolymph.
This sample was immediately dispensed into two 1.5ml graduated microcentrifuge tubes (QSP cat No.509-GRD-Q) one of which was held in crushed ice for further testing lactic acid (1.0ml sample). The second tube containing 0.5ml was used to test pH immediately before being placed on crushed ice for glucose, ammonia and uric acid analysis. A haemolymph sample was directly dispensed (1-2 drops) onto the handheld refractometer and measured immediately before clots formed.
4.2 pH
The pH of freshly sampled haemolymph was measured immediately by part filling a 1.5ml graduated microcentrifuge tube (QSP cat No.509-GRD-Q) with 0.5ml of haemolymph directly from the sampling syringe. This was measured within 15 seconds using a TPS hand-held pH meter (WP80) fitted with an Ionode intermediate junction pH electrode (TPS part No. 121236) calibrated at pH 4 and pH 7. This shape electrode was used because it fits the profile of the microcentrifuge tube, excluding air and only requiring 0.5ml sample size. The probe was gently inserted into the microcentrifuge tube containing the haemolymph. This forces any trapped air out until the haemolymph rises to the top of the tube ensuring the potassium junction of the glass bulb is completely covered. Results were manually read from the display once the reading had stabilized. The pH probe was cleaned with distilled water and wiped dry after each sample.
4.3 Total protein (spectrophotometric method)
Total haemolymph protein was analysed by preparing a haemolymph sample as per 4.1. A haemolymph sample (0.02ml) was analysed using a Randox assay kit TP245 as per instructions (30 minutes incubation at 20-25°C, 30 second timed intervals between samples). Fixed absorbance was read at 546nm using a Unicam Helios Alpha spectrophotometer with a 1ml quartz cuvette. Samples were read alongside a sample blank and standard (provided with the kit) and calculations were made as per the Randox kit instructions. Results were expressed as mg/ml.
4.4 Total protein (Refractive Index, RI)
The RI protein of freshly sampled haemolymph was measured immediately by placing 1-2 drops (enough haemolymph to cover the prism without air bubbles) directly from the sample syringe onto the glass prism of the hand-held refractometer (Atago model SUR-NE calibrated with distilled water). The refractometer lid was then closed before the haemolymph clotted and held towards a fluorescent strip light to assist reading the internal scale accurately. Results were manually recorded from the refractive index scale in nD units. This method was similar to that reported by (Alexander and Ingram 1980).
4.5 Total protein (conversion of refractive index)
Haemolymph was sampled as per 4.1 and RI determined as per 4.4. This RI value was then converted using the equation below, calculated from the standard curve of RI plotted against total protein derived using a spectrophotometer (Figure 4.1). The method above can be performed more quickly than the spectrophotometer method with a result obtained within one minute, (Paterson et al. 2001).
y = 4568.3018x - 6104.407 R2 = 0.9770
n=40
0 20 40 60 80 100 120
1.3400 1.3450 1.3500 1.3550 1.3600
Hemolymph RI
Tot
a
l pr
ot
e
in
(m
g/
m
l)
Figure 4.1 Standard curve of refractive index against total protein.
4.6 Glucose
Haemolymph glucose was analysed by preparing haemolymph sample as per 4.1. A haemolymph sample (10µl) was analysed using Randox assay kit GL2623 as per instructions, (semi-micro method, 25 minutes incubation at 22-25°C, 30 second timed intervals between samples). Fixed absorbance was read at 500nm using a Unicam Helios Alpha spectrophotometer with a 1ml quartz cuvette. Samples were read alongside a sample blank and standard (as provided with the kit) and calculations made as per Randox kit instructions. Results were expressed as mmol/L.
4.7 Ammonia
Haemolymph ammonia was analysed by preparing haemolymph sample as per 4.1. The haemolymph sample (0.1ml) was analysed using Randox assay kit AM 1054 (semi-micro procedure, 5 minutes incubation at 22-25°C, 30 second timed intervals between samples). Fixed absorbance was read at 340nm using a Unicam Helios Alpha spectrophotometer with a 1ml quartz cuvette. Glutamate dehydrogenase (0.01ml) was then added to all samples, standard (supplied with the kit) and blank before a further 5 minutes incubation at 22-25°C. Samples were read again at 340nm (30 second timed intervals) and differential calculations were made as per Randox kit instructions. Results were expressed as g/L.
4.8 Ammonia of purge water
A sample (0.1ml) of purge water was analysed for ammonia using Randox assay kit AM 1054 (semi-micro procedure, 5 minutes incubation at 22-25°C, 30 second timed intervals between samples). Fixed absorbance was read at 340nm using a Unicam Helios Alpha spectrophotometer with a 1ml quartz cuvette. Glutamate dehydrogenase (0.01ml) was then added to all samples, standard (supplied with the kit) and blank before a further 5 minutes incubation at 22-25°C. Samples were read again at 340nm (30 second timed intervals) and differential calculations made as per Randox kit instructions. Results were expressed as g/L.
4.9 Uric
acid
Haemolymph uric acid was analysed by preparing haemolymph sample as per 4.1. A haemolymph sample (20µl) was analysed using Randox assay kit UA 230 as per instructions (15 minutes incubation at 22-25°C, 30 second timed intervals between samples). Fixed absorbance was read at 520nm using a Unicam Helios Alpha spectrophotometer with a 1ml quartz cuvette. Samples were read alongside a sample blank and standard (provided with the kit) and calculations were made as per Randox kit instructions for serum or plasma. Results were expressed as µmol/L.
4.10 Temperature logging
Temperature logging was tested using ibutton thermocron temperature loggers. Temperature range of the loggers is -40 to 85°C with a resolution +/- 0.5°C. Accuracy was tested against a “NATA” certified standard thermometer. These waterproof loggers were placed in direct contact with the crabs during transit and storage to assess temperature conditions. Temperature data was retrieved using USB reading fobs with eTemperature V5.10 software (onsolution.com.au).
4.11 Humidity logging
Humidity logging was tested using Tinytag ultra TGU-1500 temperature/humidity loggers range 0 – 95%/ -30°C – 50°C. Testing was carried out by placing a logger amongst the stored crab under the layer of hessian. The logger was placed within an open ended piece of PVC tube to protect from damage. Data was retrieved using a communication port adapter with Gemini GLM software v2.8 (www.hdl.com.au).
4.12 Lactic acid
5 Results
and
Discussion
5.1 Harvesting and handling through the live mud crab
distribution chain
Project Objective
Analyse available industry data (including anecdotal information from commercial operators) for correlation between high mortality rates and specific environmental or conditional factors.
5.1.1 Harvesting/handling operations
After clearing all pots, harvesters return to camp and crabs are sorted and stored in plastic prawn crates (40kg size) and again covered with damp heavy hessian sacking (Plate 5.2). The sacking is carefully folded interlocked to retain maximum moisture for the crabs and to exclude flies, which cause a major quality problem when crabs become ‘riced’ (fly larvae contamination).
Plate 5.2. Mud crab stored at harvest camp.
Crab crates are stored in open-air in a damp cool position under shade, in the simplest form this is under a tree or some form of constructed shade cover. Other camps have a purpose-built shade cloth enclosure and camps at the Wearyan River and the mouth of the McArthur River had a dedicated holding shed, one of which contained an overhead sprinkler system for spraying the crabs. The sacking is checked regularly for dampness. Information supplied from harvesters advised that during the ‘dry’ season (winter months: May-September) the sacking was not sprayed with water in the late afternoon as evaporation causes too low a temperature for the crabs overnight. Temperature and moisture are recognised by the harvesters as highly significant factors in holding mud crab emersed for extended periods.
5.1.2 Transport from harvest location to wholesaler
Two geographically extreme harvest locations studied in detail as the handling and transport chains for these are inherently very different. Most harvest locations fall into similar categories as the two selected (Plate 5.3):
Adelaide River – similar to Bynoe Harbour and the Finniss River
Wearyan River – similar to McArthur River, Roper River and Blue Mud Bay
Adelaide River: Crabs are held at camp for up to 6 days and taken to Darwin once a week on a closed truck. The transport time is about 1.5-2 hours duration on smooth track and road, apart from a short 5km section immediately out from the campsite that can be quite rough and boggy after rain. A rough ride is likely to add trauma for the crabs and raise stress levels. Crabs may be taken in more frequently depending on catch volumes.
Wearyan River: Crabs are held for up to 7 days, depending when captured. Once a week the crates are loaded onto an open four wheel drive vehicle and transported out to Borroloola, about 2 hours distant. This transport section includes demanding four wheel driving for the first hour out of camp, followed by corrugated roads into Borroloola. At Borroloola, the crab crates are transferred to a cool room (~16oC). Time of storage at this temperature varies according to truck pick-up time co-ordination (and weather). From Borroloola to Darwin the crab crates are transported in a refrigerated truck that also does a crab pick up from King Ash Bay on the McArthur River about 1 hour north-east of Borroloola (the collection point for crab harvested from the mouth of the McArthur River.). Time from Borroloola to Darwin is around 15 hours and is all basically smooth road. Transport is usually timed to arrive in Darwin in the early hours of a Tuesday morning to allow for pack-out to meet appropriate flights to markets. On arrival in Darwin (often 0100-0400), crabs are usually left in the truck with refrigeration switched off. Crabs remain in the truck until ~0600 when crates are transferred inside the air-conditioned facility (~22oC) for grading and pack-out prior to transport to market.
5.1.3 Pack-out to live market
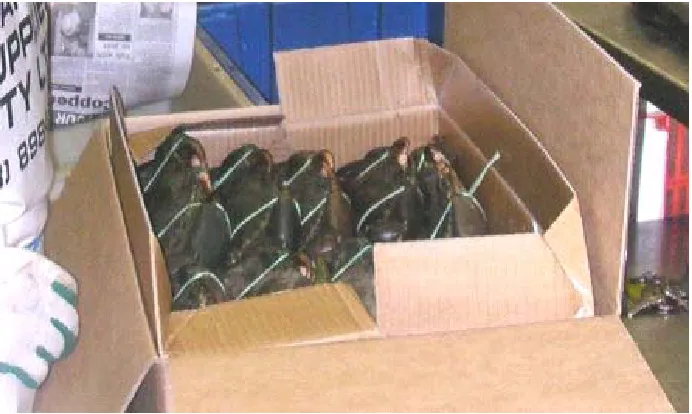
At the wholesaler/pack-out facility, crabs are first lightly rinsed with town supply water to remove mud and debris. This also helps rehydrate the crabs which can suffer desiccation in the refrigerated air during the trip from Borroloola. The condition of the crabs is then assessed by experienced graders (Plate 5.4) and categorised into the following grades (Table 5.1).
Table 5.1. Commercial grades used for mud crabs.
Grade Description
Grade A or B lively/robust – often according to fullness (of meat) One claw lively crab but missing a claw through damage
Slow judged by eye and antennae movement and force resistance exhibited from claws and legs upon handling CUC commercially unsuitable crab (soft-shell, little meat
present) illegal to sell Discard Dead or diseased
Crabs are packed into waxed cardboard cartons which have small ventilation holes at the top of the carton. They are packed bottom end down with eyes and gills uppermost (Plate 5.5). Depending on crab size, there may be two layers within a carton and these are separated by clean paper or cardboard. Once packed, cartons are held briefly within the chilled facility ready for transport to the airport by truck or van (less than a 30 minute trip on sealed roads).
Plate 5.5. Mud crabs packed out in cartons for air-transport to market.
The mud crabs are flown out to interstate markets and may be transferred for further flights according to final a destination market. For the crabs retained in our study, cartons were flown direct from Darwin to Brisbane where they were collected and held briefly in the processing plant at 22oC before assessment.
5.1.4 Importance of temperature during storage and transport stages
This project has found that change in temperature is one of the most important factors that can induce stress in mud crabs. Throughout harvest, holding and transport to the pack out phase, mud crabs are subjected to large fluctuations in temperature. For example, during the ‘dry’ season, diurnal temperature differences are large and can range from 30o-32oC to as low as 13o-16oC overnight.
This was evidenced by their careful attention to keeping the crabs damp and cool during the holding period of crabs at camps prior to on-shipment. However, while aware it was important, harvesters expressed lack of knowledge of how the crabs temperature changed with ambient patterns and degree of moisture retained in the hessian etc. Hence, it was of value to monitor crab temperatures during both storage at camp and through transport stages.
Mud crabs are often at elevated temperature at the point of harvest due to necessary fishing placement of pots in near-shore waters which are subject to large tidal changes. This dictates that crabs are frequently sitting in very shallow waters at time of clearance and may have been for an hour or two. Little can be done to overcome this circumstance. Once at base camp however, the current holding method is effective in decreasing the crab temperature and holding it reasonably constant, despite fluctuations in ambient temperatures (Figure 5.1).
12 14 16 18 20 22 24 26 28
12 PM 12 AM 12 PM 12 AM 12 PM 12 AM 12 PM 12 AM 12 PM 12 AM 12 PM 12 AM 12 PM 12 AM Time of Day (May)
T
e
m
p
er
at
ur
e (
°C
)
Ambient Top Middle Bottom
Figure 5.1. Temperature of mud crabs held in hessian and crates at camp.
5.1.4.1 Adelaide River
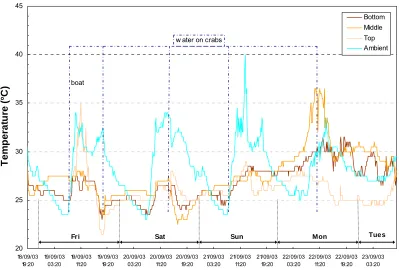
Temperatures of mud crabs logged during storage at Adelaide River are present in Figure 5.2. These crabs were stored in lug boxes, lined with damp hessian, in open air on the ground under tree shade. Temperature loggers were placed externally, and within the crate amongst the crabs inside the hessian at positions of bottom, middle and top of crab load.
20 25 30 35 40 45 18/09/03 19:20 19/09/03 03:20 19/09/03 11:20 19/09/03 19:20 20/09/03 03:20 20/09/03 11:20 20/09/03 19:20 21/09/03 03:20 21/09/03 11:20 21/09/03 19:20 22/09/03 03:20 22/09/03 11:20 22/09/03 19:20 23/09/03 03:20 T e m p er at u re ( °C ) Bottom Middle Top Ambient w ater on crabs
boat
Fri Sat Sun Mon Tues
Figure 5.2. Logged temperatures of crabs held at Adelaide River in September.
Mud crabs are known to be nocturnally active and yet the logged data does not evidence greater metabolic activity during night hours (through increased temperature). This suggests that the crabs are already very quiescent after a few hours emersion.
Figure 5.2 shows that crab temperature varies according to the position of the crab within the crate as identified by temperature logged at the top, middle or bottom of the crates (data is averaged from several loggers in each position). In general, crabs in all positions follow a similar temperature change trend, with a few anomalies. Animals positioned at the top of the crate appear to be more affected by external temperature fluctuations. This could be expected as these crabs would have greatest contact to ambient and are closest to evaporation effects of the hessian sacking. The temperature of crabs positioned at the bottom of the crate appears to change in response to ground temperature, suggesting that it may be a useful practice to spray water on the ground surrounding the crates as well as the sacking covering the crabs or have the crates raised to allow air flow underneath.
Figure 5.2 also illustrates an anomaly happening with mid- and bottom-logged crab temperatures from Sunday midnight through Monday (data is expanded in Figure 5.3), where crabs in these positions have temperatures outside the general trend and appear very much hotter than ambient. For the same period, those crabs at the top of the crate seem to follow the usual trend (water spraying produces temperature reduction).
20 25 30 35 40 45
21/09/03 16:40
21/09/03 20:40
22/09/03 00:40
22/09/03 04:40
22/09/03 08:40
22/09/03 12:40
22/09/03 16:40
22/09/03 20:40
23/09/03 00:40
23/09/03 04:40
23/09/03 08:40
T
e
m
p
er
at
u
re (
°C
)
Bottom Middle Top Ambient w ater on crabs
Sun Mon Tues
Figure 5.3. Temperatures of crab logged between Sunday and Tuesday.
From around midnight Sunday through to midday Monday the temperature of crabs positioned in the middle of the crate increases strongly. The crabs at the bottom of the crate show a similar trend but not as intense and a little delayed compared to the mid-positioned crabs. The delay in reaction may again be due to the effects of ground temperature. In contrast, the temperature of the top-positioned crab follows the ‘normal’ fluctuation of between 24oC and 27oC. The large increase in mid-crab temperatures is in contrast to the external temperature and begins to increase well before the day time temperature climbs. It is difficult to determine what is happening with these middle and bottom crabs from the limited data here.
The effect of these stress factors is discussed fully in section 5.4.4 of this report.
5.1.4.2 Wearyan River
The temperature of mud crabs in three separate crates was recorded independently, during August, from the time the crabs returned to camp post-harvest through holding and transport to Darwin. Position of crabs within the crate was identified and the logged data is presented according to temperature logger position (Figure 5.4). Differences in temperature between crabs in different positions within a crate (Plate 5.6.) are not pronounced whilst being held at camp. However, when the crab crates are transported from Borroloola to Darwin in the refrigerated truck, large temperature differences do occur depending on crab position. It is evident from these three graphs that the positioning of the crate within the total load on the truck is also important. As the temperature loggers were distributed between 3 different crates, it is clear that some crabs are colder than others in the same position in one crate compared to another crate. For example, for those crabs logged at the bottom of the crate it would seem that one of the three crates was placed directly on the floor of the truck while the other two were not, but rather stacked on other crates above the floor. Similarly, the mid-crab show different temperature responses according to crate placement. This complicates the transport temperature step but needs addressing as the temperature differences demonstrated here are large.
Figure 5.4. Temperatures of crabs logged from camp holding at the Wearyan River to a Darwin wholesaler facility.
10 12 14 16 18 20 22 24 26 28 30 07 /08 /0 3 00:
30 07 /08
/0 3 12:
30 08 /08
/0 3 00:
30 08 /08
/03 1 2:30
09 /08
/03 0 0:30
09 /08
/03 1 2:30 10 /08 /03 0 0:30 10 /08 /03 1 2:30 11 /08 /03 0 0:30 11 /08 /03 1 2:30 12 /08 /0 3 0 0:30 12 /08 /0 3 1 2:30 Time/date Te m p e ra tur e ( °C )
Bottom of basket 10 12 14 16 18 20 22 24 26 28 30 T e m p er at u re ( °C )
Middle of basket 10 12 14 16 18 20 22 24 26 28 30 Te m p e ra tur e ( °C )
The total temperature picture from harvest to wholesaler is presented in Figure 5.5 and comprises the average of all logged temperatures to illustrate the main events occurring to the mud crab during holding and transport to Darwin phases. The crabs were not logged beyond this point as they were needed commercially to supply buyers.
15 16 17 18 19 20 21 22 23 24 25
12:30 00:30 12:30 00:30 12:30 00:30 12:30 00:30 12:30 00:30
Time
T
e
m
p
er
at
u
re (
°C
)
Thurs Fri Sat Sun Mon Tues
borroloola chiller
15:45 Unload at processor Darw in 6:45
14:30 16:30 pack on truck leave camp
10:45
Figure 5.5. Temperatures of mud crabs through the supply chain from the Wearyan River to Darwin.
There are some points of note illustrated within the data for mud crab harvested at the Wearyan River. The crabs are held at this camp in a dedicated shade shed which is cool and well ventilated. The efficiency of this holding method is shown by the crab maintaining a temperature between 21oC and 23oC throughout fluctuations in ambient. Sunday afternoon the crabs are trucked out to Borroloola and the drop in temperature from corresponds to the crab being placed and held in the chill room. From the large drop and subsequent rise in temperature illustrated during Monday, it is assumed the refrigeration on the truck was not functioning from early Monday afternoon. The crabs were left in the truck after arrival in Darwin and unloaded at 0630 in the morning. At the time of grading, it was noted that the crab were in the same crates as placed in at the Wearyan River camp and there had been little movement amongst the crab since the loggers were in very similar positions to those where they were originally placed. The relative humidity in the crab crates was also logged and found to remain at full humidity (100%) during the time the crab were held at camp.
the fluctuations in ambient. There is a sharp temperature increase from all crabs, beyond that of ambient on Sunday morning and this timing coincides with crab disturbance in handling, sorting and re-crating the crabs for transport to Borroloola. At Borroloola the crabs were cooled down in the cool room used as a store depot. Crabs were taken out late Monday afternoon and trucked to Darwin. They were then flown down to Brisbane on the midnight flight and arrived around 0600 hours Wednesday morning.
Figure 5.7 shows a very similar pattern of temperature change during the transport chain although, these crabs were logged for a longer period at the Wearyan River base camp. Again the same cooling and re-warming trends occur during storage at Borroloola and trucking to Darwin. Relative humidity remained at 100% throughout all stages of holding and transporting the crab, including during the flight from Darwin to Brisbane.
10 15 20 25 30 35 14/5/04 12:00 AM 14/5/04 12:00 PM 15/5/04 12:00 AM 15/5/04 12:00 PM 16/5/04 12:00 AM 16/5/04 12:00 PM 17/5/04 12:00 AM 17/5/04 12:00 PM 18/5/04 12:00 AM 18/5/04 12:00 PM 19/5/04 12:00 AM Date Te m p e ra tur e ( °C )
Fri Sat Sun Mon Tues Wed
Figure 5.6. Temperature of crabs from capture through to arrival in Brisbane.
10 15 20 25 30 35 17/5/04 12:00 AM 18/5/04 12:00 AM 19/5/04 12:00 AM 20/5/04 12:00 AM 21/5/04 12:00 AM 22/5/04 12:00 AM 23/5/04 12:00 AM 24/5/04 12:00 AM 25/5/04 12:00 AM 26/5/04 12:00 AM Date Te m p e rat ur e ( °C )
Mon Tues Wed Thurs Fri Sat Sun Mon Tues Wed
5.1.5 Summary
Information collection based on current handling and harvesting practices within the mud crab fishery in the NT indicates that:
• mud crabs are handled gently and carefully despite the lack of infra-structure restrictions existing at the isolated harvesting locations
• most harvesters claw-tie the crabs at point of clearing from the pot
• there are some instances of cleared crabs being stored untied in an underfloor area of the dinghy
• there is strong recognition amongst harvesters of the importance of keeping the crabs at a constant cool temperature and keeping them in a moist environment • the use of thick hessian sacking was almost universal despite much
acknowledgement that it was not the ideal material to store crabs in due to difficulties in cleaning the hessian between crab batches
• some operations use dedicated storage sheds made of shade cloth, but this is not universal
The information gained from monitoring mud crab temperature change during both the ‘dry’ and ‘wet’ seasons illustrates that:
• crab are subjected to large temperature changes under commercial handling practices
• the method used for holding of crabs at camp is appropriate but could be improved to further minimise temperature fluctuation
• spraying the crab sacking is important to reduce temperature
• time of day for spraying may be able to be optimised for greatest temperature benefit
5.2 Trend analysis of commercial mud crab data
Project Objective
Document current mortality data in specifically designed logs to capture all possible factors
Mud crabs are harvested in remote locations in the Northern Territory, stored at a base camp for up to 7 days and transported to Darwin to wholesaler premises for further grading, pack out and transport to market. Storage of crabs at base camps is with the claws tied, crated and held under damp hessian at ambient. Transport from camp to Darwin is most commonly in an air-conditioned vehicle, with the exception of some crabs from Blue Mud Bay which were flown out from Groote Eylandt to Darwin. Upon arrival in Darwin, each mud crab is assessed and graded according to animal liveliness, robustness and quality. Commercial industry retains records of crab gradings and generously proffered these for analysis of mortality trends. Such an offer was appreciated because access and analysis of previous records provides an opportunity to observe whether any obvious trends exist with respect to mortality rates. If trends are evident then they could illustrate critical key factors needing to be addressed within the post-harvest survival research.
5.2.1 The Fishery
Mud crabs are harvested at remote locations around the coast of the Northern Territory, from the bottom of the Gulf of Carpentaria (McArthur River region), up the west side of the Gulf, around to the west of Darwin and down to Victoria River. The major harvest areas for mud crab in the NT are illustrated on Figure 5.8:
• Bynoe Harbour/Darwin • Blue Mud Bay
• Roper River region
• MCArthur River region (Borroloola)
Total mud crab catch volumes over recent years are presented in Figure 5.9. Catch of mud crab steadily increased to peak at 1139 tonnes in 2001. Catch volume dropped significantly to 739 tonnes in 2002; and decreased further in the following years. The corresponding freight data indicates that nearly all mud crab harvested in the Northern Territory is transported out of Darwin. Hence the importance of understanding the stress imposed by the distribution chain.
Figure 5.8. Location of major harvest areas for mud crabs in the Northern Territory showing proximity to Darwin.
Figure 5.9. Catch and corresponding freight data for the NT Mud Crab Fishery from 1989-2005. (Reproduced from Ward et al, 2008 with the kind permission of Tim Ward).
1989 1990 1991 1992 1993 1994 1995 1996 1997 1998 1999 2000 2001 2002 2003 2004 2005 2006
0 2 0 0 4 0 0 6 0 0 8 0 0 1 0 0 0 1 2 0 0
Ca
tch
(
t)
5.2.2 Data source
The data analysed covers the period January 2002 to September 2005 and includes a large proportion of the mud crab catch taken within the NT fishery. The remaining effort in the fishery is harvested and marketed independently, resulting in difficulty in obtaining similar data from these operators. Further data was not readily available after 2005 owing to change in operational status of the wholesaler involved. It is understood that similar data exists within the NT Fisheries databases and so it is possible for Fisheries staff to update the following analyses to include a wider picture. The correlations investigated in this section are suggestive only and were not able to be scrutinised under rigorous statistical analysis due to the incomplete data set.
Data was obtained as individual data sets from fishers but analysed as one data set so as to preserve commercial confidentiality. Where striking differences appeared between individual data sets, commentary only is given with no depiction of actual data, again to retain confidentiality.
The data examined relevant to this study is the quality grading of the live mud crabs as applied commercially at the point of pack-out for transport to markets (Table 5.2).
Table 5.2. Commercial grading categories for less than ‘A’ grade mud crab.
Commercial
grade Description
Dead crab not alive, died in transit from harvest camp
Slow Weak, judged by antennae movement and force resistance exhibited from claws and legs upon handling CUC commercially unsuitable crab - crab with flexible shell, lacking
muscle tissue (meat), occurs immediately post-moult Other poor quality, classified as ‘B’ grade or ‘riced’ (fly larvae)
The relevance of the grading categories with respect to further on-shipment is: • Dead – not able to be marketed; the mud crab trade is a live market
• Slow – not commercially viable to send to distant markets as the crab is unlikely to survive the additional demanding transport conditions involved and is highly likely to die in transit. Of relevance is that if even one crab dies within a box of ~20-30, the consequent ammonia level increase inside the crab box will overly stress the other live crab, resulting in high probability of other consequent mortalities
• CUC – not permitted for sale under the mud crab management plan, are discarded
• Other – not viable to send to distant markets as likely to die, depending on condition may have some limited (reduced) return on local markets
The non-biological factors considered likely to impact on the crab condition and grade are:
• temperature – time of year (season); water temperature at harvest; ambient – actual temperature and the differential between minimum and maximum • rainfall – when and how much affects salinity of harvest waters and
• harvest area – degree of geographical isolation and related transport difficulty and duration
• harvester practices – frequency of pot clearing; distance of fishing
operations from base camp; crab claw tying practices; crab storage methods at camp
• transporters practices – time and temperatures of holding
• catch volume – excessive crab catch may dictate altered handling practices
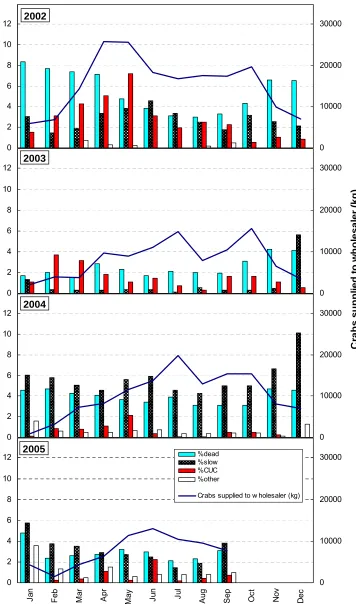
5.2.3 Compromised crabs
For this analysis, data for crabs graded as less than robust was combined and labelled ‘compromised crab’, hence this category includes cumulative data