Relative host plant species use by the lantana biological control agent
Aconophora
compressa
(Membracidae) across its native and introduced ranges
Andrew G. Manners
a,b,c,⇑, William A. Palmer
a,c, Armando Burgos
d, Jayd McCarthy
c, Gimme H. Walter
a,b aCRC for Australian Weed Management, The University of Adelaide, South Australia, Australia
b
School of Biological Sciences, The University of Queensland, Brisbane, Australia
c
Queensland Department of Employment, Economic Development and Innovation, Australia
d
Centro de Investigaciones Biológicas, Universidad Autonoma del Estado de Morelos, Mexico
a r t i c l e
i n f o
Article history:
Received 14 October 2010 Accepted 24 May 2011 Available online 31 May 2011
Keywords:
Aconophora compressa Citharexylum spinosum Duranta erecta
Fiddlewood
Lantana camara
Multiple host plant use Non-target effects Polyphagy Primary host plant Secondary host plant Weed biological control
a b s t r a c t
Aconophora compressaWalker (Hemiptera: Membracidae) was released in 1995 against the weed lantana in Australia, and is now found on multiple host plant species. The intensity and regularity at whichA. compressauses different host species was quantified in its introduced Australian range and also its native Mexican range. In Australia, host plants fell into three statistically defined categories, as indicated by the relative rates and intensities at which they were used in the field. Fiddlewood (Citharexylum spinosumL.: Verbenaceae) was used much more regularly and at higher densities than any other host sampled, and alone made up the first group. The second group, lantana (Lantana camaraL.: Verbenaceae; pink variety) and geisha girl (Duranta erectaL.: Verbenaceae), were used less regularly and at much lower densities than fiddlewood. The third group, Sheena’s gold (another variety ofD. erecta), jacaranda (Jacaranda mimosifoliaD. Don:Bignoniaceae) and myoporum (Myoporum acuminatumR. Br.: Myoporaceae), were used infrequently and at even lower densities. In Mexico, the insect was found at relatively low densities on all hosts relative to those in Australia. Densities were highest onL. urticifolia,D. erectaandTecoma stans(L.) Juss. ex Kunth (Bignoniaceae), which were used at similar rates to one another. It was found also on a few other verbenaceous and non-verbenaceous host species but at even lower densities. The relative rate at whichCitharexylumspp. andL. urticifoliawere used could not be assessed in Mexico becauseA. compressawas found on only one plant of each species in areas where these host species co-occurred. The low rate at whichA. compressaoccurred on fiddlewood in Mexico is likely to be an artefact of the short-term nature of the surveys or differences in the suites ofCitharexylumandLantanaspecies available there. These results provide further incentive to insist on structured and quantified surveys of non-target host use in the native range of potential biological control agents prior to host testing studies in quarantine.
Crown CopyrightÓ2011 Published by Elsevier Inc. All rights reserved.
1. Introduction
Field surveys of herbivorous species on their host plants are essential for identifying candidates for weed biological control agents (Goolsby et al., 2006; Sheppard et al., 2006a). When host-testing results suggest the biocontrol agent is host specific, its re-lease, once approved, is usually made on the assumption it will at-tack only the target weed. Unanticipated non-target effects have the potential to be devastating to the environment, damage the reputation of biological control (Simberloff and Stiling, 1996;
Lou-da et al., 2003) and jeopardise permission for future releases of
other agents (Sheppard et al., 2006b). Past mistakes of this nature
do, however, provide a basis for understanding how and why such errors were made and should provide insights to improve the pro-cess by which biocontrol agents are selected and sanctioned for re-lease (Briese, 2005).
Host specificity testing of candidate biocontrol agents relies mostly on data collected from glasshouse and laboratory studies in which a range of potential hosts are exposed to the herbivore species of interest. Plant species that are economically and ecolog-ically important, and which are deemed to be at potential risk, must be included. So, too, must plant species, or close relatives, with which that agent has been associated in its native range. All other available information on the herbivore species, in relation to its association with the target weed (and other host species), is normally gathered prior to host testing, and this includes data from insect collections, published literature and surveys and per-sonal knowledge of field collectors. This approach to host testing has several recognised shortcomings, including the inadvertent
1049-9644/$ - see front matter Crown CopyrightÓ2011 Published by Elsevier Inc. All rights reserved. doi:10.1016/j.biocontrol.2011.05.013
⇑Corresponding author. Present address: Department of Employment, Economic Development and Innovation, Agriscience Queensland, Redlands Research Station, P.O. Box 327, Cleveland 4163, Australia. Fax: +61 7 3286 3094.
E-mail address:andrew.manners@deedi.qld.gov.au(A.G. Manners).
Biological Control 58 (2011) 262–270
Contents lists available atScienceDirect
Biological Control
exclusion from tests of relevant host plant taxa through a lack of knowledge (Wapshere, 1974) and the unintended obviation, in rel-atively confined glasshouse conditions, of the long distance cues that are usually used by the insects to locate their hosts in the field
(Wapshere et al., 1989; Marohasy, 1996; Withers and Barton
Browne, 1998).
The limitations of formal laboratory host testing suggest that field studies in the native range of the target weed will always be important for determining the array of host species used by can-didate biocontrol agents, even though some of the significant plant species in the area targeted for release of the potential agents may not be present in the native range. Quantification of the relative intensity and regularity of host species use by the herbivore across all potential host species in its native range are crucial to determin-ing the relationship that the herbivore shares with each of the host plant species. Primary hosts are those that have the herbivore spe-cies of interest present on them most regularly and in relatively high numbers, and such hosts are predicted to have the entire range of features (stimuli) by which these herbivores detect, local-ise and use host plants (Walter and Benfield, 1994; Rajapakse et al., 2006). Secondary and incidental host plant species are predicted to have only a subset of these features and so are used less regularly in the field and in relatively lower numbers (Walter and Benfield,
1994; Milne and Walter, 2000; Walter, 2003, Chapter 7;Rajapakse
et al., 2006).
The host relationships outlined above are currently defined in relation to quantitative data on the use of host species in the field. The relative intensity of the interaction across host species is, in turn, influenced primarily by the sensory physiology and behav-iour of the herbivore species in question. In theory, therefore, it should be possible to develop an approach to predicting the host relationships of a species upon its introduction into a new area, at least in relation to all the hosts included in the native range study. However, it should be possible to use information on the relationships in the native range to ‘calibrate’ for those plants that do not exist in the native range (Briese, 2005). Identification of the primary, secondary and incidental host relationships are shown, in the results presented below, to provide a powerful adjunct to host specificity testing. The influence of ecological factors extraneous to the insect plant interaction, such as predation, could influence how a plant may be categorised and may have to be accommodated.
Aconophora compressawas introduced into Australia from Mex-ico in 1995 for the biological control of lantana (Lantana camaraL.: Verbenaceae) (Palmer et al., 1996) but in Australia is mostly asso-ciated with fiddlewood (Citharexylum spinosum L.: Verbenaceae)
(Dhileepan et al., 2006; Manners and Walter, 2009; Manners
et al., 2010), a tree native to the Caribbean. The available data for
A. compressafrom field and laboratory studies indicate that fiddle-wood is a primary host, whereas lantana and the varieties ofD. erecta, (i.e. geisha girl and Sheena’s gold) are secondary hosts ( Dhi-leepan et al., 2006; Manners and Walter, 2009; Manners et al.,
2010).
A. compressais ideal for investigating aspects of the herbivore– host interaction that are relevant to the pre-release evaluation of biocontrol agents because it uses multiple hosts, much of its basic biology on a number of hosts is known (Manners and Walter, 2009;
Manners et al., 2010), and it has already been introduced into a
new area where it interacts with hosts differently from the way originally anticipated. Furthermore, a number of plant species exist in both Mexico and Australia for which the insect plant interaction has been studied in Australia, including D. erecta (variety not known in Mexico), jacaranda (Jacaranda mimosifolia), lantana (L. camarain Australia is thought to be most closely related toL. urtic-ifoliafrom Mexico (Scott 2002), although recent evidence suggests that it may be more closely related to lantana from Venezuela and the Dominican Republic (R. Watts, CSIRO, Plant Industries, Can-berra, personal communication). In addition, many species of Cith-arexylum exist in Mexico, although C. spinosum has not been recorded there (Moldenke, 1942). Meaningful comparisons of the host plant relationships ofA. compressacan thus be made across the native and introduced ranges.
In particular, the following questions were addressed through quantified field sampling in Australia and Mexico. Does field host use in the native range correlate to that in the introduced range ofA. compressa? Could the quantified host use ofA. compressain Mexico across all host plants have thus been used to predict the observed behaviour of this species after its release in Australia and, if not, what are the possible explanations? Answers to these questions should improve our understanding of insect–host rela-tionships in general and lead to recommendations for host testing methods that should reduce the risk associated with releasing an organism into a new environment.
2. Methods
2.1. Surveys in Australia
2.1.1. General methods
A survey was conducted to quantify the regularity and intensity at which A. compressa used different host species in South East Queensland (SEQ), Australia. Six plant taxa were monitored at each of five sites, Bracken Ridge (27°1903300S 153°0102800E), St Lucia
(27°2905400S 153°000040E), Sherwood (27°3105300S 152°5805300E),
Durack (27°3501900S 153°000040 0) and Mt Tamborine (27°5502000S
153°1202100E) (Fig. 1). Four taxa were verbenaceous (fiddlewood,
lantana – pink-edged red variety which is common in SEQ, and two varieties ofD. erecta, namely geisha girl and Sheena’s gold) and two were non-verbenaceous (jacaranda and myoporum, Myo-porum acuminatum). Each month at each site, the numbers of adults, females attending egg batches, early instar nymphs (first to third) and late instar nymphs (fourth and fifth) were counted
on 15 randomly selected branches on each of 15 trees of each taxon that had been marked with aluminium tags. Specific branches were not marked or re-sampled each month, although re-sampling may
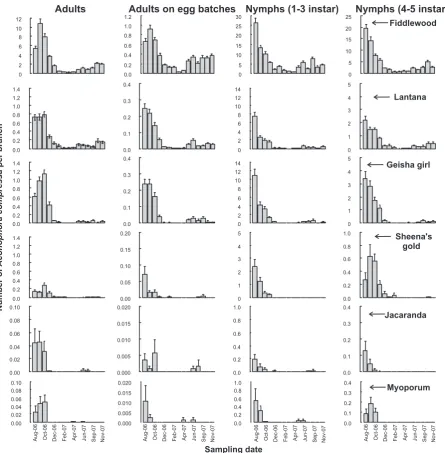
Fig. 2.Mean number of each stage ofAconophora compressaper branch (±SE) (labels across top of figure) on six host taxa (labelled in each row on the extreme right) sampled monthly in South East Queensland, Australia (n= 15 branches on each of 15 trees per plant species per month at each of five sites). Different scales are used for different host plants and stages of insect. Sample number (x-axis) represents successive months between August 2006 and November 2007, except October 2007.
Table 1
Linear mixed effects ANOVA, with site modelled as a random factor, on the proportion of branches withAconophora compressain any developmental stage on different host plants. Different letters next top-values indicate significant differences across host taxa.
Treatment t-Value Df P-value Total proportion
of branches
Intercept (fiddlewood) 15.82 226 <0.0001a 0.236
Lantana 8.83 226 <0.0001b 0.050
Geisha girl 7.46 226 <0.0001b 0.040
Sheena’s gold 10.89 226 <0.0001c 0.009
Myoporum 10.11 226 <0.0001c 0.002
Jacaranda 12.26 226 <0.0001c 0.002
Sine (time) 3.46 226 0.0006 NA
have occurred incidentally. All branches from all plant taxa sam-pled were less than 2.5 m from the ground.
Plants were sampled monthly in a repeated measures design between August 2006 and November 2007 (except Bracken Ridge, which was not sampled in August 2006, and no sites were sampled in October 2007). All plants at each site were within a 2 km radius of the site centre (Fig. 1) and were most often within a 1 km radius of co-ordinates stated above. All sites, except Mt Tamborine, were chosen because sufficient plants of each species were present. Mt Tamborine was chosen because of its relatively high altitude and cooler climate and these conditions may contribute to relatively high survival byA. compressaduring high summer temperatures
(Dhileepan et al., 2005). Only three plants of myoporum were
found at Mt Tamborine, and then only in February 2007.
Most plants were in suburban gardens and subject to periodic pruning. Plants that were heavily pruned during the study were omitted until sufficient regrowth was available. A few plants that were removed by gardeners and, for sampling purposes, were
re-placed with another nearby plant that was sampled monthly there-after. Where individual plants could not be distinguished, e.g. in thickets of lantana and myoporum, a 1 m section of the entire growth was marked and monitored consistently. The leaf rachis of jacaranda was treated as a ‘‘branch’’ for the purposes of the sur-vey and analysis because A. compressa uses these parts almost exclusively when on jacaranda.
All analyses were conducted in R version 2.6.2. Survey methods were designed with the intent of conducting repeated measures statistical analysis with random effects for site and individual plant. More than 90% of the data were, however, represented by zeroes and consequently broke the assumptions of all such analy-ses attempted (i.e. a variety of models using lme, glmmPQL, gamlss and gam in R), so the data were analysed as described in the fol-lowing subsections.
Climatic data were collected for each site from the Australian Bureau of Meteorology (http://www.longpaddock.qld.gov.au/silo/ datadrill/index.frames.html). Temperatures above 30°C cause
nificant levels of mortality forA. compressa(Dhileepan et al., 2005). Therefore, for each month and site, the maximum temperature, the total number of days with 30°C or above, the longest period with consecutive days with 30°C or above and the mean rainfall were retrieved. Means and standard errors were calculated for each var-iable across sites.
2.1.2. Intensity
To examine differences in the intensity of host use across the plant taxa, the proportion of branches withA. compressa(any num-ber and any developmental stage) was calculated for each month, site and taxon and arc-sine square root transformed. A linear mixed effects ANOVA was used to determine differences in host use across the plant taxa. The transformed proportion of branches withA. compressawas modelled by host taxon and the sine of time (to account for oscillating abundance of the insects over time) and site was modelled as a random factor. A power variance structure, representing a variance covariate given by the fitted values (the de-fault setting of the varPower function), was also modelled. A gen-eralised linear hypothesis test based on a Tukey test was used to determine significant differences across host taxa.
The mean number of each stage ofA. compressa(unsexed adults, females on egg batches, early nymphs and late nymphs) per branch was plotted for each host plant per month to illustrate relative field host use across the plant taxa sampled. The pattern of infestation that was typical for individual plants was obscured when data were averaged across those individuals. Therefore the mean num-ber of each life-stage ofA. compressawas also plotted for each indi-vidual plant, of a selected subset of plants over time for fiddlewood, lantana and geisha girl to highlight typical temporal patterns of host use.
The proportion of plants withA. compressawas plotted for each plant taxon each month. In addition, the proportion of adult and
nymphalA. compressaon each host plant taxon was plotted rela-tive to fiddlewood for each month sampled.
2.1.3. Regularity
The presence of each stage ofA. compressaon individual plants of each taxon was plotted to measure the regularity of host use over time and to calculate various summary statistics. Individual plants sampled for at least eight months (about half the entire sampling period) were included in the following analysis. The per-centages of plants upon whichA. compressawere present and ab-sent in every month sampled were calculated separately. The percentage of months in whichA. compressawas present on each plant and the longest continuous sequence of months through whichA. compressawas present and absent were also calculated separately. These statistics were presented as a percentage of the total number of months sampled for each individual plant, to ac-count for differences in the number of months sampled across indi-viduals. Individual plants were scored positively every month that at least oneA. compressaindividual was present.
2.2. Survey in Mexico
A 3 week field survey was conducted in Mexico (within the na-tive range ofA. compressa) between January 23 and February 14, 2007. Plants were sampled as per the Australian surveys, but the number of plants sampled in any given area was not limited to 15 plants (as in Australian surveys) because repeated measures were not possible. The field survey was concentrated in the state of Morelos (Fig. 1) as this is considered an area of relatively high
A. compressa abundance (Palmer et al., 1996). Plants were also searched in the following states: Mexico, Puebla, Tlaxcala and Guerrero (Fig. 1). Surveys were conducted along major and minor roadways and were more concentrated in areas with relatively high soil moisture, as indicated by lush, green foliage. Lantana urticifolia,Citharexylum spp. (probably two species that were 2– 3 m shrubs, unlikeC. spinosumin Australia which is a tall tree), jac-aranda, T. stans and other verbenaceous plants were actively sought, although plants in moderate abundance in any given area were searched forA. compressa. The locations of plants of various
Citharexylumspp. were sought with reference to herbarium speci-mens from the National Herbarium of Mexico, Mexico City. Insect specimens from all host species were identified by Chris Dietrich of the Illinois Natural History Survey. The data were split into two groups based on geographic location: Morelos and Puebla. Since there were no repeated measures and distinct sites were not iden-tified (and which acted as replicates in the Australian analysis), for-mal statistical analysis was not conducted. Non-overlapping 95% confidence intervals were therefore used to indicate differences in abundance across host taxa.
3. Results
3.1. Surveys in Australia
3.1.1. Intensity and regularity
Three distinct and significantly different groups of plant species could be circumscribed by the numbers ofA. compressathey hosted in the field. Fiddlewood hosted significantly more insects per branch than any other host (Fig. 2), had consistently more branches withA. compressa(Table 1) and alone made up the first group. The second group consisted of lantana and geisha girl and the third Sheena’s gold, myoporum and jacaranda (Fig. 2;Table 1). The pro-portion of individual plants of each taxon withA. compressa(Fig. 3), and the proportion of allA. compressaadults and nymphs collected
Fig. 4.The proportion of adult (top graph) and nymphal (bottom graph)Aconophora compressaon lantana, geisha girl, Sheena’s gold, myoporum and jacaranda relative to the proportion on fiddlewood at the time of sampling. Fiddlewood is represented by values of one every month but this is not shown on the graphs.
at each sampling time on each host species, relative to the propor-tion on fiddlewood plants (Fig. 4), followed this same trend.
On average,A. compressawas present continuously on fiddle-wood, lantana and geisha girl (for all but 2 months on the last plant species) (Figs 2 and 4). When individual plants were inspected for continuity ofA. compressapresence, however, it was only fiddle-wood that hosted them persistently (Table 2), as indicated by the data from selected individual plants inFig. 5. On lantana and gei-sha girl, by contrast, individual plants were never used continu-ously (Fig. 5; Table 2). The longest continuous stretch during whichA. compressawas recorded on lantana and geisha girl was, on average, about 2–3 months (Table 2), much shorter than that
observed on fiddlewood, about 7 months (Table 2). Fiddlewood was the only plant taxon for which A. compressawas found on every plant over the sample period (Table 2) and, on average, indi-vidual trees harboured A. compressaabout 10 of the 15 months sampled, i.e. 66.6% (Table 2). This is in stark contrast to the next most frequently used host, lantana, in which individual trees har-boured the insects on average for about four of the 15 months sam-pled, i.e. 26.0% (Table 2).A. compressawas not found on any plant, besides fiddlewood, for the entire sample period and was never found on about 13% of lantana plants sampled (Table 2). In sum-mary, the data indicate that fiddlewood was used much more reg-ularly (Table 2) and at much higher intensities (Figs 2–5) than any
Fig. 5.Bar plots illustrating thatAconophora compressawas present continuously (August 2006–November 2007) on some fiddlewood individuals, and that on lantana and geisha girl it was not. Segments of thex-axis without bars above them indicate that noA. compressaindividuals were on that individual plant in that month. The plant represented by Fiddlewood 2 (top right hand plot) was not sampled in August or September 2006.
Table 2
Regularity of host use byAconophora compressain field sampling between August 2006 and November 2007 (mean ± S.E.). Data represent host use of individual plants of each taxon that were surveyed for at least eight of the 15 months sampled (nfor each host type is in brackets in the left hand column).
Treatment (n) Plants that had
A. compressa
for the entire sampling period (%)
Plants that had no
A. compressa
for entire sampling period (%)
Mean longest continuous time period withoutA. compressa
Mean number of months that plants hadA. compressa
Mean longest continuous time period withA. compressa
% Survey period
Monthly equivalent
% survey period
Monthly equivalent
% Survey period
Monthly equivalent
Fiddlewood (74) 8.1 0.0 28.9 ± 2.2 4.3 ± 0.3 66.6 ± 2.3 10.0 ± 0.3 48.0 ± 2.7 7.2 ± 0.4
Lantana (85) 0.0 12.9 62.2 ± 2.6 9.3 ± 0.4 26.0 ± 1.9 3.9 ± 0.3 17.7 ± 1.3 2.7 ± 0.2
Geisha girl (78) 0.0 18.0 72.5 ± 2.5 10.9 ± 0.4 20.9 ± 1.9 3.1 ± 0.3 16.1 ± 1.5 2.4 ± 0.2
Sheena’s gold (72) 0.0 54.2 90.7 ± 1.5 13.6 ± 0.2 7.2 ± 1.2 1.1 ± 0.2 6.6 ± 1.1 1.0 ± 0.2
Myoporum (65) 0.0 80.0 96.4 ± 1.3 14.5 ± 0.2 2.4 ± 0.7 0.4 ± 0.1 2.2 ± 0.6 0.3 ± 0.1
other host species. Regularity and intensity of host use were lower on lantana, followed by geisha girl, Sheena’s gold, jacaranda and myoporum.
Protracted periods of high summer temperatures (P30°C) were recorded between November 2006 and March 2007 (Table 3). Numbers of A. compressadropped considerably during this time period across all host plants (Fig. 2). The numbers ofA. compressa
increased on fiddlewood, lantana and geisha girl from April 2007; numbers on Sheena’s gold, jacaranda and myoporum remained very low (Fig. 2).
3.2. Survey in Mexico
Overall, about 450 plants were sampled from about 15 host taxa
(Table 4). The abundance ofA. compressain Mexico was relatively
low, on all host plants, compared to its abundance in Australia.A. compressawas more abundant in Morelos than any other area sur-veyed (Fig. 6;Table 4). In Morelos it was found at similar relatively high rates onD. erecta,L. urticifoliaandT. stans(Fig. 6a). Abundance was very low on lemon verbena (Aloysia citriodora(Cav.) Ort.: Ver-benaceae) and jacaranda (Fig. 6a). Citharexylum spp. were not found in Morelos despite extensive search.
In Puebla,A. compressawas found on three plants, one each ofC. cinereumL.,L. urticifoliaandSeneciospp. (colloquial name ‘jarilla’, which possibly represents a number of plant species across the dif-ferent regions surveyed) (Fig. 6b). A single maleA. compressawas found onWigandiaspp. (Hydrophyllaceae) in the state of Mexico but was not found on this plant anywhere else despite sampling this species in areas in whichA. compressawas in relatively high abundance (Table 4). Otherwise,A. compressawas not found out-side Morelos and Puebla (Table 4).
4. Discussion
Early determination of multiple host use by herbivore species can be made and hosts can be categorised in an ecologically mean-ingful way from quantitative field surveys of multiple host plant species over time. The categorisations derived here correlate well with those derived from nymphal rearing experiments across the host plants sampled in Australia (Manners and Walter, 2009) and also from adult performance tests on these plants (Manners
et al., 2010). The results presented here also demonstrate that
the host plant associations ofA. compressa are consistent across geographic regions sampled, in terms of which plant species are used as primary, secondary or incidental hosts (Figs. 2–5,Tables
1 and 2). Further sampling is needed in the native range, but the
results have clear implications for biocontrol practice, as explained below.
4.1. A. compressa in Australia
The abundance ofA. compressaon fiddlewood was always high-er than on any othhigh-er host sampled, in thigh-erms of the mean numbhigh-er of
A. compressaper branch (Fig. 2) and proportion of trees with A. Table 3
Monthly climate data over the survey period. Means (±S.E.) were calculated across sites for each month. No survey was conducted in October 2007.
Month (survey month) Maximum temperature (°C) Total number of daysP30°C Longest number of consecutive daysP30°C Rainfall (mm)
August 2006 (1) 28.3 ± 0.85 0.0 ± 0.0 0.0 ± 0.0 45.6 ± 3.52
September 2006 (2) 28.3 ± 0.75 0.0 ± 0.0 0.0 ± 0.0 63.2 ± 4.97
October 2006 (3) 32.9 ± 1.30 1.2 ± 0.37 0.8 ± 0.2 20.4 ± 2.25
November 2006 (4) 34.0 ± 0.98 6.4 ± 1.33 3.4 ± 0.6 63.3 ± 2.33
December 2006 (5) 31.4 ± 0.75 3.4 ± 0.93 1.4 ± 0.40 75.6 ± 6.48
January 2007 (6) 34.0 ± 0.76 16.8 ± 2.67 10.0 ± 1.76 70.4 ± 2.71
February 2007 (7) 30.8 ± 0.75 10.0 ± 3.10 5.2 ± 2.60 74.7 ± 10.54
March 2007 (8) 35.6 ± 1.04 15.8 ± 3.87 6.4 ± 1.44 42.1 ± 13.07
April 2007 (9) 28.7 ± 0.60 0.2 ± 0.20 0.2 ± 0.20 8.7 ± 2.43
May 2007 (10) 29.8 ± 0.75 1.2 ± 0.49 1.2 ± 0.49 36.3 ± 4.10
June 2007 (11) 25.3 ± 0.85 0.0 ± 0.0 0.0 ± 0.0 109.9 ± 2.38
July 2007 (12) 25.6 ± 0.78 0.0 ± 0.0 0.0 ± 0.0 1.5 ± 0.50
August 2007 (13) 27.4 ± 0.86 0.0 ± 0.0 0.0 ± 0.0 103.4 ± 5.35
September 2007 (14) 30.8 ± 0.97 4.2 ± 1.11 2.2 ± 0.58 36.2 ± 4.24
October 2007 32.9 ± 0.93 7.2 ± 2.27 2.2 ± 0.8 90.9 ± 9.00
November 2007 (15) 31.1 ± 0.80 1.8 ± 0.58 1.8 ± 0.58 80.1 ± 3.12
Table 4
Summary of the number of plants sampled with and withoutAconophora compressain various Mexican states. Surveys were completed over three weeks in January and February 2007, the dry season.
Host plant State Total plants
sampled
A. compressa
present (%)
Asteraceae
Seneciospp. (jarilla)a
Mexico Morelos Puebla 8 29 25 0 0 4.0
Baccharissp. Puebla Tlaxcala 3 5 0 0 Bignoniaceae
Jacaranda mimosifolia Guerrero Mexico Morelos Puebla 6 1 33 7 0 0 3.0 0
Tecoma stans Mexico Morelos Puebla 3 53 15 0 18.9 0 Sapindaceae
Dodonaea viscosa Morelos Guerrero Mexico 37 1 1 0 0 0 Hydrophyllaceae
Wigandiaspp. Mexico Morelos Puebla 7 31 9 14.3 0 0 Verbenaceae
Aloysia triphylla(lemon verbena) Morelos 23 26.1
Citharexylumsp. (fiddlewood) Mexico 4 0
C. cinereum(fiddlewood) Puebla 11 9.1
D. erecta Morelos 24 62.5
L. urticifolia(lantana) Mexico Morelos Puebla 1 65 16 0 30.8 6.3 Unknown spp.
4 taxa Morelos 56 0
2 taxa Puebla 10 0
2 taxa Tlaxcala 11 0
a
Jarilla, a common name in Mexico, probably represents more than oneSenecio
species with similar morphology and growth form.
compressa(Fig. 3). The relative proportion of A. compressaadults and nymphs, compared to fiddlewood, on each host species was never more than 15% and 30%, respectively, of that on fiddlewood in any given month (Fig. 4), but was usually much lower. Results indicate that lantana, geisha girl, Sheena’s gold, myoporum and jacaranda were used mostly as a ‘‘spill-over’’ from fiddlewood (Figs 2–4). Only fiddlewood trees harbouredA. compressacontinuously
(Table 2, Fig. 5) and recolonisation of secondary host plants
oc-curred repeatedly over the course of the surveys (Figs. 2 and 5). Furthermore, the use of secondary and incidental host plants ap-pears ephemeral, perhaps as a result of adults that developed from eggs laid on the secondary and incidental hosts emigrating soon after eclosion. However, this possibility would require a separate test.
In general, the results presented here provide further support that fiddlewood is the primary host plant ofA. compressain Austra-lia and that all other hosts, including lantana, are secondary or inci-dental hosts (Manners and Walter, 2009; Manners et al., 2010).A. compressahas been recorded on particular lantana plants for peri-ods of about 26 weeks (double that recorded in this study –Table 2) and at moderately high levels (about three to five times that re-corded in this study) in 2009 and 2010, at the Alan Fletcher Re-search Station, Sherwood, Brisbane, Australia. Such populations on lantana have been recorded only as relatively isolated patches of these insects in New South Wales and Queensland (W.A. Palmer, unpublished data). The relative abundance ofA. compressaon fid-dlewood and other host species near these relatively large popula-tions ofA. compressaon lantana is not known.
The statistical analysis grouped Sheena’s gold with jacaranda and myoporum, rather than with lantana and geisha girl, even though Sheena’s gold is used more regularly and at somewhat higher abundance than jacaranda and myoporum (Figs. 2–4;Tables
2). Sheena’s gold may thus be a relatively low ranking secondary host.
4.2. A. compressa in Mexico
The overall abundances ofA. compressaon host plants in Mexico were much lower than those recorded in Australia (Fig. 6), but pat-terns of host use were similar across the two regions (Figs. 2–4). In the state of Morelos,A. compressawas found on a number of plant species, mainly from the family Verbenaceae, but also some from relatively distantly related families (Table 4). A. compressa was found onD. erectaandT. stansat levels similar to lantana (Table 4;
Fig. 6). Counts ofA. compressaonLantanaspp. in Mexico between
compressa(Palmer et al. 1996) and had been found onD. erectain Mexico prior to its release in Australia (Palmer and Pullen, 1995;
Palmer et al., 1996).
This field survey of A. compressa in Morelos indicates thatL. urticifolia,D. erectaandT. stansare in the same category of hosts (i.e. either primary or secondary) and jacaranda andA. citriodora
are in a lesser category (i.e. either secondary or incidental hosts). More information is required to determine whetherL. urticifolia,
D. erecta andT. stansare primary or secondary hosts in Mexico. Essentially, data over multiple seasons on each host plant are re-quired to understand this aspect ofA. compressaecology in Mexico. The relationship betweenA. compressaandCitharexylumspp. in Mexico remains somewhat ambiguous, perhaps influenced by a number of factors. ManyCitharexylumspp. are present in Mexico, butC. spinosumhas not been recorded (Moldenke, 1942). C. spino-sumis native to the Caribbean and Florida butA. compressais not known from these regions (Dietrich and Deitz, 1991). Fiddlewood plants in Mexico were, however, rare or had low apparency during the survey. SinceCitharexylumspp. are deciduous and January to February is dry in Mexico, these plants possibly harbourA. com-pressaat other times. Long term field surveys, perhaps including adjacent geographic regions in the range ofA. compressa(e.g. Gua-temala), would help clarify the status of the relationship between
A. compressaand fiddlewood in its native range. This would also aid in the determination of whether lantana and fiddlewood are primary or secondary host plants in Mexico.
Lantana in Australia was thought to be most closely related to lantana from Mexico (Scott 2002), although recent evidence sug-gests that it may be more closely related to lantana from Venezuela and the Dominican Republic (R. Watts, CSIRO, Plant Industries, Canberra, personal communication). In general, the points made above indicate just how crucial are full field surveys across all sea-sons in the native range of a weed to make an informed release decision. That is, long-term field surveys are more likely to provide an accurate indication of the host relationships of the herbivore with its host plants than will sole reliance on laboratory or glass-house based tests in quarantine. The latter, however, are important to interpret the field results and will provide the sole information on plants not present in the native range.
Acknowledgments
Thanks to Dhileepan and Dane Panetta who provided helpful comments on previous drafts of this paper and Simon Blomberg who provided statistical assistance that aided this paper signifi-cantly. This research was funded by a PhD scholarship from the CRC for Australian Weed Management. Overseas travel was funded by a University of Queensland travel grant and the CRC for Austra-lian Weed Management.
References
Briese, D.T., 2005. Translating host-specificity test results into the real world: the need to harmonize the yin and yang of current testing procedures. Biological Control 35, 208–214.
Dhileepan, K. et al., 2005. Effect of temperature on the survival ofAconophora compressa Walker (Hemiptera: Membracidae): implications for weed biocontrol. Australian Journal of Entomology 44, 457–462.
Dhileepan, K. et al., 2006. Temporal patterns in incidence and abundance of
Aconophora compressa(Hemiptera: Membracidae), a biological control agent for
Lantana camara, on target and nontarget plants. Environmental Entomology 35, 1001–1012.
Dietrich, C.H., Deitz, L.L., 1991. Revision of the Neotropical Treehopper Tribe Aconophorini (Homoptera: Membracidae). North Carolina Agricultural Research Service, Raleigh, North Carolina.
Goolsby, J.A. et al., 2006. Maximising the contribution of native-range studies towards the identification and prioritisation of weed biocontrol agents. Australian Journal of Entomology 45, 276–286.
Louda, S.M. et al., 2003. Nontarget effects-the achille’s heel of biological control? Retrospective analysis to reduce risk associated with biocontrol introductions. Annual Review of Entomology 48, 365–396.
Manners, A.G. et al., 2010. Characterising insect plant host relationships facilitates understanding multiple host use. Arthropod–Plant Interactions 4, 7–17. Manners, A.G., Walter, G.H., 2009. Multiple host use by a sap-sucking membracid:
population consequences of nymphal development on primary and secondary host plant species. Arthropod Plant Interactions 3, 87–98.
Marohasy, J., 1996. Host shifts in biological weed control: real problems, semantic difficulties or poor science? International Journal of Pest Management 42, 71– 75.
Milne, M., Walter, G.H., 2000. Feeding and breeding across host plants within a locality by the widespread thrips Frankliniella schultzei, and the invasive potential of polyphagous herbivores. Diversity and Distributions 6, 243–257. Moldenke, H., 1942. The Known Geographic Distribution of the Members of the
Verbenaceae and Avicenniaceae. Edwards Brothers, Inc., New York.
Palmer, W.A. et al., 2004. Analysis of the non-target attack by the lantana sap-sucking bug,Aconophora compressa, and its implications for biological control in Australia. In: Sindel, B.M., Johnson, S.B. (Eds.), 14th Australian Weeds Conference Vol. Weed Society of New South Wales Inc.. Sydney, Charles Sturt University, Wagga Wagga, NSW, pp. 341–344.
Palmer, W.A., Pullen, K.R., 1995. The phytophagous arthropods associated with
Lantana camara, L. Hirsuta, L. urticifolia, and L. urticoides(Verbenaceae) in North America. Biological Control 5, 54–72.
Palmer, W.A. et al., 1996. The host range of Aconophora compressa Walker (Homoptera: Membracidae): a potential biological control agent forLantana camara L. (Verbenaceae). Proceedings of the Entomological Society of Washington 98, 617–624.
Rajapakse, C.N.K. et al., 2006. Host recognition by a polyphagous lepidopteran (Helicoverpa armigera): primary host plants, host produced volatiles and neurosensory stimulation. Physiological Entomology 31, 270–277.
Sheppard, A. et al., 2006a. Native-range research assists risk analysis for non-targets in weed biological control: the cautionary tale of the broom seed beetle. Australian Journal of Entomology 45, 292–297.
Sheppard, A. W., et al., 2006b. Biological control of brooms in Australia: an update. 15th Australian Weeds Conference, Papers and Proceedings, Adelaide, South Australia, 24–28 September 2006: Managing weeds in a changing climate. 573– 576.
Simberloff, D., Stiling, P., 1996. How risky is biological control? Ecology 77, 1965– 1974.
Walter, G.H., 2003. Insect Pest Management and Ecological Research. Cambridge University press, UK.
Walter, G.H., Benfield, M.D., 1994. Temporal host plant use in three polyphagous Heliothinae, with special reference to Helicoverpa punctigera (Wallengren) (Noctuidae: Lepidoptera). Australian Journal of Ecology 19, 458–465. Wapshere, A.J., 1974. A strategy for evaluating the safety of organisms for biological
weed control. Annals of Applied Biology 77, 201–211.
Wapshere, A.J. et al., 1989. Recent developments in biological control of weeds. Crop Protection 8, 227–250.