Harpenden, Herts, AL5 2JQ
Telephone: +44 (0)1582 763133 Web: http://www.rothamsted.ac.uk/
Rothamsted Research is a Company Limited by Guarantee Registered Office: as above. Registered in England No. 2393175. Registered Charity No. 802038. VAT No. 197 4201 51. Founded in 1843 by John Bennet Lawes.
Rothamsted Repository Download
A - Papers appearing in refereed journals
Bacq-Labreuil, A., Crawford, J. W., Mooney, S., Neal, A. L. and Ritz, K.
2018. Phacelia tanacetifolia affects soil structure differently depending on
soil texture. Plant and Soil.
The publisher's version can be accessed at:
•
https://dx.doi.org/10.1007/s11104-019-04144-4
•
https://doi.org/10.1007/s11104-019-04144-4
The output can be accessed at:
https://repository.rothamsted.ac.uk/item/84v68
.
© 11 June 2019, Please contact library@rothamsted.ac.uk for copyright queries.
REGULAR ARTICLE
Phacelia (
Phacelia tanacetifolia
Benth.) affects soil structure
differently depending on soil texture
A. Bacq-Labreuil&J. Crawford&S. J. Mooney&
A. L. Neal&K. Ritz
Received: 23 November 2018 / Accepted: 16 April 2019
#The Author(s) 2019
Abstract
Aims We studied the effects ofPhacelia tanacetifolia, increasingly used as a cover-crop species in arable agri-cultural systems, upon soil structural properties in the context of two contrasting soil textures. We hypothesised there would be differential effects of the plants upon soil structure contingent on the texture.
Methods A sandy-loam and a clay soil were
destructured by passing through 2 mm sieves, and planted withPhacelia in a replicated pot experiment, with associated unplanted controls. X-ray Computed Tomography was used to visualise and quantify the soil pore networks in 3D.
Results For the sandy-loam soil, there was no impact of plants upon aggregate size distribution porosity, pore connectivity, and pore surface density decreased in the presence of plants, whereas for the clay, there was a significant increase of aggregates <1000μm, the poros-ity was constant, the pore-connectivporos-ity decreased, and surface density increased in the presence of plants.
Conclusions Plants can impact the structural genesis of soil depending on its inherent textural characteristics,
leading to a differential development of pore architec-ture in different contexts. These results have implica-tions both from an ecological perspective and in terms of the prescription of plants to remediate or condition soil structure in managed systems.
Keywords Cover crop . Phacelia . Soil pore connectivity . Soil porosity . X-ray computed tomography . 3D image analysis
Introduction
In terrestrial systems, soil is the fundamental base which supports vegetation growth (van Breemen 1993), but plants also affect the nature of their belowground habitat both directly and indirectly. In agricultural systems, the use of cover crops is increasing (Storr et al.2019) in order to increase the sequestration of carbon (Reicosky and Forcella 1998; Scott et al. 2017), soil macro-porosity (Abdollahi et al. 2014; Bodner et al. 2014; Burr-Hersey et al. 2017; Cercioglu et al. 2018) and decrease soil erosion (Reicosky and Forcella 1998; Storr et al. 2019). Furthermore, cover crops have an impact on the biota of the soil, increasing microbial diversity and richness (Patkowska and Konopiński 2013; Fernandez et al. 2016) and the abundance of saprophytic and mycorrhizal fungi (Six et al. 2006; Duchene et al.2017; Finney et al.2017). In a restored grassland, roots and fungi increased the proportion of carbon sequestered in aggregate (Scott et al. 2017), however, there was no measurement of the pore
https://doi.org/10.1007/s11104-019-04144-4
Responsible Editor: W Richard Whalley.
A. Bacq-Labreuil (*)
:
S. J. Mooney:
K. RitzDivision of Agriculture & Environmental Sciences, School of Biosciences, University of Nottingham, Sutton Bonington Campus, Leicestershire LE12 5RD, UK
e-mail: aurelie.bacqlabreuil@gmail.com
J. Crawford
:
A. L. Nealnetwork, and the characterisation of the soil structure was via aggregate size. Bodner et al. (2014) showed that cover crops with different root architectures induced different porosity and pore size distributions determined via water infiltration (i.e. a destructive method). The physical structure of the soil was not visualised. X-ray Computed Tomography is a non-destructive method which image the soil structure as well as the roots (Zhou et al. 2016; Cercioglu et al. 2018; Rabot et al. 2018; Schlüter et al. 2018). A recent study revealed contrasting responses between species in their root mor-phology to changes in bulk density (Burr-Hersey et al. 2017), but presented little information on associated soil structure. Cover crops and biofuel crops can improve soil pore characteristics via increas-ing the macro-porosity and decreasincreas-ing soil bulk density (Cercioglu et al.2018).
Soil structure is classically defined as the arrange-ment of soil particles and organic materials (Tisdall and Oades1982), typically creating a dynamic and hetero-geneous pore network within the soil matrix (Dexter 1988). The nature of this pore network is to a large extent underpinned by soil texture, but it can also be affected by other factors such as the actions of living organisms, wet:dry and freeze:thaw cycles, etc. (Ritz and Young2011). A recent study revealed tomato root architecture was markedly different for plants after 8 days of growth dependant on soil texture: plants developed a thick tap root in sandy loam soil but grew thinner roots with more laterals in clay soil (Helliwell et al.2017). Furthermore, the porosity of the rhizosphere of the sandy loam soil was decreased whereas for the clay loam soil it was increased. Thus, the root growth strategies of plants are influenced by the surrounded environment. In non-cohesive and coarser soil, root systems generally develop to greater depth and are thicker than roots growing in a cohesive, finer textured soil (Hacke et al. 2000; Jackson et al. 2000; Li et al. 2005). Non-cohesive and coarser soil dries at greater rates in the upper layer, therefore the root systems must grow deeper in order to access water (Jackson et al. 2000). The influence of plants on soil structural dynam-ics is also dependant on soil texture: in a silty-clay soil the presence of plant can increase the porosity and pore connectivity compared to a sandy soil where the pres-ence of plants can decrease the porosity and pore-connectivity (Bacq-Labreuil et al.2018). However, the effects of soil texture upon the impact of plants upon soil structural dynamics is not well understood. Hydraulic
properties in finer textured soils are considerably differ-ent due to the enhanced water holding in finer pores (Saxton et al.1986). Plant roots modify the aggregation of soil particles, generally acting to generate and stabi-lise aggregates (Tisdall and Oades1982). This occurs by processes of enmeshment of soil particles and excretion of mucilage and other extra-cellular polymeric sub-stances which adhere constituents together (Bronick and Lal 2005; Erktan et al. 2018; Gould et al. 2016). Indirect mechanisms are mediated by interactions with soil biota also serve to drive aggregation processes such as excretion of extracellular substances (Haynes and Beare1997; Rillig et al.2002; Ritz and Young2011). Root mucilage stabilises aggregates by increasing cohe-sion and decreasing wetting rates of aggregates (Czarnes et al. 2000). The inherent diversity of plant species means that the soil is frequently exposed to an increase in the diversity of root architecture within the matrix (e.g. tap, fibrous, fine roots), an increase in the quality and quantity of carbon inputs, and considerable differ-entiation in the microbial communities associated with the root systems (Haynes and Beare 1997; Chan and Heenan1999; Rillig et al.2002; Gould et al.2016).
The aim of this study was to establish the effect of soil texture and plant growth on early stage soil struc-tural genesis. We grewPhacelia tanacetifolia, a herba-ceous plant commonly used as a cover crop in arable rotations and apocryphally thought to be particularly effective in conditioning soil structure, in a sandy loam and clay soil, along with unplanted control treatments. We hypothesised that (i) the plant roots have a contrast-ing effect on soil structure (via the modification of aggregate distribution and pore network) depending on the soil texture; and (ii) the presence of a plant increases the porosity, pore-connectivity, and diver-sity of pore sizes.
Materials and methods
Preparation of soil cores
1.07 °W). After collection, the soils were spread and left to air-dry over two days before being thoroughly mixed and broken down by passing through a 2-mm mesh sieve. Columns comprised of polypropylene tubes (170 mm height × 68 mm diameter) with a 0.1 mm mesh affixed to the base were packed with soil to a bulk density of 1.2 g cm−3. Columns were placed on a tension table for saturation for 24 h and then equilibration for 3 days at−3 kPa prior to seed sowing which is equiva-lent to a moisture of 30% (± 2%) for the clay and 20% (± 1%) for the sandy loam. Pre-germinated seeds of
Phacelia tanacetifolia Benth. cv. BAngelia^ were planted in the soil surface and adjusted to provide one emergent plant per column. Four planted and four unplanted replicates of each soil type were established and arranged in a randomised block design in a growth chamber providing 16:8 h light:dark cycle at 21 °C:50% humidity, 15 °C:75% humidity respectively and the moisture content was kept constant by maintaining the plants on a tension table at -3 kPa. Plants were grown for 6 weeks since at this age they were fully pot-bound.
X-ray computed tomography (CT)
All columns were X-ray CT scanned prior to sowing seeds, and at 2, 4 and 6 weeks thereafter, using a Phoenix v∣tome∣x M scanner (GE Measurement and Control solution, Wunstorf, Germany) set at a voxel resolution of 40 μm, the voltage of 180 kV with a current of 180μA. A total of 2160 projection images were collected for each scan at an exposure time of 250 ms period using an averaging of 3 images and skip of 1, resulting in a total scan time of 90 min. The scanning time was chosen to optimise the image pro-cessing with greater quality of image. Scans occurred over 4 days with treatments randomly allocated over this period but consistent between the three occasions.
All scanned images were reconstructed using Phoenix datos∣×2 rec reconstruction software. The scanned images were optimised to correct any sample movement during the scan and reduce noise using the beam hardening correction algorithm, set at 8. Here, beam hardening was set at 8, due to previous tests which gave the best image quality.
As a multi-scan routine was performed on the core samples, VG StudioMax® 2.2 was used to merge the top, middle and bottom scans to obtain a single 3D volume for each complete core. Image sequences of 40 × 40 × 120 mm were extracted for image analysis.
Image analysis
Pre-processing of the image sequences was performed using Image J (Schneider et al. 2012). This step was used to crop the image sequence, apply a median filter (averaging 2 pixels), enhance brightness and contrast, and selected two threshold values manually. The thresh-old and the 3D calculation was implemented in QuantIm (Vogel et al.2010), following a standard method detail in Bacq-Labreuil et al. (2018), described briefly here. The segmentation of the pore networks was realised in 3D, and only included the pores and left out the root materials. The threshold was facilitated by the long scanning procedure which enhanced the image quality. The threshold used here is a 3D threshold using an neighbour-algorithm, i.e. the software requires 2 thresh-old values (T1< T2) and compares every voxel
greyscale value (Ti) to this two values. If Ti< T1, Tiis
attributed to the pore phase, if Ti> T2, Ti is attributed to
the solid phase and if T1< Ti< T2, Ti is attributed to the
fuzzy regions. When all the voxels are attributed to each of the three phases, then the software compares the voxel from the fuzzy regions to their neighbours: if one of Tineighbour belongs to the pore space, then Ti
is attributed to the pore phase otherwise Tistays in the
fuzzy region. This step is repeated until no changes can be made, all the voxel in the fuzzy region is attributed then to the solid phase. The quantification of the 3D pore network was performed by QuantIm (Vogel et al. 2010).
In summary, the following Minkowski function which characterised 3D pore network, were collected using QuantIm: porosity of the selected volume was the percentage of the pores greater than 40μm, here referred as the porosity; pore size distribution, expressed here as a cumulative value, was the proportion of each size class in the volume; pore connectivity expressed by the Euler number, with a negative Euler number is associated with greater pore connectivity; pore surface density which is the pore-solid interface, a greater surface density suggests a larger roughness of the pore edges (Vogel et al. 2010).
Sampling and measurements
300, 212 and 53μm, via horizontal shaking for 3 min at 300 rotations min−1. The mass of aggregates retained on
Statistical analysis
All statistical analyses were conducted using Genstat version 17.1 (VSN International Ltd., 2014). For aggre-gate size distribution, at Week 0, a one-way analysis of variance (ANOVA) was performed to assess the differ-ence in soil mass between size classes at Week 6, and for porosity a two-factor repeated-measures RM-ANOVA was used to assess the effects of plant status and either size class or time. A three-way RM-ANOVA was per-formed on all primary variables using a split-plot design with soil type, plant status and size classes of pores as factors.
Results
Both soils showed contrasting pore architectures (Fig.1a, c). For the sandy soil, the pores were primarily compound-packing pores that were typically a similar small and well distributed through the soil profile (Fig. 1a). However, for the clay soil, pores were larger as a result of the destructuring (sieving) process, typically
vugh-shaped and more heterogeneously distributed than the sand soil (Fig. 1c). In micromorphology terms a vugh is classified as an Birregular shaped pores^ (Bullock and Murphy 1983). The growth of
Phacelia after 6 weeks induced cracks in the soil surrounding the primary root, but were more ap-parent in the clay soil (Fig. 1b–e). Cracks were apparent, principally associated with primary roots within the soil profile (Fig. 1b, d) or with lateral roots growing through aggregates in the clay soil (Fig. 1e).
Pore characteristics
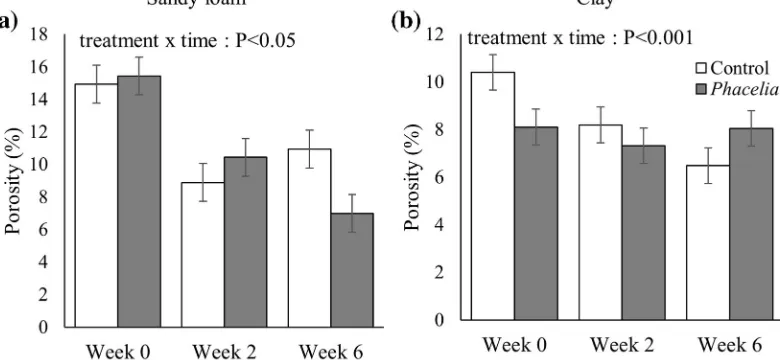
In the sandy loam soil, porosity decreased between Week 0 and Week 2 but not thereafter for the unplanted soil, whilst in planted soils there was a consistent de-crease in porosity across Weeks 0–6 (time x treatment interactionP< 0.05; Fig.2a). In the clay soil, porosity was less in planted treatments at Week 0, similar at Week 2 and greater in planted soils at Week 6 than unplanted treatments (time x treatment interaction
P< 0.001; Fig.2b).
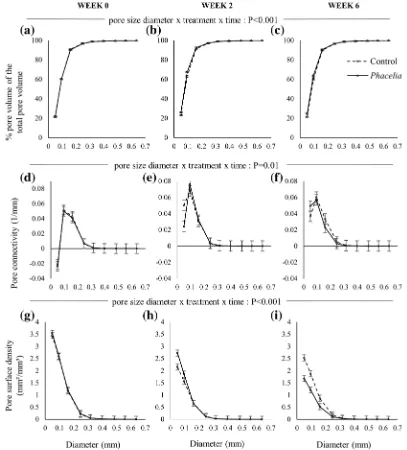
Minkowski functions only showed significant chang-es with rchang-espect to pore diameters of <0.3 mm for both sandy loam and clay soils (Figs.3&4). For sandy loam there was a significant pore size diameter x treatment x time interaction term with respect to all pore size distri-bution, pore connectivity and pore surface density (P≤
0.01). Whilst this effect was statistically significant with respect to pore size distribution, in numerical terms the
Fig. 2 Total soil porosity in unplanted and planted soils (spatial resolution 40μm).asandy loam soil; (b) clay soil. Bars denote means (n= 4) expressed as the percentage of pores relative to the total volume, whiskers denote pooled standard errors
Fig. 1 2D X-ray attenuation images of soils (40μm resolution; darker shades relate to lower attenuation; a sharpening algorithm has been passed over these images to increase contrast of features) from (a,c) unplanted at Week 0 and (b,d,e) soil planted with phacelia after 6.a,bsandy clay soils; (c,d) clay soils.eexample of effect of lateral root (LR) growing from a primary root (R) through aggregate in the clay soil and resulting in crack (C), growing through the soil matrix (S). P represents isolated pores
effects were minor, and barely discernible when plotted (Fig.3a-c). Approximately 90% of the pore sizes in all cases were≤0.16 mm (Fig.3 a-c). The connectivity function of unplanted soils decreased significantly be-tween Weeks 0 and 2, with only a modest increase by Week 6. However, on these occasions, plant effects on connectivity differed depending on pore size. At Week 2, pores <0.1 mm were more connected in planted soils but not above this size. By Week 6 this relationship
changed such that pores <0.1 mm were less connected, and those in the range 0.1–0.25 mm were more connect-ed in plantconnect-ed soils. Pore surface density decreasconnect-ed for both unplanted and planted soils between Week 0 and Week 2 but with a greater magnitude for unplanted soils, and with this decline continuing in planted soils to Week 6 (Fig.3j-l).
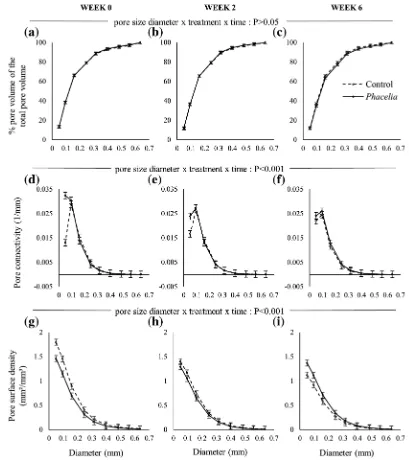
For the clay soil, there was no significant three-way interaction term with respect to pore size distribution Fig. 3 Minkowski functions of sandy loam soils for the unplanted
and planted soils at Week 0 (a,d,g), Week 2 (b,e,h) and Week 6 (c,f, i): (a -c) cumulative pore distribution of cores; (d -f)
(P> 0.05; Fig.4a-c), but there was for pore connectivity and pore surface density (P < 0.001; Fig.4d-l). Overall, approximately 80% of the pore sizes for both treatments were≤0.25 mm (Fig. 3 a-c). At Week 0, the pore connectivity of the unplanted soils was substantially greater than the planted soils for pores in the 0.05– 0.1 mm size range (Fig. 4d). Over the subsequent 6 weeks, pore connectivity in planted and unplanted
soils converged to parity (approximately 0.23 mm−1; Fig. 4 d-f), leading to a significant interaction. Pore surface density of unplanted soils was greater than planted soils by up to 0.3 mm at Week 0. By Week 2, pore surface density functions had decreased and con-verged for both treatments, and by Week 6 was signif-icantly smaller for pores <0.2 mm in unplanted soils (Fig.4j-l).
Fig. 4 Minkowski functions of clay soils for the unplanted and planted soils at Week 0 (a,d,g), Week 2 (b,e,h) and Week 6 (c,f,
i): (a-c) cumulative pore distribution of cores; (d-f) connectivity;
Aggregate size distribution
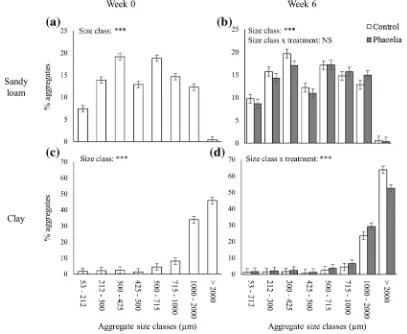
At Week 0, the aggregate size distribution of the sandy loam showed an increasing proportion of aggregates in size class 53–500 μm, followed by a reverse of this trend for aggregates >2000 μm (Fig. 5a). This trend was interrupted at 425–500μm, where this size class constituted a significantly smaller proportion than neighbouring classes (Fig.5a). There was an extremely low proportion of aggregates >2000μm (approximately 0.4%, Fig.5a). At Week 6, this pattern was still mani-fest, and there was no significant effect of plants (P> 0.05; Fig.5b). For the clay soil, there was a general trend of an increase in proportion of aggregates with increasing size class, but a substantial increase for pores >1000μm, with the greatest proportion > 2000μm (Fig. 5c). This pattern persisted at Week 6, where there was a significant effect of plants with respect to aggregates
>1000 μm; planted soils had a significantly greater proportion of aggregates 1–2 mm than unplanted soils, but this pattern was reversed for aggregates >2000μm (P< 0.05; Fig.5d).
Discussion
Whilst the organic matter content was lower in the sandy soil, this is essentially inevitable for similarly-managed and co-located clay versus sandy arable soils, and the primary difference between the soils used in this study was textural. The nature of the aggregate size distribu-tion was different between the textures: approximately 80% of all aggregates were > 1000 μm for the clay, whereas in sandy loam soil the aggregate sizes were more evenly distributed throughout the sizes <2000 μm with 0.5% of aggregate sizes >2000 μm Fig. 5 Soil aggregate size distribution showing the starting
con-dition at Week 0 (a,c) and the effect of plants at Week 6 (b,d) for the sandy loam soil (a–b) and the clay soil (c–d). Bars denote
(Fig. 5). For the clay soil, the larger proportion of aggregates >1000 μm can be attributed to the greater proportion of clay particles due to their capacity to bound together (Tisdall and Oades1982; Dexter1988; Blake et al.2003). The presence of plants did not impact the aggregate size distribution in the sandy loam soil. This may be due to a lack of any substantial wet:dry cycles imparted, which is known to stabilise aggregate (Bronick and Lal2005) as the samples were held at a fixed water potential in this experiment. During wetting, water can disperse or swell clay particles which leads to increased contact between clay and other particles, and therefore binding during the drying phase (Singer et al. 1992). Furthermore, sandy loam soil contained a low proportion of clay (9.5%), which is representative of a non-cohesive soil. Thus in non-cohesive soil, the binding due to the presence of clay is reduced leading to a reduction of the root action on the aggregation (Degens et al. 1994; Six et al.2004). We wished to avoid such effects in this study in order to investigate the inherent effects of the plant on structural genesis. Hence in both soils, the water regime was constant during the experi-ment, thus the change in wet and dry cycles were not responsible for the greater proportion of aggregates >2000 μm observed in the unplanted treatment for the clay soil. Thus, the aggregation in the unplanted treat-ment might be due to other biotic factors, such as micro-bial activity. The planted soils showed a decrease in the percentage of aggregate sizes >2000μm and an increase in the percentage of aggregate sizes 1000–2000μm (Fig. 5). The greater proportion of aggregates sizes between 1000 and 2000μm in the planted soil might have resulted from fragmentation of bigger aggregates by root penetra-tion or development via root acpenetra-tion, and localised wet-dry cycles induced by the presence of plants (Materechera et al. 1994; Chan and Heenan 1996; Jin et al. 2013). However, the moisture content of the column was kept constant during the experiment via the use of a tension table, and the transpiration rates of plants was not mea-sured. Such localised effects might have induced a rear-rangement of the clay particles around the roots and modified the aggregate size distribution (Reid and Goss 1982; Six et al.2004; Gregory et al.2009). Therefore, in the more cohesive soil, roots appear to generate fragmented aggregates, which may facilitate water infil-tration or drainage within the aggregates (Fig. 1e; Materechera et al.1994). This in turn would have argu-ably positive effects upon water availability to the plants through the generation of a wider pore sizes from sizes
between 0.05 and 0.16 mm, which are associated to the transmission pores (Metzger and Yaron1987; Watts and Dexter1997).
The results obtained via X-ray CT imaging contrasted with those of the aggregate size distributions. In the sandy loam soil, there was no significant impact of the plants upon soil aggregation whereas plants significantly affected the pore network. In comparison, for the clay soil, there was a signifi-cant increase of aggregates <1000 μm, while the plants induced a constant porosity. These observa-tions show that the aggregate size distribution metrics concealed information regarding the in situ soil structure.
Neither soil texture showed a significant plant effect on pore size distribution or pore connectivity after 6 weeks growth. A longer experiment might have re-vealed a greater influence of plants on soil structural genesis. In the sandy loam soil, the presence of plants decreased the pore surface density, i.e. decreasing pore-solid interfaces (Fig.3g-i). This meant the presence of plants reduced the irregular shaped-pores or elongated pores within the pore network (Vogel et al.2010; Bacq-Labreuil et al.2018). In clay soil, the pore solid interface increased in the planted soils (Fig.4g-i), which suggests that elongated or irregular shaped-pores increased with-in the pore network. The formation of more irregular-shaped pores would likely influence the microbial com-munity due to the creation of new habitats and a wider range of niches (Holden 2011). A more diverse pore structure and heterogeneity in pore morphology can also affect soil hydrology, via modifying water flow at a local scale and the nature of water film continua. Therefore, the same plant genotype had two distinctive effects upon the modification of pore morphology depending on the inherent soil texture. Therefore, the prescrip-tion of crops for specific characteristics such as root morphology, rhizodeposition, might be better informed by consideration of the soil texture in which they are grown. Especially that the same plant species is affected differently depending on soil textures. This characteristic might be important for breeders and farmers in order to prescribe plant species that are optimal for the needs of the farmers and depending on the soil texture.
Therefore, farmers, depending on their requirements (such as water management, compaction, etc) could prescribe different plant species depending on their characteristics, but taking in account the soil texture. Sandy soils are usually free draining, thus there may be an adaptive advantage where roots reduce the poros-ity in soils in which they are growing, which will likely
increase the retention of water. Therefore, cover crops could potentially be used to prime soil structure before sowing the main crop, specifically in sandy soil to enhance the retention of water, and in clay soils to increase water transmission. Further studies are required to understand whether different plant species affect such soil structural dynamics in different ways (Ehrmann and Ritz2013; Erktan et al.2018). We postulate this is likely g i v e n t h e d i v e r s i t y o f r o o t m o r p h o l o g i e s , rhizodeposition patterns and higher-order interactions between plants and soil biota. These observations also have implications from an ecological perspective, for example in the way vegetation may modulate soil struc-tural dynamics during successional processes, which appears to have been barely considered.
Conclusions
This study revealed a contrasting effect of soil textural characteristics on soil structural genesis. The results confirmed our hypothesis that a plant can modify soil aggregate size distribution and pore networks differently depending on the inherent soil texture, manifest by different aggregate size distributions, and the contrast-ing effect of plants in both textural classes. However, the second hypothesis was not fully supported for both soils. For the sandy loam soil, the presence of roots decreased porosity, pore surface density, but had no significant impact on pore size distribution and pore connectivity after 6 weeks of growth. For the clay soil, the presence of roots maintained the porosity constant over the 6 weeks, but had no effect on the pore connectivity, contradicting the second hypothesis, but increased the pore surface density, which supported it. These results showed that impact of plants on soil pore architecture depends on textural characteristics.
Acknowledgements We thank Pr. Hu Zhou for his assistance with the software QuantIm, and Paul Brown for supplying seed of
Phacelia. This work was performed at the University of
Open AccessThis article is distributed under the terms of the Creative Commons Attribution 4.0 International License (http:// creativecommons.org/licenses/by/4.0/), which permits unrestrict-ed use, distribution, and reproduction in any munrestrict-edium, providunrestrict-ed you give appropriate credit to the original author(s) and the source, provide a link to the Creative Commons license, and indicate if changes were made.
References
Abdollahi L, Munkholm LJ, Garbout A (2014) Tillage system and cover crop effects on soil quality: II. Pore characteristics. Soil S c i S o c A m J 7 8 : 2 7 1 . h t t p s : / / d o i . o r g / 1 0 . 2 1 3 6 /sssaj2013.07.0302
Bacq-Labreuil A, Crawford J, Mooney SJ, Neal AL, Akkari E, McAuliffe C, Zhang X, Redmile-Gordon M, Ritz K (2018) Effects of cropping systems upon the three-dimensional ar-chitecture of soil systems are modulated by texture. Geoderma 332:73–83. https: //doi.org/10.1016/J. GEODERMA.2018.07.002
Blake JJ, Spink JH, Dyer C (2003) Factors affecting cereal estab-lishment and its prediction. HGCA Res Rev 51:1–53 Bodner G, Leitner D, Kaul HP (2014) Coarse and fine root plants
affect pore size distributions differently. Plant Soil 380:133– 151.https://doi.org/10.1007/s11104-014-2079-8
Bronick CJ, Lal R (2005) Soil structure and management: a review. Geoderma 124:3–22. https://doi.org/10.1016/j. geoderma.2004.03.005
Bullock P, Murphy CP (1983) Soil Micromorphology 2: Soil Genesis., Berkhamste
Burr-Hersey JE, Mooney SJ, Bengough AG, Mairhofer S, Ritz K (2017) Developmental morphology of cover crop species exhibit contrasting behaviour to changes in soil bulk density, revealed by X-ray computed tomography. PLoS One 12:1– 18.https://doi.org/10.1371/journal.pone.0181872
Cercioglu M, Anderson SH, Udawatta RP, Haruna SI (2018) Effects of cover crop and biofuel crop management on com-puted tomography-measured pore parameters. Geoderma 319:80–88.https://doi.org/10.1016/j.geoderma.2018.01.005
Chan KY, Heenan DP (1996) The influence of crop rotation on soil structure and soil physical properties under conventional tillage. Soil Tillage Res 37:113–125.https://doi.org/10.1016 /0167-1987(96)01008-2
Chan KY, Heenan DP (1999) Microbial-induced soil aggregate stability under different crop rotations. Biol Fertil Soils 30: 29–32.https://doi.org/10.1007/s003740050583
Czarnes S, Hallett PD, Bengough a G, Young IM (2000) Root- and microbial-derived mucilages affect soil structure and water transport. Eur J Soil Sci 51:435–443.https://doi.org/10.1046 /j.1365-2389.2000.00327.x
Degens BP, Sparling GP, Abbott KL (1994) The contribution from hyphae, roots and organic carbon constituents to the aggre-gation of a sandy loam under long-term clover-based and grass pastures. Eur J Soil Sci 45:459–468. https://doi. org/10.1111/j.1365-2389.1994.tb00531.x
Dexter AR (1988) Advances in characterization of soil structure. Soil Tillage Res 11:199–238
Duchene O, Vian JF, Celette F (2017) Intercropping with legume for agroecological cropping systems: complementarity and facilitation processes and the importance of soil microorgan-isms. A review. Agric Ecosyst Environ 240:148–161.
https://doi.org/10.1016/j.agee.2017.02.019
Ehrmann J, Ritz K (2013) Plant: soil interactions in temperate multi-cropping production systems. Plant Soil 376:01–29.
https://doi.org/10.1007/s11104-013-1921-8
Erktan A, McCormack ML, Roumet C (2018) Frontiers in root ecology: recent advances and future challenges. Plant Soil 424:1–9.https://doi.org/10.1007/s11104-018-3618-5
Feeney DS, Crawford JW, Daniell T, Hallett PD, Nunan N, Ritz K, Rivers M, Young I M (2006) Thre e-di mensiona l microorganization of the soil-root-microbe system. Microb Ecol 52:151–158. https://doi.org/10.1007/s00248-006-9062-8
Fernandez AL, Sheaffer CC, Wyse DL, Staley C, Gould TJ, Sadowsky MJ (2016) Structure of bacterial communities in soil following cover crop and organic fertilizer incorporation. Appl Microbiol Biotechnol 100:9331–9341. https://doi. org/10.1007/s00253-016-7736-9
Finney DM, Buyer JS, Kaye JP (2017) Living cover crops have immediate impacts on soil microbial community structure and function. J Soil Water Conserv 72:361–373.https://doi. org/10.2489/jswc.72.4.361
Gould IJ, Quinton JN, Weigelt A, de Deyn GB, Bardgett RD (2016) Plant diversity and root traits benefit physical proper-ties key to soil function in grasslands. Ecol Lett 19:1140– 1149.https://doi.org/10.1111/ele.12652
Gregory AS, Watts CW, Griffiths BS, Hallett PD, Kuan HL, Whitmore AP (2009) The effect of long-term soil manage-ment on the physical and biological resilience of a range of arable and grassland soils in England. Geoderma 153:172– 185.https://doi.org/10.1016/j.geoderma.2009.08.002
Hacke UG, Sperry JS, Ewers BE, Ellsworth DS, Schäfer KVR, Oren R (2000) Influence of soil porosity on water use in Pinus taeda. Oecologia 124:495–505
Haynes RJ, Beare MH (1997) Influence of six crop species on aggregate stability and some labile organic matter fractions. Soil Biol Biochem 29:1647–1653.https://doi.org/10.1016 /S0038-0717(97)00078-3
Helliwell JR, Sturrock CJ, Mairhofer S, Craigon J, Ashton RW, Miller AJ, Whalley WR, Mooney SJ (2017) The emergent rhizosphere: imaging the development of the porous archi-tecture at the root-soil interface. Sci Rep 7:14875.https://doi. org/10.1038/s41598-017-14904-w
Helliwell JR, Sturrock CJ, Miller AJ, Whalley WR, Mooney SJ (2019) The role of plant species and soil condition in the physical development of the rhizosphere. Plant Cell Environ.
https://doi.org/10.1111/pce.13529
Holden PA (2011) How do the microhabitats framed by soil structure impact soil bacteria and the processes that they regulate? Eds K Ritz I Young Archit Biol Soils Life Inn Sp Chapter 7:118–148
Jackson RB, Sperry JS, Dawson TE (2000) Root water uptake and transport : using physiological predictions. Trends Plant Sci 5:482–488
Kézdi A (1974) Handbook of soil mechanics. Soil Physics, vol 1, Elsevier S
Li Y, Xu H, Cohen S (2005) Long-term hydraulic acclimation to soil texture and radiation load in cotton. Plant Cell Environ 2 8 : 4 9 2–4 9 9 . h t t p s : / / d o i . o r g / 1 0 . 1 1 1 1 / j . 1 3 6 5 -3040.2005.01291.x
Martin SL, Mooney SJ, Dickinson MJ, West HM (2012) Soil structural responses to alterations in soil microbiota induced by the dilution method and mycorrhizal fungal inoculation. Pedobiologia (Jena) 55:271–281.https://doi.org/10.1016/j. pedobi.2012.06.001
Materechera SA, Kirby JM, Alston AM, Dexter AR (1994) Modification of soil aggregation by watering regime and roots growing through beds of large aggregates. Plant Soil 160:57–66
Metzger L, Yaron B (1987) Influence of sludge organic matter on soil physical properties. In: Stewart BA (ed) Advances in Soil Science Vol 7. Springer-Verlag, New York Inc., pp 141–163 Patkowska E, Konopiński M (2013) The role of oat, common vetch and tansy phacelia as cover plants in the formation of microorganisms communities in the soil under the cultivation of root chicory (cichorium intybus var. sativum bisch.) and salsify (tragopogon porrifolius var. sativus (gat. Acta Sci Pol, Hortorum cultus 12:179–191
Rabot E, Wiesmeier M, Schlüter S, Vogel HJ (2018) Soil structure as an indicator of soil functions: a review. Geoderma 314: 122–137.https://doi.org/10.1016/j.geoderma.2017.11.009
Reicosky DC, Forcella F (1998) Cover crop and soil quality interactions in agroecosystems. J Soil Water Conserv 53: 224–229
Reid JB, Goss MJ (1982) Interactions between soil drying due to plant water-use and decreases in aggregate stability caused by maize roots. J Soil Sci 33:47–53.https://doi.org/10.1111 /j.1365-2389.1982.tb01746.x
Rillig MC, Wright SF, Eviner VT (2002) The role of arbuscular mycorrhizal fungi and glomalin on soil aggregation compar-ing the effects of five plant species. Plant Soil 238:325–333 Ritz K, Young IM (2011) Architecture and biology of soils. CABI,
Wall
Saxton KE, Rawls WJ, Romberger JS, Papendick RI (1986) Estimating generalized soil-water characteristics from tex-ture. Soil Sci Soc Am J 50:1031–1036
Schlüter S, Großmann C, Diel J, Wu GM, Tischer S, Deubel A, Rücknagel J (2018) Long-term effects of conventional and reduced tillage on soil structure, soil ecological and soil
hydraulic properties. Geoderma 332:10–19. https://doi. org/10.1016/j.geoderma.2018.07.001
Schneider CA, Rasband WS, Eliceiri KW (2012) NIH image to ImageJ: 25 years of image analysis. Nat Methods 9:671–675 Scott DA, Baer SG, Blair JM (2017) Recovery and relative influ-ence of root, microbial, and structural properties of soil on physically sequestered carbon stocks in restored grassland. Soil Sci Soc Am J 81:50. https://doi.org/10.2136 /sssaj2016.05.0158
Singer MJ, Southard RJ, Warrington DN, Janitzky P (1992) Stability of synthetic sand-clay aggregates after wetting and drying cycles. Soil Sci Soc Am J 56:1843. https://doi. org/10.2136/sssaj1992.03615995005600060032x
Six J, Bossuyt H, Degryze S, Denef K (2004) A history of research on the link between (micro) aggregates, soil biota, and soil organic matter dynamics. Soil Tillage Res 79:7–31.
https://doi.org/10.1016/j.still.2004.03.008
Six J, Frey SD, Thiet RK, Batten KM (2006) Bacterial and fungal contributions to carbon sequestration in agroecosystems. Soil S c i S o c A m J 7 0 : 5 5 5 . h t t p s : / / d o i . o r g / 1 0 . 2 1 3 6 /sssaj2004.0347
Storr T, Simmons RW, Hannam JA (2019) A UK survey of the use and management of cover crops. Ann Appl Biol aab12488.
https://doi.org/10.1111/aab.12488
Tisdall JM, Oades JM (1982) Organic matter and water-stable aggregates in soils. J Soil Sci 33:141–165
van Breemen N (1993) Soils as biotic constructs favoring net primary productivity. Geoderma 57:183–211. https://doi. org/10.1016/0016-7061(93)90002-3
Vogel HJ, Weller U, Schlüter S (2010) Quantification of soil structure based on Minkowski functions. Comput Geosci 36:1236–1245.https://doi.org/10.1016/j.cageo.2010.03.007
Watts CW, Dexter AR (1997) The influence of organic matter in reducing the destabilization of soil by simulated tillage. Soil Tillage Res 42:253–275. https://doi.org/10.1016/S0167-1987(97)00009-3
Zhou H, Fang H, Mooney SJ, Peng X (2016) Effects of long-term inorganic and organic fertilizations on the soil micro and macro structures of rice paddies. Geoderma 266:66–74.
https://doi.org/10.1016/j.geoderma.2015.12.007
Publisher’s note Springer Nature remains neutral with regard to