Space-use patterns highlight behavioural
differences linked to lameness, parity, and
days in milk in barn-housed dairy cows
Jorge A. Va´zquez Diosdado1☯¤a, Zoe E. Barker2, Holly R. Hodges2, Jonathan R. Amory2, Darren P. Croft3, Nick J. Bell4¤b, Edward A. CodlingID1☯*
1 Department of Mathematical Sciences, University of Essex, Colchester, Essex, United Kingdom, 2 Writtle University College, Chelmsford, Essex, United Kingdom, 3 Centre for Research in Animal Behaviour, College of Life and Environmental Sciences, University of Exeter, Exeter, Devon, United Kingdom, 4 Royal Veterinary College, Hatfield, Hertfordshire, United Kingdom
☯These authors contributed equally to this work.
¤a Current address: School of Veterinary Medicine and Science, University of Nottingham, Sutton Bonington Campus, Leicestershire, United Kingdom
¤b Current address: Bos International Ltd, Wimborne, Dorset, United Kingdom
Abstract
Lameness is a key health and welfare issue affecting commercial herds of dairy cattle, with potentially significant economic impacts due to the expense of treatment and lost milk pro-duction. Existing lameness detection methods can be time-intensive, and under-detection remains a significant problem leading to delayed or missed treatment. Hence, there is a need for automated monitoring systems that can quickly and accurately detect lameness in individual cows within commercial dairy herds. Recent advances in sensor tracking technol-ogy have made it possible to observe the movement, behaviour and space-use of a range of animal species over extended time-scales. However, little is known about how observed movement behaviour and space-use patterns in individual dairy cattle relate to lameness, or to other possible confounding factors such as parity or number of days in milk. In this cross-sectional study, ten lame and ten non-lame barn-housed dairy cows were classified through mobility scoring and subsequently tracked using a wireless local positioning system. Nearly 900,000 spatial locations were recorded in total, allowing a range of movement and space-use measures to be determined for each individual cow. Using linear models, we highlight where lameness, parity, and the number of days in milk have a significant effect on the observed space-use patterns. Non-lame cows spent more time, and had higher site fidelity (on a day-to-day basis they were more likely to revisit areas they had visited previously), in the feeding area. Non-lame cows also had a larger full range size within the barn. In con-trast, lame cows spent more time, and had a higher site-fidelity, in the cubicle (resting) areas of the barn than non-lame cows. Higher parity cows were found to spend more time in the right-hand-side area of the barn, closer to the passageway to the milking parlour. The num-ber of days in milk was found to positively affect the core range size, but with a negative interaction effect with lameness. Using a simple predictive model, we demonstrate how it is possible to accurately determine the lameness status of all individual cows within the study
a1111111111 a1111111111 a1111111111 a1111111111 a1111111111
OPEN ACCESS
Citation: Va´zquez Diosdado JA, Barker ZE, Hodges
HR, Amory JR, Croft DP, Bell NJ, et al. (2018) Space-use patterns highlight behavioural differences linked to lameness, parity, and days in milk in barn-housed dairy cows. PLoS ONE 13(12): e0208424.https://doi.org/10.1371/journal. pone.0208424
Editor: Juan J. Loor, University of Illinois, UNITED
STATES
Received: June 13, 2018
Accepted: November 17, 2018
Published: December 19, 2018
Copyright:©2018 Va´zquez Diosdado et al. This is an open access article distributed under the terms of theCreative Commons Attribution License, which permits unrestricted use, distribution, and reproduction in any medium, provided the original author and source are credited.
Data Availability Statement: All relevant data are
within the paper and its Supporting Information files. Specifically, the spatial location tracking data collected and analysed within the study is available inS3 File.
Funding: This study is supported by the UK
using only two observed space-use measures, the proportion of time spent in the feeding area and the full range size. Our findings suggest that differences in individual movement and space-use behaviour could be used as indicators of health status for automated moni-toring within a Precision Livestock Farming approach, potentially leading to faster diagnosis and treatment, and improved animal welfare for dairy cattle and other managed animal species.
Introduction
Globally, lameness is one of the key health and welfare issues that affects intensive dairy farms,
particularly for herds that are housed indoors permanently or semi-permanently [1–3]. In the
UK alone, the estimated cost to the dairy industry of treatment, lost milk yield, and lost fertility
is over £128 million per annum [4]. Prompt treatment of lameness can reduce severity and the
number of required treatments [5], hence reducing financial costs and the duration and
impact of pain for the individual animal. However, early detection of lameness remains a
prob-lem as many farmers may underestimate the prevalence of lameness within their herd [2],
identify and treat cows later than might be optimal [5], or time constraints may mean they are
unable to undertake time- and labour-intensive mobility monitoring [6]. Increasing
intensifi-cation of farming practices means that these detection issues are likely to become even more problematic in larger dairy herds. Hence, there is a need for systems which can automatically detect lameness at an early stage without the need for time-consuming mobility observations of individual animals. Recent attempts to use automated systems to detect lameness have relied upon the identification of abnormal gait using load cells, pressure sensitive mats, computer
vision or accelerometers [7,8], but the uptake of such technology on farms has been limited
due to both costs and practical effectiveness in the working farm environment. More generally,
within Precision Livestock Farming approaches [9], a range of behavioural measures have
been suggested as potential indicators of health status and disease for monitoring managed animal species. Lameness is known to cause pain and walking difficulty in affected cows
[10,11], and this may influence how they move and use the available space within the barn.
However, existing studies that have linked the lameness status of individual dairy cows to their space-use behaviour have been restricted to small spatial scales (i.e. at the level of individual
stalls) [12].
In the wider movement ecology context, animal movement and space-use behaviour is known to be influenced by landscape characteristics such as the location of water or food
resources, habitat type and vegetation cover [13], as well as local topographic features such as
the gradient of a hillside [14]. For example, grazing animals are known to move to locations
with higher quantities of grass resources or where there is better quality of nutrients [15]. By
adapting to their environment, animals can hence visit favourable areas more than others
[16,17]. In a limited home range, an animal may repeatedly visit certain locations [18] or
actively spend more time in specific areas leading to different levels of space-use intensity. For an individual animal, the level of similarity in its space use at different time points can be
cal-culated and the level of site fidelity quantified [19–22]. In the specific context of pasture-based
cattle, [23] showed how spatial overlap between domesticated cattle and wild buffalo was
linked to the gradient of available resources, [24] demonstrated how concentrate supplement
can modify the feeding behaviour of grazing cows in high mountain pastures, while [25]
con-sidered how spatial interactions between cattle and wild boar could potentially facilitate cross-species disease transmission.
the Colin Spedding Memorial Research Studentship awarded by The Farm Animal Welfare Trust. The funders had no role in study design, data collection and analysis, decision to publish, or preparation of the manuscript.
Competing interests: The authors have declared
Understanding how illness or welfare status may affect animal movement behaviour, space-use, and interactions with the local landscape could potentially provide extremely useful
insights and indicators for monitoring and managing a range of animal species [9]. Lameness,
mastitis and ketosis (metabolic disorder) are all important diseases of dairy cattle that have
been shown to affect feeding and lying behaviour [26–32], and in this context, the use of
cow-mounted accelerometers to measure cow behaviour is well established [8,33–35]. However,
despite these extensive studies highlighting the links between disease and dairy cow behaviour, an automated method for disease detection based on behavioural observations is still lacking. A major issue with any automated approach is the complex interplay between health status
and other potential confounding factors such as age, parity, or stage of lactation [36,37], that
lead to individual behavioural differences. A recent study investigated a range of possible beha-vioural indicators of health status in dairy cattle including lying, locomotion, feeding and rumination activities, in addition to brush and concentrate feeder visits and milking order
[29]. Although there were differences between lame and non-lame cows, [29] also reported a
high variability across individual animals and predictor variables overlapped between these groups.
The use of spatial tracking systems for monitoring dairy cattle is less well developed than accelerometer-based systems, but they have the potential to provide additional important behavioural information about movement and space-use in individual animals. With
pasture-based animals, tracking is possible with standard Global Positioning Systems (GPS) [38,39],
but for indoor barn-housed dairy cows alternative systems are needed. Real-Time Location Systems (RTLS) are a recent new development in the application of radio frequency technol-ogy with great potential for use in livestock agriculture. They have been tested and validated
for indoor spatial tracking of dairy cows [28,40–42], and have subsequently been used to
pre-dict time budgets of behavioural activities [43], to determine the probability of cattle
undertak-ing feedundertak-ing or drinkundertak-ing [44], or to detect behavioural changes related to oestrus [45]. However,
to date there have been no studies that have reported how differences in space-use behaviour within a commercial barn may be directly linked to the lameness status of individual dairy cows.
In this paper we present results from of an analysis of a tracking data set containing nearly 900,000 recorded spatial locations obtained over five days from a cross-sectional study group of ten lame and ten non-lame barn-housed dairy cows using a wireless positioning system. We determine measures of space-use behaviour within the barn for each cow, and using linear models we demonstrate where lameness status, parity and days in milk have a significant effect on the observed space-use measures. We demonstrate how observable differences in space-use patterns can be used directly within a simple predictive model to accurately determine the lameness status of individual cows. The methodology and approach described within the study could be adapted to study space-use behaviour in other commercially managed or wild animal species.
Materials and methods
Data collection
The study was undertaken over 5 successive days in January 2014 on a commercial dairy farm in Essex, UK. A total of 210 Holstein pedigree cows were housed in a rectangular free-stall barn measuring 30m by 60m. The cows were split into high yield (120 cows) and low yield (90
cows) groups, separated by a central feed alley (Fig 1A). The high yield group were housed in
the upper part of the barn and had access to 120 free-stalls, and linear feed space of 0.43m per cow. The milking parlour and collecting yard were situated in the lower part of the barn, with
a connecting return passage positioned on the right-hand side of the barn (Fig 1A). All cows
were fed a commercial total mixed ration (TMR) and milking took place three times a day (05:00hrs, 13:00hrs, 21:00hrs).
To explore the effect of lameness, and possible confounding factors such as parity and days in milk, on cow space-use and behaviour, a cross-sectional study design was used. Prior to the study, all cows in the high yield group were locomotion scored at the exit to the milking
par-lour using the 4-point AHDB Dairy Mobility Score [46] by ZB (where 0 = sound and
3 = severely lame), and re-scored in the main barn by HH the following day. Cows which were known to have had a health incident in the previous three months, including foot lesions and mastitis treatments, were excluded. Two study groups (10 lame cows and 10 non-lame cows)
were selected based on their mobility scores, and to match yield and parity where possible (S1
Table). It should be noted that only cows with a mobility score of 2 (‘lame’) were included in the lame group; score 3 cows (‘severely lame’) were not included due to a low number of cows with this score within the herd, and for ethical reasons (the selected cows would not be treated until the end of the study). Selection of the cows was made without any prior knowledge of their space-use behaviour. Individual parity ranged from 1 to 6 years (mean = 3.25, s.d = 1.44), and for the current parturition period, days in milk (DIM) ranged from 44 to 220 (mean = 125, s.d. = 51.3, and mean daily milk yield (in litres) ranged from 28.7 to 58.4 (mean = 42.5, s.
d. = 6.88), seeS1 Table. At the end of the study period all cows were clinically inspected for
lameness and foot trimming was carried out where appropriate.
The selected cows were fitted with wireless sensors (Ominsense Series 500 Cluster
Geoloca-tion System [28,35,47,48];www.omnisense.co.uk/), to track spatial location in the upper area
of the barn. The Series 500 sensors form a RTLS wireless network able to compute relative
spa-tial locations in (x,y,z) coordinates of each individual sensor within the system using the
arrival time of periodic messages sent from each node to its neighbours to triangulate distances
(note that in this study, cows were restricted to a single elevation, so only the (x,y) coordinates
were used). Thirteen sensors were attached to known fixed positions around the barn and a further eight were positioned within the adjacent collecting yard and milking parlour to
improve network coverage and triangulation measurements (Fig 1A). Validation of sensor
precision and accuracy within this specific barn environment has been reported previously in
[28]. The sensors were found to perform well for spatial tracking of individual cows, although
performance was slightly worse than the commercially advertised specification (95% of mea-surements within 2 m of ground truth; Omnisense Ltd.), which is likely due to metal features
within the barn environment disrupting the sensor signals [28]. The sensors were mounted on
cows using a neck collar that incorporates a counterweight to keep the sensor in a stable
posi-tion at the top of the neck [28,35].
human interventions at these times. In addition, some further minor data loss occurred when sensors occasionally suffered battery failure before being replaced, or when sensor error seem-ingly placed a cow outside the barn (any such coordinates were removed from the analysis). In
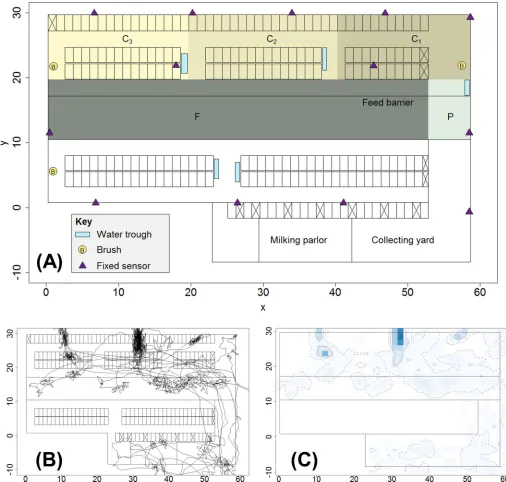
Fig 1. Schematic map of barn and examples of cow movement trajectory and space-use intensity. (A) Schematic map of barn indicating features and areas of
interest. Fixed sensors were positioned on the barn walls to aid tracking of mobile cow-mounted sensors. Areas C1, C2and C3are zones defined to correspond to
the three main cubicle blocks in the upper barn area (CTis the total cubicle area corresponding to the union of C1, C2and C3); area F corresponds to the feeding
zone and includes space either side of the feed barrier; area P is a passageway allowing access from the upper barn area to the collecting yard and milking parlour. (B) Example of a cow trajectory (cow 1078, day 5) produced by smoothing the raw sensor-collected data using a simple moving average over a 15 time-step (2 minute) moving window. (C) Example space-use intensity plot (cow 1078, day 5) produced by overlaying a 1.5m2square grid onto the map of the barn and
counting the cells in which trajectory points are found. Darker colours correspond to higher space-use intensity. The 95% and 50% isopleths are respectively indicated by the dashed and solid contour lines. Note that the plot shows space-use data from the full barn for illustrative purposes; results in the main paper are for location data from the upper barn only, seeFig 2.
total, 876,621 location data points (81% of the theoretical maximum) were collected in the upper barn area and used in the following data analysis. The mean number of location data points collected per day across all cows was 8767 (median = 8930), and the minimum average number of data points collected for a single cow over the 5 days of the study was 8175 data points per day.
The sensor recorded raw location data were smoothed to remove outliers using a simple moving average (SMA) over a two-minute moving window (i.e. 15 data points at the 0.125Hz
sampling rate;Fig 1B). Basic movement and space-use measures calculated directly from the
smoothed sensor location data include the total distance moved per hour, and the meanxand
meanylocations.
A basic analysis of this data set was described in [28], where spatial location data were used
alongside accelerometer data in a decision tree algorithm to classify cow behaviour as either ‘feeding’, ‘non-feeding’, or ‘out of the pen for milking’. Differences in the daily activity budgets between lame and non-lame cows were highlighted, with lame cows spending significantly less
time feeding. However, [28] only considered daily behavioural time budgets and did not
directly consider differences in space-use measures or site fidelity between the lame and non-lame groups as we do in more detail here.
Space-use intensity and the utility distribution
Animal space use intensity can be quantified from location data using a utility distribution
(UD) for each individual animal [49–51]. In many movement data sets, spatial locations are
only recorded at low temporal sampling resolutions or there may be missing data, and a range
of methods have been developed to estimate the UD in such cases [52]. These include kernel
density estimation [50,53], the Brownian bridge movement model (BBMM) [15,54,55],
step-selection analysis [56], and state space models [57]. However, since our location data are
col-lected at high temporal sampling resolution (0.125Hz) with very few missing data points, and we calculate the UD on a daily basis over a confined spatial area, a simple cell-counting
method is much more computationally efficient and will give similar results [52,58].
To determine the daily UD for each individual cow in our data set we overlay a virtual 40 x
13 square grid of 1.5m x 1.5m (= 2.25m2) cells onto the upper barn area (0�x�60, and 10�
y�30 inFig 1A). The cell size is chosen to be slightly larger than the known sensor precision
and to roughly correspond to the area that can be occupied by a single cow. For each cow, each
of the smoothed (x,y) coordinate locations in the upper barn area are assigned to the relevant
grid cell and the count for that cell is increased by one. Any coordinate locations lying outside the upper barn area are removed (corresponding to milking periods or when sensor error resulted in a location outside the barn). The final daily UD is then rescaled to form a discrete probability distribution that sums to 1, by dividing all individual cell counts by the total cell
count across all cells (Fig 1C).
To explore relative space use intensity we use the UD to determine the mean daily propor-tion of time spent in the upper barn area in specific biologically relevant areas of interest (see
Fig 1A): feeding area (F: 0�x�53, 10�y�20); full cubicle area (CT: 0�x�60, 20�
y�30); right-hand cubicle area (C1: 40�x�60, 20�y�30); central cubicle area (C2: 20�
x�40, 20�y�30); and left-hand cubicle area (C3: 0�x�20, 20�y�30). The feeding
area, F, is defined on either side of the physical feed barrier marked inFig 1A, and does not
span the entire width of the barn. A small area on the right-hand side of the barn, marked as P onFig 1A(P: 53�x�60, 10�y�20), serves as a passage and return to the milking parlour. The cubicle areas include fixed cubicle blocks, where cows are able to lie down in individual
In animal home range analysis, the 50% isopleth (the contour line which can be drawn on the UD corresponding to the highest density cells that cumulatively account for 50% of the total observed density) is often considered as the ‘core’ home range of the animal as it contains
those cells where the animal spends the most amount of time [59–63]. Similarly, the 95%
iso-pleth is considered to be the ‘full’ or largest extent of the home range; cells lying outside the 95% isopleth are usually assumed to correspond to noise in the data or to areas only very
infre-quently visited [59–63]. For our location data, we truncate and rescale the UD at both the 95%
isopleth (full range) and 50% isopleth (core range) levels (Fig 1C;Fig 2). We determine the
mean daily size of the full and core ranges for each cow, measured in terms of the number of virtual cells lying inside the relevant isopleth level.
Site fidelity
By comparing the level of overlap or similarity of UDs at different time-points it is possible to determine how the level of consistency of space-use, or site fidelity, of an animal may change
over time [19–21]. Assuming two different discrete UDs that have both been rescaled as
proba-bility distributions, the Bhatacharyya coefficient (or Bhattacharyya’s affinity) is a simple way to
compare the level of similarity or overlap of the UDs [59,64,65]:
Ot1t2¼
P
q2Q
ffiffiffiffiffiffiffiffiffiffiffiffiffiffiffiffiffiffiffiffiffiffiffiffiffiffi
Ut1ðqÞ:Ut2ðqÞ
q
; ð1Þ
whereqrepresents each discrete cell in the spatial grid andUtiðqÞis the probability mass for
that cell at timeti. The Bhattacharyya coefficient ranges from 0 (no overlap) to 1 (full overlap).
We calculate the Bhattacharyya coefficient for each cow using the UD across the full upper barn areas compared across successive days within the study. The space-use similarity score of smaller UDs corresponding to site fidelity in the feeding area (F) only, and the cubicle area (CT) only, are also calculated.We determine an overall measure of the similarity score of corre-sponding UDs over the 5 days of the study (i.e. an overall measure of site fidelity) for each cow by determining the average Bhattacharyya coefficient calculated from each pair of consecutive days:
� O¼1
4
P4
i¼1Otitiþ1 ð2Þ
To check the robustness of results to the averaging procedure used, we also considered two further approaches: averaging the Bhattacharyya coefficient over all possible combinations of pairs of days within the study (10 possible unique pairs in total), and a similar approach but where each pair of days is weighted according to the metric distance between the days before taking the average. However, site-fidelity results were very similar using all three approaches and hence we only report results from the simplest method here.
Statistical analysis of space-use
Although our main interest in this study is to explore behavioural differences between lame and non-lame cows, it is important to also consider potential confounding factors. Hence in the statistical analysis we consider three predictor variables: ‘lameness’ (L, assigned to a binary variable with 1 as lame and 0 as non-lame), ‘parity’ (P), and ‘days in milk’ (D, calculated over
the current parturition only), seeS1 Table. We also considered mean daily yield as a predictor
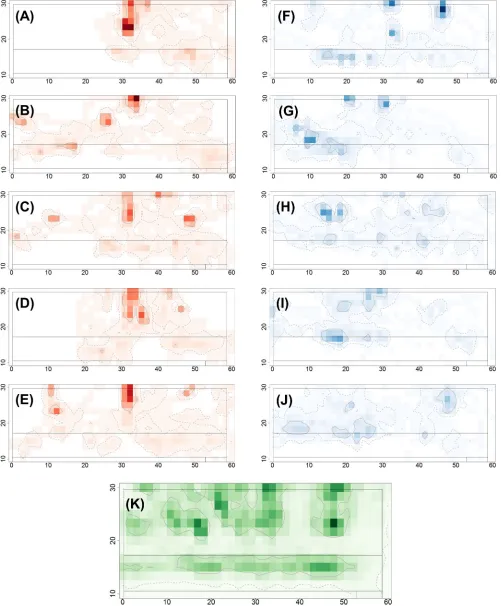
Fig 2. Space use intensity plots illustrating typical utility distributions over the five days of the trial. Plots are shown for (A-E) a single lame cow (cow
‘day’ as a predictor variable in our analysis (S2 Filehighlights no clear trends or differences by day between the lame and non-lame groups for any of the basic space-use measures consid-ered). Similarly, as the study only lasts for 5 days, we do not have a long enough time period of data to consider changes in lameness status (or parity or DIM) during the study (although this may be possible in much longer studies).
In total, sixteen different space-use and site-fidelity dependent variables,S1toS16, were
con-sidered:S1: mean distance moved per hour;S2: meanxcoordinate;S3: meanycoordinate;S4:
proportion of time spent in the feeding area (F);S5: proportion of time spent in the full cubicle
area (CT);S6–S8: proportion of time spent in each of the specific cubicle areas (C1, C2,C3
con-sidered separately);S9: mean size (in virtual cells) of the daily ‘full’ range (corresponding to the
95% isopleth of the UD);S10: mean size (in virtual cells) of the daily ‘core’ range
(correspond-ing to the 50% isopleth of the UD);S11–S16: site fidelity determined for each of three areas (full
upper barn area, feeding area (F) only, and cubicle area (CT) only) for two different isopleth levels (full range = 95%; core range = 50%).
Statistical analysis was undertaken using model selection based on a multivariate linear
(regression) model with the three predictor variables (lameness,L; parity,P; days in milk,D).
Linear models corresponding to all possible combinations of the predictor variables and their
interaction terms were fitted to each of the individual space-use measures,S1toS16in turn:
Si¼a0þa1Lþa2Pþa3Dþinteraction effects; ð3Þ
whereαnare regression coefficients to be determined (α0is the intercept). For each linear
model, the Akaike Information Criterion (AICc; corrected for small sample sizes) was used to
select the best relative fitting model for that space-use measure [66] (the lowest AICc score
cor-responds to the best fitting model). For the best fitting linear model, theF-statistic and
associ-atedp-value are then used to determine whether the model is a significantly better fit (at the 5% level) to the data than an intercept-only model (which does not include any of the predictor
variables). Subsequently, the individualp-values corresponding to each regression coefficient,
αj, are used to determine the significance (at the 5% level) of each predictor variable (and any
interaction effects) within the linear model.
For the multivariate linear regression model to be valid the following assumptions must
hold [67]. Firstly, there must be a linear relationship between the predictor variables and the
dependent variables (we assume this implicitly during the analysis, and also check by examin-ing the data visually in the output plots). Secondly, there must be no multicollinearity between the predictor variables. To test this, Variance Inflation Factor (VIF) scores were calculated for
each predictor variable (LVIF= 1.465776,DVIF= 1.0714,PVIF= 1.3877), and since no scores
were higher than the threshold score of VIF>10, we conclude that there is not a high level of
multicollinearity between our predictor variables [68]. Thirdly, the model residuals must be
normally distributed; and finally, there must be no heteroscedasticity within the data [67]. For
each fitted linear model, we test the residuals for normality using the Shapiro-Wilks test (S-W; 5% significance level) and for heteroscedasticity using the non-constant variance test (NCV; 5% significance level). Regression and model fitting were undertaken using the ‘glm’ and
‘AICc’ functions in R [69].
1.5m square grid (40 x 13 cells) onto the upper barn area only and counting the cells in which the smoothed trajectory points for each cow occur for each day of the trial. Darker colours correspond to higher space-use intensity. The 95% and 50% isopleths (corresponding to the full and core ranges for movement within the upper barn area only) are respectively indicated by the dashed and solid contour lines. (K) Space use intensity plot calculated in the same manner as above but using the aggregated data from all 20 cows over all 5 days of the study.
Predictive model for lameness
To explore the potential predictive capability of the observed dependent variables to correctly classify lameness in individual cows we also consider a generalised linear regression model with logit link function of the form:
log p
1 p
� �
¼b0þb1S1þ � � � þbnSn; ð4Þ
whereβnare regression coefficients to be determined (β0is the intercept),Siare the
corre-sponding values of the observed dependent variables in the previous analysis, andprepresents
the estimated probability from the model that a cow is classified as lame. To avoid over-fitting
the predictive model, we restrict the model selection choice to those dependent variables,Si,
where one or more of the predictor variables were found to be significant in the previous anal-ysis. As above, we determine the best relative fitting model using model selection via the
Akaike Information Criterion score, AICc (corrected for small sample sizes) [66]. Regression
and model fitting were undertaken using the ‘glm’ and ‘AICc’ functions in R [69].
Results
Space-use intensity and other basic space-use measures
Fig 2shows illustrative daily space-use intensity UDs in the upper barn area for a single lame
cow (cow 1078;Fig 2A–2E) and a single non-lame cow (cow 2179;Fig 2F–2J) over the 5 days
of the study (individual plots for all cows and all days of the study are shown inS1 File).Fig 2K
illustrates the aggregated space-use intensity UD for all 20 cows over all 5 days of the study and highlights areas of higher space-use intensity (i.e. inside the 50% isopleth) corresponding to the cubicle and feeding areas, with lower space-use intensity in the corridors and passageways.
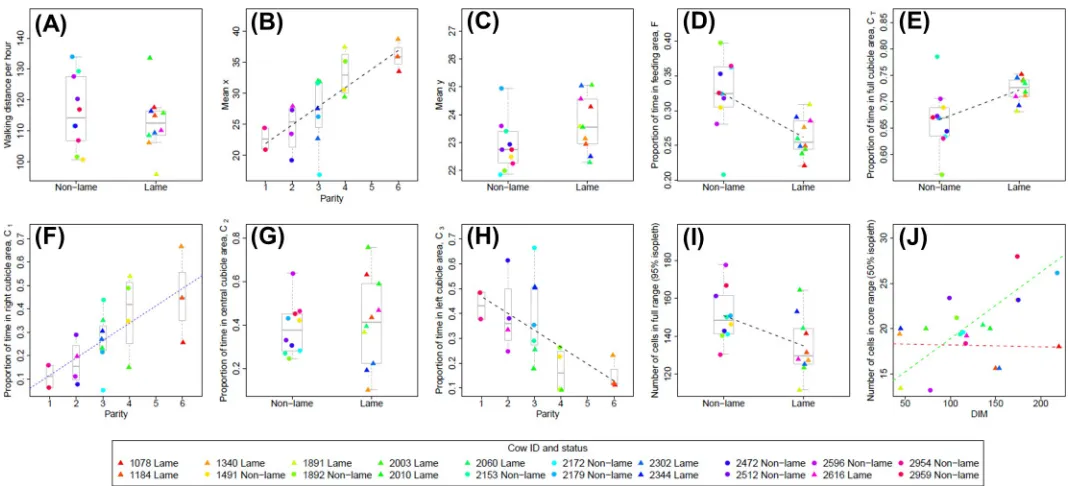
Full results for each basic space-use measure (S1toS10) at the level of each individual cow
are given inS2 Tableand are shown as individual data points inFig 3. Model selection and
subsequent analysis revealed that the predictor variables (lameness, parity, and days in milk)
had statistically significant effects on a number of the space-use measures (Table 1). Lameness
was found to have a significant negative effect on the proportion of time spent in the feeding
area (S4,p= 0.004;Fig 3D), and conversely, had a significant positive effect on the proportion
of time spent in the full cubicles area (S5,p= 0.011;Fig 3E). It should be noted however, that
heteroscedasticity was found to be present in the residuals for this latter result (non-lame cows had significantly higher variance) and hence the result should be treated with caution. A weak
positive effect of lameness on the meanycoordinate (S3,p= 0.08,Fig 3C) is consistent with
these results given the relative location of the cubicle and feeding areas (Fig 1). Lameness was
also found to have a significant negative effect on the full range size (95% isopleth), with
non-lame cows having a larger number of cells in their full range (S9,p= 0.029;Fig 3I).
Parity was found to have a significant positive effect on the proportion of time spent in the
right-hand cubicles, C1(S6, p<0.001;Fig 3F), and a significant negative effect on the
propor-tion of time spent in the left-hand cubicles, C3(S8, p = 0.006;Fig 3H). Given the relative
loca-tions of these cubicle zones (Fig 1), these results are entirely consistent with the fact that parity
also had a significant positive effect on meanxlocation (S2, p<0.001;Fig 3B); higher parity
cows consistently spent more time in the area to the right-hand side of the upper barn. Days in milk was found to have a significant negative effect on the proportion of time spent
in the right-hand cubicles, C1(S6,p= 0.038), although this effect was not as strong as the
(posi-tive) effect of parity within the same linear model (Fig 3F). Days in milk was also found to have
was also a significant negative interaction effect with lameness (p= 0.008), seeFig 3J. This lat-ter result can be inlat-terpreted as days in milk having a (strong) positive effect on core range size for non-lame cows and a (weaker) negative effect on core range size for lame cows (see
respec-tively the green and red dashed lines inFig 3J). However, this somewhat contradicts the
find-ing that lameness (considered on its own within the same linear model) has a weak positive
effect on core range size (p= 0.063). A complicated model interaction effect such as this should
be interpreted with caution given the small sample size within our study.
None of the predictor variables were found to have any significant effects on the mean
hourly walking distance (S1,Fig 3A), or the proportion of time spent in the central cubicle
area, C2(S7,Fig 3G).
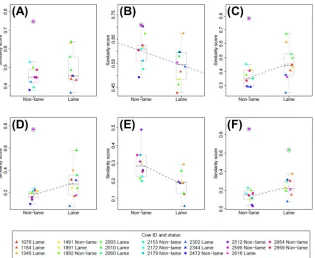
Site fidelity
In general, site fidelity was higher for the full range (95% isopleth;Fig 4A–4C) than for the
core range (50% isopleth;Fig 4D–4F); seeS3 Tablefor site fidelity statistics for individual
cows. Analysis of some site fidelity measures (S11toS14) was strongly affected by a single
out-lier non-lame cow (2596), which resulted in the fitted model residuals being rejected as
nor-mal. Removal of this outlier cow (and also an additional lame outlier cow, 2010, forS16), led to
the model residuals being accepted as normal, and results are presented on this basis. Given the reduced sample size, results with outlier(s) removed should be treated with caution. Only
the fitted model forS15resulted in normally distributed residuals without removal of outliers.
Fig 3. Plots showing relationship between significant predictor variables (lameness; parity; days in milk, DIM) and basic space-use measures. Data for each basic
space-use measure,S1toS10, are shown in plots (a) to (j) respectively, and are plotted against the most significant predictor variable determined from the model
selection procedure (Table 1). Where none of the predictor variables are significant (at the 5% level) for a given model, the data is plotted for the lame and non-lame groups (a, c, g). Where appropriate, boxplots (with median line) are used to show the spread of the data for each level of the predictor variable (a–i). Individual data points are calculated as a mean average across all five days of the trial for each cow (S2 Table). Lame cows are plotted as filled triangles and non-lame cows as filled circles; the colours used to indicate each data point are fixed for each cow and are consistent across all plots (see legend). Where the best fitting linear model includes only a single predictor variable, the fitted regression line is shown as a dashed black line (b, d, e, h, i). In (f) the best fitting linear model includes both parity and DIM terms (Table 1); a regression line fitted only to the parity variable (the most significant predictor) is shown as a blue dashed line for illustrative purposes only. In (j), the best fitting linear model includes lameness, DIM, and an interaction term; regression lines fitted only to the DIM variable are shown for the lame group (red dashed line) and non-lame group (green dashed line) to illustrate the negative interaction of lameness with DIM.
Lameness was the only predictor variable to have a significant effect on site fidelity
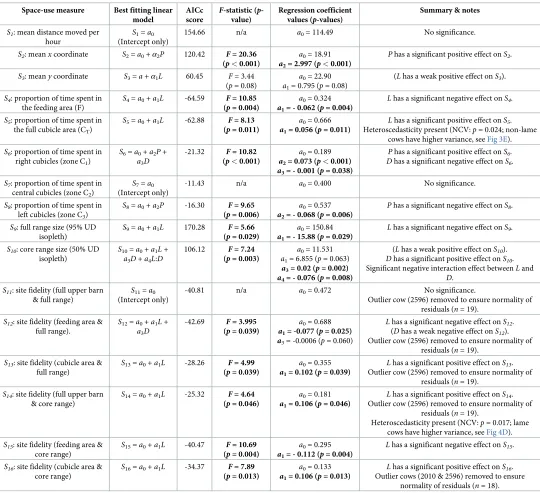
(although days in milk had a weak negative effect onS12). Lame cows had significantly higher
Table 1. Results of model selection for multivariate linear regression models using the predictor variables (lameness, parity and days in milk) for each of the space-use measures considered within the study.
Space-use measure Best fitting linear model
AICc score
F-statistic (p -value)
Regression coefficient values (p-values)
Summary & notes
S1: mean distance moved per
hour
S1=a0
(Intercept only)
154.66 n/a a0= 114.49 No significance.
S2: meanxcoordinate S2=a0+α2P 120.42 F= 20.36 (p<0.001)
a0= 18.91 a2= 2.997 (p<0.001)
Phas a significant positive effect onS2.
S3: meanycoordinate S3=a+α1L 60.45 F= 3.44
(p= 0.08)
a0= 22.90 a1= 0.795 (p= 0.08)
(Lhas a weak positive effect onS3).
S4: proportion of time spent in
the feeding area (F)
S4=a0+a1L -64.59 F= 10.85 (p= 0.004)
a0= 0.324 a1= - 0.062 (p= 0.004)
Lhas a significant negative effect onS4.
S5: proportion of time spent in
the full cubicle area (CT)
S5=a0+a1L -62.88 F= 8.13 (p= 0.011)
a0= 0.666 a1= 0.056 (p= 0.011)
Lhas a significant positive effect onS5.
Heteroscedasticity present (NCV:p= 0.024; non-lame cows have higher variance, seeFig 3E).
S6: proportion of time spent in
right cubicles (zone C1)
S6=a0+a2P+ a3D
-21.32 F= 10.82 (p<0.001)
a0= 0.189 a2= 0.073 (p<0.001)
a3= - 0.001 (p= 0.038)
Phas a significant positive effect onS6.
Dhas a significant negative effect onS6.
S7: proportion of time spent in
central cubicles (zone C2)
S7=a0
(Intercept only)
-11.43 n/a a0= 0.400 No significance.
S8: proportion of time spent in
left cubicles (zone C3)
S8=a0+a2P -16.30 F= 9.65 (p= 0.006)
a0= 0.537 a2= - 0.068 (p= 0.006)
Phas a significant negative effect onS8.
S9: full range size (95% UD
isopleth)
S9=a0+a1L 170.28 F= 5.66 (p= 0.029)
a0= 150.84 a1= - 15.88 (p= 0.029)
Lhas a significant negative effect onS9.
S10: core range size (50% UD
isopleth)
S10=a0+a1L+ a3D+a4L:D
106.12 F= 7.24 (p= 0.003)
a0= 11.531 a1= 6.855 (p= 0.063) a3= 0.02 (p= 0.002)
a4= - 0.076 (p= 0.008)
(Lhas a weak positive effect onS10).
Dhas a significant positive effect onS10.
Significant negative interaction effect betweenLand
D.
S11: site fidelity (full upper barn
& full range)
S11=a0
(Intercept only)
-40.81 n/a a0= 0.472 No significance.
Outlier cow (2596) removed to ensure normality of residuals (n= 19).
S12: site fidelity (feeding area &
full range).
S12=a0+a1L+ a3D
-42.69 F= 3.995 (p= 0.039)
a0= 0.688 a1= -0.077 (p= 0.025)
a3= -0.0006 (p= 0.060)
Lhas a significant negative effect onS12.
(Dhas a weak negative effect onS12).
Outlier cow (2596) removed to ensure normality of residuals (n= 19).
S13: site fidelity (cubicle area &
full range)
S13=a0+a1L -28.26 F= 4.99 (p= 0.039)
a0= 0.355 a1= 0.102 (p= 0.039)
Lhas a significant positive effect onS13.
Outlier cow (2596) removed to ensure normality of residuals (n= 19).
S14: site fidelity (full upper barn
& core range)
S14=a0+a1L -25.32 F= 4.64 (p= 0.046)
a0= 0.181 a1= 0.106 (p= 0.046)
Lhas a significant positive effect onS14.
Outlier cow (2596) removed to ensure normality of residuals (n= 19).
Heteroscedasticity present (NCV:p= 0.017; lame cows have higher variance, seeFig 4D).
S15: site fidelity (feeding area &
core range)
S15=a0+a1L -40.47 F= 10.69 (p= 0.004)
a0= 0.295 a1= - 0.112 (p= 0.004)
Lhas a significant negative effect onS15.
S16: site fidelity (cubicle area &
core range)
S16=a0+a1L -34.37 F= 7.89 (p= 0.013)
a0= 0.133 a1= 0.106 (p= 0.013)
Lhas a significant positive effect onS16.
Outlier cows (2010 & 2596) removed to ensure normality of residuals (n= 18).
Results highlighted in bold indicate significance (p<0.05). For all linear models considered, the intercept was always found to be significant and is always included. The Shapiro-Wilks test was used to test the normality of model residuals: forS11–S14, a single outlier non-lame cow (2596) was removed to ensure normality; forS16, two
outlier cows (2010, lame; 2596, non-lame) were removed to ensure normality. The non-constant variance (NCV) test was used to confirm the absence of
heteroscedasticity in the model residuals (results non-significant, except forS5andS14). AICc = Akaike Information Criterion score, corrected for small sample sizes.L
= lameness (1 = lame, 0 = non-lame),P= parity,D= days in milk.
site fidelity than non-lame cows in the full cubicle area at both the full range (S13,p= 0.039; Fig 4C) and core range (S16,p= 0.013;Fig 4F), and also for the full upper barn area at the core
range (S14,p= 0.046;Fig 4D). However, heteroscedasticity was present in the residuals for this
latter result (lame cows had significantly higher variance in site fidelity). Non-lame cows had
significantly higher site fidelity than lame cows in the feeding area at both the full range (S12,
p= 0.025;Fig 4B) and core range (S15,p= 0.004;Fig 4E). It should be noted that this latter
result is the only fitted model that satisfies the assumption of residual normality without removing outliers from the data, and hence can be considered more robust.
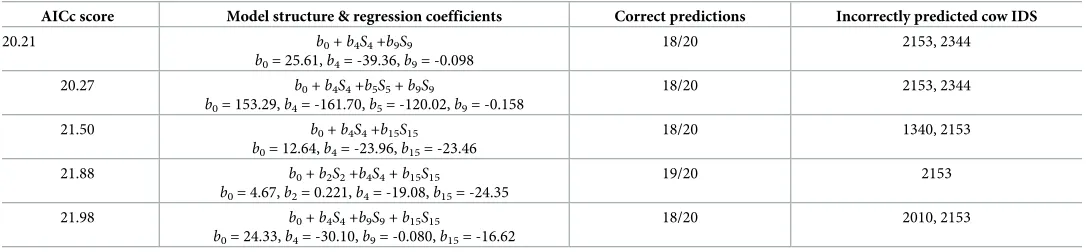
Predictive model for lameness
Table 2illustrates that the predictive model structure with the lowest AIC score, and hence the best relative fitting model (accounting for model complexity), is of the form
log p
1 p
� �
¼b0þb4S4þb9S9; ð5Þ
whereS4is the proportion of time spent in the feeding area, F, andS9is the number of cells in
Fig 4. Plots showing relationship between significant predictor variables (lameness; parity; days in milk, DIM) and site-fidelity similarity measures. Data for each site-fidelity similarity measure,S11toS16, are shown in plots (A)
to (F) respectively, and are plotted against lameness status (which is the most significant predictor variable determined from the model selection procedure (Table 1), in all cases except (A), where no predictor variable is significant). Boxplots are used to show the spread of the data for the non-lame and lame groups, and individual data points are calculated as a mean average across all five days of the trial for each cow (S3 Table). Lame cows are plotted as filled triangles and non-lame cows as filled circles; the colours used to indicate each data point are fixed for each cow and are consistent across all plots (see legend). In (C-F), where the best fitting linear model includes only a single predictor variable, the fitted regression line is shown as a dashed black line. In (B) the best fitting linear model includes both lameness and DIM terms (Table 1); a regression line fitted only to the lameness variable (the most significant predictor) is shown as a blue dashed line for illustrative purposes only. In (A-D) and (F) the outlier cows (2596 and 2010) are marked with a black ring. Outlier cows were not included in the data for the purposes of model fitting (except for (E), where no outlier cows were removed from the data).
the full range (95% isopleth). This model correctly predicts the lameness status of 18 out of the
20 cows within the study (S4 Table). Other model structures that include one or more of the
meanxcoordinate (S2), the proportion of time spent in the full cubicle area (S5), or the site
fidelity in the feeding area (core range,S15), are also able to correctly identify the lameness
sta-tus of at least 18 out of the 20 cows, although these models have a worse AICc score due to hav-ing more complex structures with additional parameters. Across all the best-fitthav-ing models in
Table 2, cow 2153 (non-lame) is always incorrectly classified as lame. However, investigation of the health records for this cow revealed that it may have been misclassified by the expert
observers at the start of the study (seeDiscussion), and hence the models are all essentially
cor-rect in this case.
Discussion
By collecting high resolution spatial location data we have demonstrated in this 5-day cross-sectional study how groups of 10 lame and 10 non-lame cows exhibit a number of statistically
significant differences in their movement and space-use behaviour (Table 1), including level of
site fidelity, range size, and time spent in specific locations of the barn. Furthermore, we have shown that only two of these space-use measures need to be included within a simple statistical model in order to accurately predict the lameness status of all individual cows within the herd (S4 Table). Lameness is one of the key health and welfare issues affecting dairy cattle globally
[3]. Early detection of lameness can reduce animal pain and suffering [5], and also minimise
potential costs to farmers [4]. Current lameness detection methods, usually based on expert
observations of mobility, can be time-intensive [6] and hence there is a need for novel
auto-mated methods of detection. We have demonstrated in this study how a RTLS wireless local positioning system can be used to continuously monitor movement and space-use behaviour at high recording frequency, providing additional sources of behavioural information that
can-not be easily collected using other systems based on accelerometers or video [7,8]. This type of
RTLS space-use monitoring system could potentially be extended within a Precision Livestock
Farming approach [9] to enable automated on-farm prediction of lameness status in individual
cows based on space-use and other behavioural differences.
Table 2. Best fitting model structures considered for logistic regression predictive model with associated Akaike Information Criterion (AICc) scores (corrected for small sample sizes).
AICc score Model structure & regression coefficients Correct predictions Incorrectly predicted cow IDS
20.21 b0+b4S4+b9S9 b0= 25.61,b4= -39.36,b9= -0.098
18/20 2153, 2344
20.27 b0+b4S4+b5S5+b9S9
b0= 153.29,b4= -161.70,b5= -120.02,b9= -0.158
18/20 2153, 2344
21.50 b0+b4S4+b15S15 b0= 12.64,b4= -23.96,b15= -23.46
18/20 1340, 2153
21.88 b0+b2S2+b4S4+b15S15
b0= 4.67,b2= 0.221,b4= -19.08,b15= -24.35
19/20 2153
21.98 b0+b4S4+b9S9+b15S15
b0= 24.33,b4= -30.10,b9= -0.080,b15= -16.62
18/20 2010, 2153
AICc scores are listed in ascending order with lower values corresponding to a better relative model fit. The model is fitted through a logit link function for the lameness binary variable (0 = non-lame, 1 = lame). All models include an intercept. The dependent variables considered in the model selection are those found to be significant in the statistical analysis shown inTable 1and are given by:S2: meanxcoordinate;S4: proportion of time spent in the feeding area (F);S5: proportion of time spent in the
full cubicle area (CT);S9: full range size (95% UD isopleth);S15: site fidelity (feeding area & core range). All other model structures considered had higher AICc scores
(AICc>22) and are not shown.
Our finding that non-lame cows spend a higher proportion of their time in the feeding area (S4,Table 1;Fig 3D), and the equivalent result that lame cows spend more time in the cubicles
area (S5,Table 1;Fig 3E), is consistent with existing studies on feeding behaviour in dairy cows
[26–28,30]. In this study we do not try to distinguish between cows observed in the feeding
area that are actually feeding and those that are not feeding. However, this distinction may be possible by combining basic spatial location data with additional accelerometer data on activity
[28]. Although we didn’t measure feed intake directly in this study, earlier studies have shown
that lame cows may eat the same amount but at a faster rate than non-lame cows [26]. This
may reflect a reduced time spent at the feed face in order to avoid confrontation and competi-tion from other cows, since lame cows are known to be less likely to start an aggressive
interac-tion [10]. Lame cows may also increase their time spent lying [31] in order to reduce
discomfort and pain [1], and this could also explain our observed results.
Non-lame cows had significantly higher site fidelity than lame cows in the feeding area (S12
andS15,Table 1;Fig 4B and 4E), and this result holds at the core range even with the outlier
cow (2596) included in the analysis. Non-lame cows could be more able, or choosing, to com-pete for their preferred food locations and consistently revisit these areas, whereas lame cows
may be avoiding potential competition and confrontation at the feed face [10]. The spacing of
dairy cows at a food trough is known to depend on dominance rank at small group sizes [70],
and both dairy cows and buffalo cows are known to show preferences for specific sites within
the milking parlour [71,72]. In wild animals, high levels of site fidelity in foraging locations
have been observed, albeit with high individual variance related to underlying environmental
conditions or prey availability [20]. When the outlier non-lame cow (2596) is removed from
the analysis then lame cows are found to have significantly higher site fidelity than non-lame cows in the upper barn area for their core range and also for the cubicles area at both their full
range and core range (S13,S15, andS16,Table 1;Fig 4C, 4E and 4F). This indicates that lame
cows are more likely than non-lame cows to return to the same location within the cubicles area on a day-to-day basis. It should be noted that investigation of farm health records for cow 2596 showed no evidence of any serious underlying health issues or related treatments before or after the study period, and with this cow included in the analysis, the results are no longer significant and the linear model is not valid (due to non-normality of residuals). The apparent
pattern of higher site fidelity shown in these areas by lame cows (Fig 4) should be investigated
further in future studies with larger sample sizes.
Non-lame cows had a significantly larger full range size than lame cows (S9,Table 1;Fig 3I),
even though there was no difference in total walking distance between the two groups (S1,
Table 1;Fig 3A). In contrast, the core range size was (weakly) positively influenced by
lame-ness, and by the number of days in milk (S10,Table 1), with a negative interaction term
between the two predictor variables (Fig 3J). However, the complexity of this model means it
should be treated with some scepticism given the small sample sizes in the study (the complex model structure could potentially be due to the influence of a small number of specific individ-ual cows). Additionally, although the sizes of the full and core ranges for each individindivid-ual cow are an important measure of how they use the space available within the barn, they may not capture all relevant features of their behaviour; areas visited very infrequently may still be bio-logically important (e.g. visits to the water trough or brush may be infrequent, but still play an important role in the daily activity of each cow).
Parity was found to have a strong effect on the horizontal (meanx) location within the barn
(S2, p<0.001;Fig 3B), with higher parity cows spending more time in the right-hand cubicles,
C1(S6, p<0.001;Fig 3F), and lower parity cows spending more time in the left-hand cubicles,
C3(S8, p = 0.006;Fig 3H). The right-hand side of the barn used in our study corresponds to
horizontal location could be because older and more experienced (higher parity) cows are choosing to stay near the connecting passage to the milking parlour in order to get a better position in the milking queue. Disease status is also known to affect milking order, with lame
cows more likely to be found in the last third of the milking [29,73] and taking longer to return
from the milking parlour [11]. Similarly, cows suffering from mastitis were found to enter the
milking parlour later [74], although the same study reported no effect of age, parity or days in
milk on milking order. An alternative interpretation of our results is that when returning from milking, the older higher parity cows in our study are simply not spreading out within the barn as much as younger cows, possibly because they have longer bouts of low activity (stand-ing or ly(stand-ing) and spend less time feed(stand-ing. For example, previous studies have reported that pri-miparous (parity 1) cows have significantly more lying bouts of shorter duration when
compared to parity 2 and parity 3+ groups [75] and that parity 1 and 2 cows spend more time
feeding than parity 3+ cows [76]. Higher parities have also been associated with longer
stand-ing times [77]. It is also possible that there is a social aspect to this observed space-use
behav-iour, with cows of similar parity staying close to each other in different areas of the barn for social reasons. Other potential factors such as localised air quality, temperature, wind, and noise may also influence the preferential use of certain locations within the barn by individual cows, but were variables that were not measured in this study.
Days in milk (DIM) was found to have a significant negative effect on the proportion of
time spent in the right-hand cubicles, C1(S6,p= 0.038) and a significant positive effect on the
core (50% isopleth) range size, (S6,p= 0.002) with an associated negative interaction effect
with lameness (Fig 3J). Various studies have reported increased lying behaviour with increased
DIM [78,79], while increased DIM has also been shown to lead to decreased feeding frequency
but increased meal duration and total feeding time [76]. The interplay between DIM, parity
and lameness is clearly complex, and further studies are needed to explore how observed space-use behaviour is driven by each of these factors and their potential interactions.
Although we have high resolution spatial location data for each individual cow, we also have relatively small sample sizes (10 lame and 10 non-lame cows) and the cross-sectional study ran for only 5 days. Hence, although our results have exciting potential, we are cautious about over-generalisation. In particular, the model parameter values found during the statisti-cal analysis are specific to this study group and barn environment and will almost certainly be different for other cows or other barn locations. We have demonstrated how space-use mea-sures in individual cows are linked to health (lameness) status, parity, and (to a lesser extent) days in milk, but space-use behaviour is also likely to be influenced by management actions, the barn landscape and layout, the frequency of milking and the milking system used
(auto-mated v milking parlour), and individual cow age and breed [8]. Similar to [8], as we have
compared to lower parity cows (Fig 3F and 3H) hints at a possible social aspect to their space-use behaviour. More detailed analysis of social behaviour could be undertaken by exploring
network features within the herd as a whole [80], or through pairwise analyses of space-use
and space-use similarity [23,49,63,64,81].
Our aim with the predictive model in Eq (4) is to illustrate the ‘proof of concept’ of how
observed space-use behavioural data can be used to give an accurate prediction of lameness status in individual cows in this cross-sectional study. As it stands, the model is not directly transferable to other groups of cows or barn locations and would need to be adapted and tested before being used in other farm environments. Nevertheless, it demonstrates the principle of how only a few simple space-use measures could be used to accurately determine lameness sta-tus for individual cows within a herd. The best relative fitting model structure only included
time spent in the feeding area, and the number of virtual cells in the full range (Table 2),
dem-onstrating that as few as two simple space-use measures are needed to give a good description of lameness status in this study group of cows. Such a simple predictive model could poten-tially be quickly adapted and parameterised for practical on-farm use (assuming the general results hold), unlike more complex predictive models that might require computationally intensive model fitting or continuous re-parametrisation.
Out of 20 cows, only one lame cow (2344) and one non-lame cow (2153) were incorrectly
classified by the best-fitting predictive model (Table 2,S4 Table). Investigation of the health
records of cow 2153 suggests that she was likely to have been misclassified as ‘non-lame’ before the study by the expert observers (through mobility scoring), as lesions with the potential to cause lameness were found on her feet when all cows were inspected at the end of the study period (and hence the model prediction was essentially correct, and was able to detect this ear-lier misclassification by the expert observers). In March 2014 shortly after our study was com-pleted this cow underwent a series of 11 treatments for mastitis and was eventually culled early. Mastitis is also known to affect dairy cow behaviour, with reduced lying times, reduced feed intake and a reduction in competitive behaviour at the feeder compared to healthy cows
[32,82]. No other cows from the non-lame trial group had treatments for any health conditions
during the study period (or for at least 3 months after the study had finished). Meanwhile, when inspected at the end of the study period, cow 2344 (lame) was found to be wearing a hoof block, which is fitted to relieve pressure on the affected areas of the hoof, and hence this may have potentially reduced clinical signs and changes in behaviour related to lameness for this cow. No other cows in the lame group had similar treatments during the study period (or for at least 3 months after the study had finished).
Increasing demand for animal products and intensification of farming practices in general, means that there is a need for automated behavioural monitoring systems that can act as an ‘early warning’ to detect and predict the health status of managed animals, including dairy
cows suffering from lameness and other diseases [7,8,26,83]. Automated lameness detection
technology systems have been developed based on the identification of an abnormality of gait
or posture [83], using force plate technology [7,84] or kinematics [85]. Meanwhile, automated
monitoring of feeding behaviour in cattle has relied on electronic feed troughs [27,30].
How-ever, there has not been a widespread uptake of such systems on commercial farms due to the
high price, practical limitations such as lack of space, or limited precision of detection [7].
Automated lameness detection systems based on differences in locomotion or activity patterns observed in accelerometer data have been suggested as a lower cost alternative approach
[7,8,35]. The results we present here suggest that space-use and site-fidelity measures could be
The use of space-use and site-fidelity measures as health status indicators does not need to be limited to cattle or dairy cows, and similar approaches could also potentially be used with other managed animal species or even wild animals, if similar differences in space-use behav-iour linked to health status are found to exist. Little is known about the direct link between space-use behaviour and health in pigs, although there is evidence suggesting that
impover-ished environments contribute to high levels of boredom and apathy [86]. It should be
straightforward to monitor space-use patterns of individual pigs using automated wireless positioning system in a similar manner to what we have done in this study with dairy cows. In
the context of broiler chickens, [87] showed how optical flow, a measure of the movement and
flow of the flock as a whole through the space within the barn determined by computer vision techniques, could be directly linked to the health and disease status of the flock, illustrating how space-use metrics at the group-level can also be used as indicators for welfare monitoring.
Conclusions
We have demonstrated in this study how location tracking data collected from animal-mounted wireless sensors using a Real Time Location System can be processed and analysed to give a suite of space-use behavioural measures. We have used these measures to explore dif-ferences in space-use behaviour in two test groups of barn-housed dairy cows in a cross-sec-tional study design, and found significant differences between lame and non-lame individuals. Non-lame cows had higher site fidelity, and spent more time, in the feeding area, and had a larger range within the barn. In contrast, lame cows spent less time in the feeding area and more time in the cubicle areas of the barn, where they had higher site fidelity. Space-use behav-iour was also found to be influenced by parity and days in milk: higher parity cows had a mean location closer to where the connecting passage to the milking parlour is situated, and days in milk was found to influence the core range size. We have demonstrated that only two simple space-use measures, proportion of time spent in the feeding area and full range size, are needed within a simple statistical model in order to accurately predict the lameness status of all individual cows within the herd. The sample size used within this study (10 lame and 10 non-lame cows) was small and hence care should be taken in directly extrapolating our results and conclusions to other studies and contexts. However, the general findings and associated methods for exploring animal space-use could potentially be developed in future studies to form a new set of tools for automated monitoring of dairy cattle, or for monitoring, detecting and predicting health status in other managed or wild animal species.
Supporting information
S1 Table. Health and milk production data for cows used within the study. (DOCX)
S2 Table. Summary space-use statistics for each cow within the study. (DOCX)
S3 Table. Summary site-fidelity statistics for each cow within the study. (DOCX)
S4 Table. True and predicted probability of lameness for each cow in the study using best relative fitting predictive model.
(DOCX)
calculated by overlaying a 1.5m x 1.5m square grid (40 x 13 cells) onto the upper barn area only and counting the cells in which the smoothed trajectory points for each cow occur for each day of the trial. Darker colours correspond to higher space-use intensity. The 95% and 50% isopleths (corresponding to the full and core ranges for movement within the upper barn area only) are respectively indicated by the dashed and solid contour lines.
(PDF)
S2 File. Basic space-use measures for each study day. S2 File contains box-plots showing basic space-use measures by day of the trial. Lame cows are marked using triangles and non-lame cows are marked using circles. The colours used to indicate each cow are consistent across all plots. There are no clear trends by day in any of the basic space-use measures considered. (PDF)
S3 File. Location data for all cows and study days. S3 File contains the raw location tracking data for each cow for each day of the study as used in the analysis.
(CSV)
Acknowledgments
We are very grateful to all the farm staff who helped to facilitate this study.
Author Contributions
Conceptualization: Zoe E. Barker, Jonathan R. Amory, Edward A. Codling.
Data curation: Zoe E. Barker, Holly R. Hodges, Jonathan R. Amory, Edward A. Codling.
Formal analysis: Jorge A. Va´zquez Diosdado, Edward A. Codling.
Funding acquisition: Jonathan R. Amory, Darren P. Croft, Nick J. Bell, Edward A. Codling.
Investigation: Jorge A. Va´zquez Diosdado, Zoe E. Barker, Holly R. Hodges, Jonathan R. Amory, Nick J. Bell, Edward A. Codling.
Methodology: Jorge A. Va´zquez Diosdado, Zoe E. Barker, Holly R. Hodges, Jonathan R. Amory, Darren P. Croft, Edward A. Codling.
Project administration: Jonathan R. Amory, Darren P. Croft, Nick J. Bell, Edward A. Codling.
Resources: Jonathan R. Amory, Edward A. Codling.
Software: Jorge A. Va´zquez Diosdado, Edward A. Codling.
Supervision: Jonathan R. Amory, Nick J. Bell, Edward A. Codling.
Validation: Jorge A. Va´zquez Diosdado, Zoe E. Barker, Holly R. Hodges, Jonathan R. Amory, Nick J. Bell, Edward A. Codling.
Visualization: Jorge A. Va´zquez Diosdado, Edward A. Codling.
Writing – original draft: Jorge A. Va´zquez Diosdado, Edward A. Codling.
Writing – review & editing: Jorge A. Va´zquez Diosdado, Zoe E. Barker, Jonathan R. Amory, Darren P. Croft, Nick J. Bell, Edward A. Codling.
References
2. Leach KA, Whay HR, Maggs CM, Barker ZE, Paul ES, Bell AK, et al. 2010 Working towards a reduction in cattle lameness: 1. Understanding barriers to lameness control on dairy farms. Res. Vet. Sci. 89, 311–317. (https://doi.org/10.1016/j.rvsc.2010.02.014) PMID:20363487
3. Archer S, Bell N, Huxley J. 2010 Lameness in UK dairy cows: a review of the current status. In Pract. 32, 492–504. (https://doi.org/10.1136/inp.c6672)
4. Willshire JA, Bell NJ. 2009 An economic review of cattle lameness. Cattle Pract. 17, 136–141. 5. Leach KA, Tisdall DA, Bell NJ, Main DCJ, Green LE. 2012 The effects of early treatment for hindlimb
lameness in dairy cows on four commercial UK farms. Vet. J. 193, 626–632. (https://doi.org/10.1016/j. tvjl.2012.06.043) PMID:22884565
6. Horseman SV, Roe EJ, Huxley JN, Bell NJ, Mason CS, Whay HR. 2014 The use of in-depth interviews to understand the process of treating lame dairy cows from the farmers’ perspective. Anim. Welf. 23, 157–169.
7. Van Nuffel A, Zwertvaegher I, Van Weyenberg S, Pastell M, Thorup VM, Bahr C, et al. 2015 Lameness Detection in Dairy Cows: Part 2. Use of Sensors to Automatically Register Changes in Locomotion or Behavior. Anim. Open Access J. MDPI 5, 861–885. (https://doi.org/10.3390/ani5030388) PMID:
26479390
8. Beer G, Alsaaod M, Starke A, Schuepbach-Regula G, Mu¨ller H, Kohler P, et al. 2016 Use of Extended Characteristics of Locomotion and Feeding Behavior for Automated Identification of Lame Dairy Cows.
PloS One 11, e0155796. (https://doi.org/10.1371/journal.pone.0155796) PMID:27187073
9. Berckmans D. 2014 Precision livestock farming technologies for welfare management in intensive live-stock systems. Rev. Sci. Tech. Int. Off. Epizoot. 33, 189–196.
10. Galindo F, Broom DM. 2002 Effects of lameness of dairy cows. J. Appl. Anim. Welf. Sci. JAAWS 5, 193–201. (https://doi.org/10.1207/S15327604JAWS0503_03) PMID:12578740
11. Juarez ST, Robinson PH, DePeters EJ, Price EO. 2003 Impact of lameness on behavior and productiv-ity of lactating Holstein cows. Appl. Anim. Behav. Sci. 83, 1–14. (https://doi.org/10.1016/S0168-1591 (03)00107-2)
12. Ceballos A, Sanderson D, Rushen J, Weary DM. 2004 Improving stall design: use of 3-D kinematics to measure space use by dairy cows when lying down. J. Dairy Sci. 87, 2042–2050. (https://doi.org/10. 3168/jds.S0022-0302(04)70022-3) PMID:15328216
13. Nathan R, Getz WM, Revilla E, Holyoak M, Kadmon R, Saltz D, et al. 2008 A movement ecology para-digm for unifying organismal movement research. Proc. Natl. Acad. Sci. 105, 19052–19059. (https:// doi.org/10.1073/pnas.0800375105) PMID:19060196
14. Homburger H, Lu¨scher A, Scherer-Lorenzen M, Schneider MK. 2015 Patterns of livestock activity on heterogeneous subalpine pastures reveal distinct responses to spatial autocorrelation, environment and management. Mov. Ecol. 3, 35. (https://doi.org/10.1186/s40462-015-0053-6) PMID:26457186
15. Martin J, Benhamou S, Yoganand K, Owen-Smith N. 2015 Coping with Spatial Heterogeneity and Tem-poral Variability in Resources and Risks: Adaptive Movement Behaviour by a Large Grazing Herbivore.
PLOS ONE 10, e0118461. (https://doi.org/10.1371/journal.pone.0118461) PMID:25719494
16. Bo¨rger L, Dalziel BD., Fryxell JM. 2008 Are there general mechanisms of animal home range behav-iour? A review and prospects for future research. Ecol. Lett. 11, 637–650. (https://doi.org/10.1111/j. 1461-0248.2008.01182.x) PMID:18400017
17. Riotte-Lambert L, Benhamou S, Chamaille´ -Jammes S. 2013 Periodicity analysis of movement recur-sions. J. Theor. Biol. 317, 238–243. (https://doi.org/10.1016/j.jtbi.2012.10.026) PMID:23108209
18. Van Moorter B, Visscher D, Benhamou S, Bo¨rger L, Boyce MS., Gaillard J-M. 2009 Memory keeps you at home: a mechanistic model for home range emergence. Oikos 118, 641–652. (https://doi.org/10. 1111/j.1600-0706.2008.17003.x)
19. Martı´nez-Miranzo B, Banda E, Gardiaza´bal A, Ferreiro E, Aguirre JI. 2016 Differential spatial use and spatial fidelity by breeders in Bonelli’s Eagle Aquila fasciata. J. Ornithol. 157, 971–979. (https://doi.org/ 10.1007/s10336-016-1347-1)
20. Arthur B, Hindell M, Bester M, Trathan P, Jonsen I, Staniland I, et al. 2015 Return Customers: Foraging Site Fidelity and the Effect of Environmental Variability in Wide-Ranging Antarctic Fur Seals. PLOS
ONE 10, e0120888. (https://doi.org/10.1371/journal.pone.0120888) PMID:25807082
21. Brough AM, Justin DeRose R, Conner MM, Long JN. 2017 Summer-fall home-range fidelity of female elk in northwestern Colorado: Implications for aspen management. For. Ecol. Manag. 389, 220–227. (https://doi.org/10.1016/j.foreco.2016.11.034)