RVC OPEN ACCESS REPOSITORY – COPYRIGHT NOTICE
This author’s accepted manuscript may be used for non-commercial purposes in accordance with Wiley Terms and Conditions for Self-Archiving.
The full details of the published version of the article are as follows:
TITLE: Effect of varying the dose of corn syrup on the insulin and glucose response to the oral sugar test.
AUTHORS: Jocelyn NA, Harris PA, Menzies-Gow NJ JOURNAL: EQUINE VETERINARY JOURNAL PUBLISHER: Wiley
Title: Effect of varying the dose of corn syrup on the insulin and glucose response to the oral 1
sugar test 2
3
Natasha A. Jocelyn MA VetMB MRCVS (1), Patricia A. Harris MA PhD VetMB 4
DipECVCN MRCVS (2) and Nicola J. Menzies-GowMA VetMB PhD DipECEIM Cert EM 5
(int med) MRCVS (1) 6
7
Contact: 8
(1) Department of Clinical Sciences and Services, Royal Veterinary College, London, UK 9
(2) WALTHAM Centre for Pet Nutrition, Freeby Lane. Melton Mowbray, LEICS, LE14 10
4RT. UK 11
Key Words: Horse, insulin dysregulation, insulin, glucose, laminitis 12
13
Word Count: 4273 14
15
Ethical Animal Research 16
The study was conducted under Home Office Project Licence with ethical approval from 17
Royal Veterinary College Animal Welfare Ethical Review Board. 18
19
Authorship: 20
N. A. Jocelyn, N.J. Menzies-Gow and P.A. Harris contributed to the study design, preparation 21
and final approval of the manuscript. N.A. Jocelyn and N.J. Menzies-Gow contributed to the 22
study execution, data analysis and interpretation. 23
24
Dr Harris is employed by the study funder. 26
27
Sources of Funding 28
WALTHAM Centre for Pet Nutrition. 29
30
Acknowledgements 31
The authors acknowledge the help of Edward Knowles with data acquisition. 32
33
34
35
36
37
38
39
40
41
42
43
44
45
46
47
48
49
51
Reasons for performing study: The oral sugar test (OST) is used to identify equine insulin 52
dysregulation (ID); however only a dose of 0.15 ml/kg bwt corn syrup (Karo Light Corn 53
Syrup)a has been evaluated.
54
55
Objectives: To determine the effect of varying the dose of corn syrup syrup on insulin and 56
glucose response to the OST and the test’s ability to distinguish between ponies with (PL) 57
and without (NL) a history of laminitis. 58
59
Study Design: Randomised crossover experiment. 60
61
Methods: After an overnight fast, in a 3-way randomised crossover study with a 7-day 62
washout, 0.15 ml/kg bwt, 0.3 ml/kg bwt or 0.45 ml/kg bwt corn syrup (Karo Light Corn 63
Syrup)a was administered orally to eight ponies (5PL, 3NL) and blood obtained between 0
64
and 120 min. Serum [insulin] and [glucose] were measured using previously validated 65
radioimmunoassay and colorimetric assays respectively. The repeatability of and the effect of 66
continued pasture access on the dose that best distinguished PL and NL ponies was then 67
assessed. The effect of dose, laminitis history and fasting on serum [insulin] and [glucose] 68
responses were assessed using mixed effects models. 69
70
Results: The serum [insulin] following 0.15 ml/kg bwt were not significantly different from 71
0.3 ml/kg bwt at any time point; whilst serum [insulin] following 0.45 ml/kg bwt 72
significantly (p<0.01) differed from 0.15 ml/kg bwt and 0.3 ml/kg bwt at all time points apart 73
0.45 ml/kg bwt at 60 min. Repeatability of serum [insulin] at 60 min following 0.45 ml/kg 76
bwt dose under fasted conditions was 0.51. Using AUC insulin improved repeatability to 77
0.83. There was no significant difference between the fasted and at pasture results. 78
79
Main Limitations: The OST was performed in small numbers of ponies on limited 80
occasions. 81
82
Conclusions: A dose of 0.45 ml/kg bwt corn syrup may be preferable to differentiate PL and 83
NL ponies. 84
85
86
87
88
89
90
91
92
93
94
95
96
97
98
Introduction 100
Insulin dysregulation (ID) in the horse encompasses fasting hyperinsulinaemia, an excessive 101
insulin response to oral carbohydrates and tissue insulin resistance [1]. The importance of ID 102
and its association with an increased risk of laminitis [2] is clinically relevant to practitioners 103
and a practical reliable and repeatable test for ID diagnosis would therefore be advantageous 104
[3]. The oral sugar test (OST) has been advocated as simple field based dynamic test to 105
identify equids with an excessive insulin response following ingestion of carbohydrate [4] 106
and tissue insulin resistance [5]. Ease of administration of the sugar in syrup form and the 107
possibility of obtaining a single blood sample post-administration make the OST an attractive 108
option for use by practitioners. 109
110
Initial work suggested a good positive correlation between the OST and the intravenous 111
glucose tolerance test [4] and the OST and the oral glucose test [6]. However recent 112
publications found the OST to have poor sensitivity [7] and no significant relationship when 113
directly compared to other ID testing [8]. Both these studies [7,8] however, compare 114
intravenous tests, which are measures of tissue insulin resistance to the OST. The OST is a 115
test that explores ID characterised by an excessive response to oral carbohydrate and thus 116
evokes the enteroinsular axis [9]. As such, a direct association is not expected. Repeatability 117
has varied from acceptable [10] to poor [11]. 118
119
A single dose of 0.15ml/kg bwt corn syrup (Karo Light Corn Syrup)a for the OST has been
120
used [11] [12], but limited differing doses have been investigated [13]. Higher doses, which 121
provide amounts of sugar more similar to the oral glucose test, may afford improved 122
outcomes [8]. Another study [11] with ponies at pasture found significant differences 125
between fasting and fed state for area under curve insulin and insulin concentration at 60,75 126
and 90 minutes, however dichotomous interpretation for ID was similar using study identified 127
cut-off values. 128
129
The aim of this study was to evaluate the effect of varying the dose of corn syrup on 1) the 130
insulin and glucose response and 2) the ability of the OST to distinguish between ponies with 131
a history of laminitis (PL) and non-laminitic ponies (NL). Once an optimal dose was 132
identified, further aims of the study were to further explore this dose with respect to 133
repeatability, season and the effect of fasting. 134
135
Materials and Methods 136
Animals 137
Eight British native pony mares from a research herd kept at pasture were used in the study. 138
All were clinically healthy, aged between 12 and 23 years and weighing between 245-441kg 139
(Supplementary information 1); 5 had a known clinical history of laminitis but had no active 140
signs of laminitis in the 3 months prior to and during the entire study period; 3 had no history 141
of laminitis. All of the animals had been part of the herd for at least 10 years. None had 142
clinical signs of pituitary pars intermedia dysfunction and basal ACTH concentrations were 143
within the seasonally adjusted reference range. 144
145
Study design 146
147
The study was undertaken in December 2015. All eight ponies were brought into a bare dirt 149
paddock the night before each study day. Haylage was provided to last until midnight and 150
adlib water was provided throughout. The following morning, a 14 g jugular catheter 151
(Angiocath)b was placed under local anaesthesia (Intra-Epicaine)c and a baseline blood
152
sample obtained (T0). In a randomised crossover design, animals were given either 0.15ml/kg 153
bwt, 0.3ml/kg bwt or 0.45ml/kg bwt corn syrup (Karo Light Corn Syrup)a by oral syringe.
154
Further blood samples were collected at 30, 60, 75, 90 and 120 (T30–120) min after oral 155
dosing. A 7-day washout period between doses was undertaken during which times the 156
animals were kept at pasture. 157
158
Analysis of the corn syrup (Karo Light Corn Syrup)a using the following method (Longland
159
personal communication) found it to contain 356.3 mg/ml of maltose and glucose combined. 160
(Supplementary information 2) The doses used therefore equated to 161
53.4mg/106.9mg/160.3mg/kg bwt of maltose and glucose combined respectively. Samples 162
were diluted on a weight/volume basis (100mg/ml). Then 50 µL of sample were added to 950 163
µL of a buffer comprising 5 mMH2SO4 with a 5 mM crotonic acid internal standard. Samples
164
were analyzed using via high-performance liquid chromatographyd. Injection volume was 25
165
µL. Sugars were separated on a Rezex ROA-Organic acid columne and a mobile phase of 5
166
µM H2SO4 at 0.6 ml min-1. Sugars were detected with a refractive index detector and
167
identified by comparison with an internal library of standard compounds. 168
169
Blood for serum insulin concentration measurement was collected into plain tubes 170
(vacutainer)a and allowed to clot at 37°C for at least 20 min. Blood for glucose concentration
171
measurement was collected into fluoride oxalate tubes (vacutainer)a. All samples were
centrifuged (3000 x g) for 10 min at 4°C and the serum or plasma stored at -80°C before 173
analysis 174
Repeatability Study 175
The study was undertaken in June 2016. The OST was repeated with all eight ponies 176
receiving 0.45ml/kg bwt corn syrup (Karo Light Corn Syrup)c on 2 occasions with a 7-day
177
washout period between. 178
179
Fasting vs Fed Study 180
Seven days after the repeatability study was completed, the OST was repeated for a third time 181
with all ponies receiving 0.45ml/kg bwt corn syrup (Karo Light Corn Syrup)c, however the
182
ponies were not fasted and instead remained at pasture prior to and during the study. 183
184
Sample analysis 185
Serum insulin concentrations were measured using a radioimmunoassay (Insulin CT)f and
186
serum glucose using a colorimetric assay (Glucose Colormetric Assay Kit)g. All samples
187
were measured in duplicate and both assays had been previously validated for use in ponies 188
[11]. 189
190
Data analysis 191
All analysis was performed using statistical (IBM SPSS Statistics 22)h and graphic (Graphpad
192
Prism)i software. The area under the curve (AUC) was calculated for the full insulin response
193
(T0-120; AUCi), insulin response at T0,60 and 90 (AUCinsulinmodified; AUCiM) and full glucose
194
response(AUCg) for each test using the trapezoidal sum method with the x axis (y = 0) as the
195
baseline insulin or glucose concentration. Linear mixed effects models were generated to 196
NL/PL and their interactions were initially included as fixed variables and removed 198
according to statistical significance. Pony was included as a random variable. Insulin 199
concentration/ AUCi/AUCiM, maximal insulin concentration (Cmaxi),time to maximal insulin
200
concentration (TmaxiM), maximal insulin concentration T0,60 and 90, glucose concentration/
201
AUCg, maximal glucose concentration(Cmaxg) and time to maximal glucose concentration,
202
(Tmaxg) were the outcome variables examined and an auto- regressive covariance structure
203
(AR1) was used. Estimated marginal means were calculated from the final model and 204
pairwise post-hoc comparisons were performed (without adjustment of confidence intervals 205
for multiple comparisons/least significant difference). The normality of the distribution of the 206
residuals was assessed by histogram to ensure normality. Linear mixed effects model was 207
repeated using the 0.45ml/kg bwt dose and differences between NL and PL investigated. 208
Sampling time (for single time points), NL/PL, pasture, season and their interactions were 209
initially included as fixed variables and removed according to statistical significance. 210
Repeatability was assessed using repeated measures [14], briefly, using estimates of 211
covariance parametersthe pony variance was divided by the sum of residual and pony 212
variance combined. Statistical significance was set at P<0.05. 213
214
Results 215
No adverse effects were seen in any of the ponies throughout the two study periods. All 216
ponies tolerated the corn syrup administration very well and received the full dose on all 217
occasions. 218
219
Insulin 220
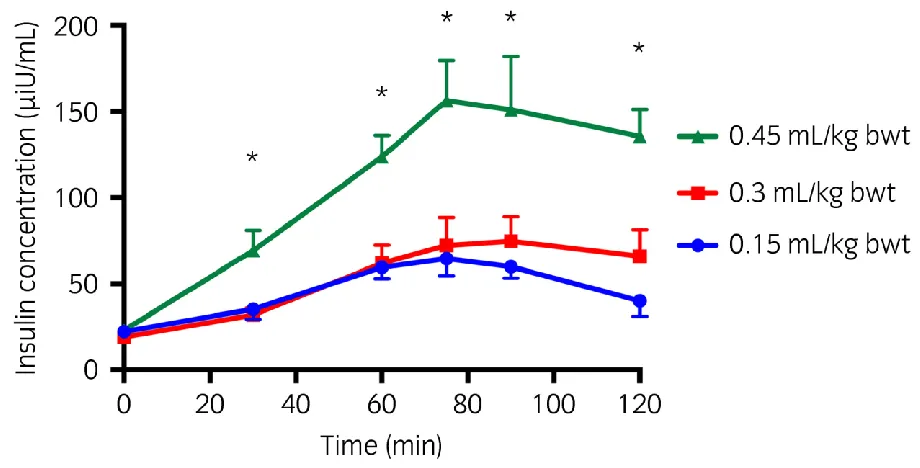
The serum insulin concentration was significantly different for both 0.15 ml/kg bwt and 0.3 222
ml/kg bwt dose compared to the 0.45 ml/kg bwt at all time points apart from T0 for all ponies
223
combined (P<0.001); whilst the 0.15 ml/kg bwt and 0.3 ml/kg bwt doses were not 224
significantly different at any time point (Figure 1). The Cmaxi was significantly (P<0.001)
225
greater following 0.45ml/kg bwt dose (mean 174 [95% CI 141, 206] μiu/ml) compared to 226
either 0.15ml/kg bwt (72 [95% CI 39, 104] μiu/ml) or 0.3ml/kg bwt dose (87 [95% CI 54, 227
119] μiu/ml). 228
229
When the serum insulin concentrations were compared between the two groups of ponies 230
(NL and PL) at the 6 time points, the only significant (P=0.04) relationship between group 231
and dose was at 60 minutes for the 0.45ml/kg bwt dose (NL mean 86 [95% CI 59, 113] vs PL 232
146 [95% CI 124, 167] iu/ml; Figure 2). The 0.45ml/kg bwt dose with an insulin 233
concentration cut off value of ≥ 110 µiu/ml at 60 min allowed for correct identification of all 234
5 PL and 3 NL ponies for the current data. 235
236
When the results from the two groups of ponies (NL and PL) were compared, there was a 237
significant interaction (P=0.05) between dose and group for AUCi. There was a significant
238
(p=0.01) difference between NL and PL for AUCi following 0.45ml/kg bwt, but not
239
following 0.15ml/kg bwt or 0.3 ml/kg bwt (Table 1). The 0.45ml/kg bwt dose with an AUCi
240
cut off value of ≥ 10,000 µiu/ml/min allowed for correct discrimination of all 5 PL and 3 NL 241
ponies. There was no significant interaction between dose and group for Cmaxi and Tmaxi
242
(Table 1). 243
244
When comparing the 0.45ml/kg bwt dose repeated under fasting conditions in the same 246
month (June), the repeatability for AUCi was 0.83; whereas the repeatability of the serum
247
insulin concentration at the single significant time point of 60 minutes was 0.5. Tmaxi
248
repeatability was low at 0.19 but Cmaxi was 0.64.
249
250
Season 251
When comparing the fasted 0.45ml/kg bwt dose between December (Winter, northern 252
hemisphere) and June (Summer, northern hemisphere), there was a significant interaction 253
between season and group (NL and PL) when comparing both AUCi (P=0.04) and insulin
254
concentration at 60 minutes (P=0.03) but no significant interaction for Cmaxi and Tmaxi.
255
There was a significant difference (P=0.03) between the AUCi in winter and the summer in
256
PL but not NL (Table 1). Similarly, the serum insulin concentration at 60 minutes was 257
significantly (P=0.01) lower in winter (146, [95% CI 108, 184], iu/ml) compared to summer 258
(204, [95% CI 172, 236], iu/ml) in PL but not NL (winter 86 [95% CI 37, 136] iu/ml and 259
summer 71 [95% CI 30, 112] iu/ml). There was no significant difference for Cmaxi
260
(P=0.53) or Tmaxi (P =0.9) between winter and summer. (Table 1)
261
262
Fed vs Fasting 263
When comparing the insulin response of all 8 ponies combined when fasted and at pasture 264
during the summer following 0.45ml/kg bwt dose, there was no significant interaction 265
between group (NL and PL) and feeding and no significant differences between fasted and at 266
pasture for the outcomes variables (Table 1). 267
268
Further analysis of the AUCi was explored to attempt to reduce the frequency of the blood
270
sampling requirements. Using data from only 3 time points, namely T0, 60 and 90, a 271
modified insulin AUC (AUCiM) was calculated. There was a significant (p<0.001) difference
272
between AUCiM for all the 8 ponies combined following the 0.45ml/kg bwt dose (8526, [95%
273
CI 7060, 9991] μiu/ml/min) and both 0.15ml/kg bwt (4249, [95% CI 2784, 5715] 274
μiu/ml/min) and 0.3ml/kg dose (4481, [95% CI 3016, 5947] μiu/ml/min). However, there was 275
no significant difference between the 0.15ml/kg bwt dose and 0.3ml/kg bwt dose. This 276
relationship also held true for CmaxiM (data not shown).
277
278
A significant interaction was found between group (NL and PL) and dose for AUCiM
279
(P=0.04) and CmaxiM (P=0.05) but not TmaxiM (P=0.96). There was a significant difference
280
for AUCiM between NL and PL following 0.45ml/kg bwt (p=0.001) but not following
281
0.15ml/kg bwt or 0.3 ml/kg bwt dose (Table 1). A cut off value of ≥7500 µiu/ml/min AUCiM
282
distinguished between NL and PL ponies in the current data. The repeatability of the 283
modified AUCi was 0.63.
284
285
Glucose 286
Dose 287
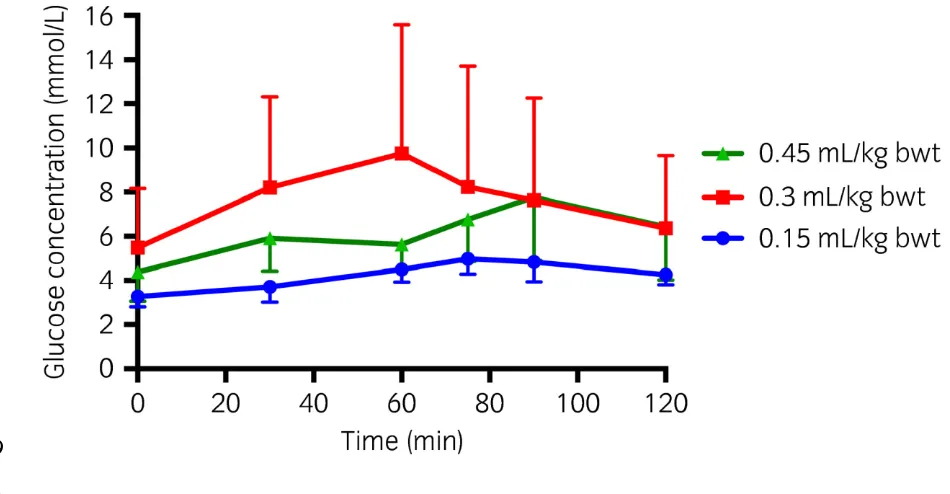
When the data from all 8 ponies was combined, the AUCg was significantly greater following
288
the 0.45ml/kg bwt (P= 0.049) and 0.3ml/kg bwt (P=0.005) doses compared to the 0.15ml/kg 289
bwt dose. Cmaxg was significantly greater following the 0.3ml/kg bwt (P=0.001) dose
290
compared to the 0.15ml/kg bwt dose and the 0.45ml/kg bwt (P=0.04). Tmax was significantly 291
(P=0.05) later following 0.45ml/kg bwt dose compared to 0.15ml/kg bwt dose.(Table 2). 292
There was no significant interaction between dose and group (NL and PL) for AUCg, Cmax
293
295
Group, season and pasture 296
When the data from all 8 ponies was combined, in summer AUCg (P=0.04) and Cmaxg
297
(P=0.02) were significantly greater whilst Tmax was significantly (p=0.004) shorter 298
compared to winter (Table 2). AUCg (P= 0.02) and Cmaxg (P=0.01) were significantly greater
299
when the ponies were fasted compared to when they remained at pasture. 300
301
Discussion 302
303
In this small study population, only a dose of 0.45ml/kg bwt of corn syrup allowed NL and 304
PL ponies to be reliably distinguished compared to lower doses. The lower 0.15ml/kg bwt 305
dose was unable to distinguish between the two populations which contrasts to two previous 306
studies [4,13], but is consistent with a third [7]. Only one single time point in our study, a 307
blood sample at 60-minutes post corn syrup administration allowed for the test to correctly 308
assign all the individual ponies to their respective groups (NL and PL); time points either side 309
of this failed to provide certainty. This is in agreement with previously published data, in 310
which a blood sample obtained 60 minutes after corn syrup administration provided the 311
strongest correlation with the result obtained using the intravenous glucose tolerance test [4]. 312
313
The poor repeatability of the serum insulin concentration at the 60-minute sampling point is 314
concerning. Individual animal variability has been similarly established in other studies 315
including healthy horses [15]. A previous study found within subject agreement for a single 316
sample to be moderate to fair, with the same animal having varying response at the same time 317
point. Thus, taking multiple samples and calculating area under the curve may help 320
counteract individual variation and provide more repeatable results. The modified AUCiM
321
reduced the number of sampling points to 3 and required only 90 minutes to complete. 322
However, the repeatability was reduced to 0.63, which is better than that of the single time 323
point of 0.5, but less repeatable than full AUCi of 0.83.
324
325
The significant effect of season on the insulin response in only the PL ponies undergoing 326
OST is novel. However, other metabolic hormones have been observed to vary with season 327
[16]. Bailey et al [17] found that basal serum insulin concentrations were increased in 328
summer but not winter in a group of PL ponies compared to a group of NL ponies. There was 329
no effect of season, on serum insulin concentration at T75 following the 0.15ml/kg bwt dose 330
during two seasons in horses considered insulin sensitive [8]. Contrastingly, Borer et al[18] 331
found an increased insulin response in autumn (October –November) only in PL ponies 332
undergoing an oral glucose test compared to Spring (May-June). An exaggerated insulin 333
response to the greater pasture non-structural carbohydrates during growing season in those 334
ponies who may be insulin dysregulated would be consistent with the suggested 335
pathophysiology of endocrinopathic laminitis [9]. This includes alterations such an 336
exaggerated intestinal incretin response to the ingested carbohydrate [9],lower hepatic insulin 337
clearance [19], worse peripheral tissue insulin resistance [20] or altered insulin-like growth 338
factor signalling in lamellar tissue [21,22]. Further repeated testing over a 12-month period 339
would provide better grounding for an understanding of the seasonal changes and the 340
relationship with pasture alterations. 341
342
This study provides further evidence that allowing ponies to remain at pasture does not 343
previous study using the lower dose 0.15ml/kg bwt found a significant effect, but that the 345
results still allowed for a comparable diagnostic outcome with correct identification of ID vs 346
insulin sensitive animals. [11]. 347
348
There was no relationship between previous laminitis and glucose response in these PL and 349
NL ponies. This is in contrast to previous studies [4] which found the glucose concentration 350
to be higher at all time points and AUCg greater in a group considered to have equine
351
metabolic syndrome (EMS) compared to controls. The EMS group in this prior study [4] all 352
had a history of forelimb lameness, consistent with laminitis and were classified as EMS on 353
body condition score, adiposity and intravenous tests of insulin resistance. A further study 354
[13] using a modified OST with a dose of 0.2ml/kg bwt also found glucose at 120-180 355
minutes to be significantly different between EMS and healthy animals. Though testing was 356
undertaken up to 120 minutes in this current study, no further blood samples were taken 357
beyond that point, therefore it is not possible to state whether a difference would have been 358
seen at 180 mins. However, a more recently published study [10] with larger numbers, found 359
no significant difference in glucose response between insulin dysregulated and normal 360
animals at time 0-75 minutes on 2 occasions. It is surprising that the dose relationship in this 361
study was not incremental in that 0.45ml/kgBW dose did not lead to a significantly higher 362
glucose response than the 0.3ml/kgBW dose. However, it should be acknowledged that using 363
0.3ml/kgBW, 2 ponies, both PL, had very large, over double, glucose responses compared to 364
other PL. So the results from these two individual animals are potentially responsible for 365
absence of a dose relationship. The results may also reflect the variable bioavailability of oral 366
glucose seen in other studies [9]. 367
This study used the radioimmunoassay (RIA) to measure insulin concentrations, whereas in 369
the UK a chemiluminescence immunoassay (CL) is widely used by commercial laboratories. 370
Previous studies have reported that the two techniques are inequivalent [23]. When two RIAs 371
were compared to the CL, all differed significantly with values from the CL being 372
significantly lower than those from the two RIAs [20]. When the CL was compared with the 373
now discontinued gold standard RIAj , there was a strong positive correlation between results
374
but with fixed and proportional bias[24]. Both of these studies [20][24] found the greatest 375
relative differences to be observed at lower concentrations. Thus, the cut off values suggested 376
in this paper may not be applicable for values obtained with different assays and different 377
populations of animals. Previous studies [6]have found differing insulin responses in ponies 378
verses horses and between breeds [25]. 379
380
No adverse effects were seen in any of the 4 occasions the highest dose was given and the 381
amount of oral sugar provided is still much lower than that administered in the oral glucose 382
test. Our analysis of the maltose and glucose content of the corn syrup (Karo Light Corn 383
Syrup)a found it to contain lower digestible sugars than previously thought [4]. The dose of
384
sugar given using the 0.45mls/kg bwt dose equates to 160.3mg/kg bwt. This is 6 times lower 385
than the dose recommended for the oral glucose test of 1000mg/kg bwt. Further work at the 386
0.45ml/kg bwt dose should be undertaken in larger numbers but in this limited population it 387
would appear safe and there may be room to use a higher dose still. 388
389
The OST is a promising dynamic test, employing the enteroinsular axis for identification of 390
PL ponies, whom show an excessive insulin response to oral carbohydrate. Previous reports 391
of poor sensitivity and repeatability may be improved by the adoption of the higher 392
sampling time points. Further studies with larger numbers of both ponies and horses of 394
differing breeds, during all four seasons and using the various insulin assays are needed to 395
Tables 397
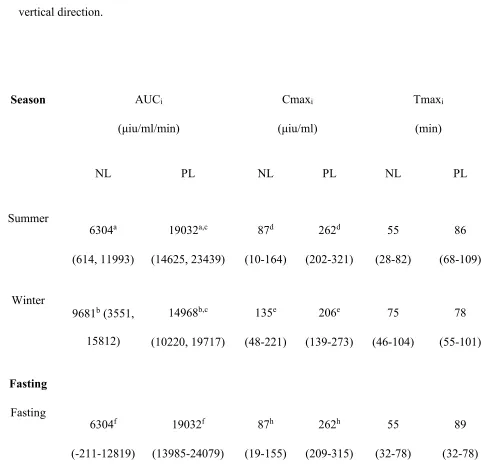
TABLE 1: Mean (95% confidence intervals) area under curve insulin (AUCi), maximal insulin concentration (Cmaxi), time to maximal insulin
398
concentration (Tmaxi), modified (T0-90) area under curve insulin (AUCiM), modified maximal insulin concentration (CmaxiM) and modified
399
time to maximal insulin concentration (TmaxiM) for the 3 doses of corn syrup (Karo Light Corn Syrup)a in normal (NL; n=3) and previously
400
laminitic ponies (PL; n=5). a–r Significant (P≤0.05) difference between values with the same letter superscript in both the horizontal and vertical
401 direction. 402 Dose (ml/kg bwt) AUCi (μiu/ml/min) Cmaxi (μiu/ml) Tmaxi (min) AUCiM (μiu/ml/min) CmaxiM (μiu/ml) TmaxiM (min)
NL PL NL PL NL PL NL PL NL PL NL PL
0.15 5409a
(2282, 8535) 5797d (3375, 8219) 72f (21-124) 80g (40-119) 80 (52-108) 72 (51-94) 3948 (2229-5669) 4430 (3097-5762) 62 (11-113) 61 (10-112) 70 (50-90) 72 (56-88)
0.3 4653b
0.45 9681a,b,c
(6554,
12808)
14968c,d,e
(12546,
17390)
135f
(83-186)
206g
(166-246)
75
(47-103)
78
(56-100)
5722q
(4001-7442)
10208q
(8876-11541)
98r
(58-137)
206r
(167-246)
80
(60-100)
78
(62-94)
404
TABLE 2: Mean (95% confidence intervals) area under curve insulin (AUCi), maximal
405
insulin concentration (Cmaxi), time to maximal insulin concentration (Tmaxi) for season and
406
fasting following 0.45ml/kg bwt corn syrup (Karo Light Corn Syrup)a. a–i Significant
407
(P≤0.05) difference between values with the same letter superscript in both the horizontal and 408
vertical direction. 409
410
411
Season AUCi
(μiu/ml/min)
Cmaxi
(μiu/ml)
Tmaxi
(min)
NL PL NL PL NL PL
Summer 6304a (614, 11993) 19032a,c (14625, 23439) 87d (10-164) 262d (202-321) 55 (28-82) 86 (68-109) Winter
9681b (3551,
Pasture
7639g
(919-14359)
16397g
(11191-21602)
107i
(24-190)
245i
(181-309)
40
(12-68)
75
(53-106)
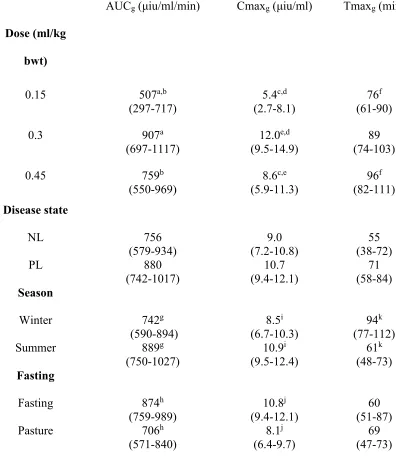
TABLE 3: Mean (95% confidence intervals) area under curve glucose (AUCg), maximal
413
glucose concentration (Cmaxg) and time to maximal glucose concentration (Tmaxg) for the 3
414
doses of corn syrup (Karo Light Corn Syrup)a in normal (NL; n=3) and previously laminitic
415
ponies (PL; n=5). Effect of season and fasting on these variables following 0.45ml/kg bwt 416
dose. a–k Significant (P≤0.05) difference between values with the same letter superscript in
417
both the horizontal and vertical direction. 418
AUCg (μiu/ml/min) Cmaxg (μiu/ml) Tmaxg (min)
Dose (ml/kg
bwt)
0.15 507a,b
(297-717)
5.4c,d
(2.7-8.1)
76f
(61-90)
0.3 907a
(697-1117) 12.0
e,d
(9.5-14.9) (74-103) 89
0.45 759b
(550-969) 8.6c,e (5.9-11.3) 96f (82-111) Disease state
NL 756
(579-934)
9.0 (7.2-10.8)
55 (38-72)
PL 880
(742-1017) 10.7 (9.4-12.1) 71 (58-84) Season
Winter 742g
(590-894)
8.5i
(6.7-10.3)
94k
(77-112)
Summer 889g
(750-1027) 10.9i (9.5-12.4) 61k (48-73) Fasting
Fasting 874h
(759-989)
10.8j
(9.4-12.1)
60 (51-87) Pasture 706h
(571-840) 8.1
j
(6.4-9.7) (47-73) 69 419
Figure Legends 421
422
Figure 1: Estimated marginal mean (1.96 s.e.) serum insulin concentration at single time 423
points in response to 3 different doses of corn syrup (Karo Light Corn Syrup)a. (n=8)
424
*Values that are significantly different (P<0.05) from the equivalent values from a different 425
dose. 426
427
428
Figure 2: Estimated marginal mean (1.96 s.e.) insulin concentration at single time points for 430
NL (n=3) and PL (n=5) ponies when given a dose of 0.45ml/kg bwt corn syrup (Karo Light 431
Corn Syrup). *Values that are significantly different (P<0.05) between groups (NL and PL). 432
433
Figure 3. Estimated marginal mean (1.96 s.e.) serum glucose concentration at single time 435
points in response to 3 different doses of corn syrup (Karo Light Corn Syrup)a. (n=8)
436
*Values that are significantly different (P<0.05) from the equivalent values from a different 437
dose. 438
439
440
Manufacturers’ addresses 442
a
ACH Food Companies Inc, Cordova, Tennessee, USA. 443
b Becton Dickinson, Sandy, Utah, USA.
444
c Dechra Veterinary Products, Shrewsbury, Shropshire, UK.
445
dJasco Ltd., Essex, UK
446
e Phenomenex, Torrance, California, USA
447
fMP Biomedical, Ilkirch, France.
448
gCayman chemical company, Michigan, USA
449
hIBM UK, Portsmouth, Hampshire, UK.
450
iGraphpad Software, La Jolla, California, USA.
451
jCoat-A-Count, Siemens, Camberley, Surrey, UK.
452
453
454
References 456
457
1. Bertin, F.R. and de Laat, M.A. (2017) The diagnosis of equine insulin dysregulation. 458
Equine Veterinary Journal. 459
2. Asplin, K.E., Sillence, M.N., Pollitt, C.C. and McGowan, C.M. (2007) Induction of 460
laminitis by prolonged hyperinsulinaemia in clinically normal ponies. Vet J174, 530– 461
535. 462
3. Frank, N. and Tadros, E.M. (2014) Insulin dysregulation. Equine Veterinary Journal 463
46, 103–112. 464
4. Schuver, A., Frank, N., Chameroy, K.A. and Elliott, S.B. (2014) Assessment of Insulin 465
and Glucose Dynamics by Using an Oral Sugar Test in Horses. Journal of Equine 466
Veterinary Science34, 465–470. 467
5. Lindåse, S., Nostell, K., Söder, J. and Bröjer, J. (2017) Relationship Between β‐cell 468
Response and Insulin Sensitivity in Horses based on the Oral Sugar Test and the 469
Euglycemic Hyperinsulinemic Clamp. Journal of Veterinary Internal Medicine46, 470
103. 471
6. Smith, S., Harris, P.A. and Menzies-Gow, N.J. (2015) Comparison of the in‐feed 472
glucose test and the oral sugar test. Equine Veterinary Journal n/a–n/a. 473
7. Dunbar, L.K., Mielnicki, K.A., Dembek, K.A., Toribio, R.E. and Burns, T.A. (2016) 474
Evaluation of Four Diagnostic Tests for Insulin Dysregulation in Adult Light‐Breed 475
of Equine Insulin Regulation in Horses of Varied Body Condition Score. Journal of 478
Equine Veterinary Science34, 742–748. 479
9. de Laat, M.A., McGree, J.M. and Sillence, M.N. (2016) Equine hyperinsulinemia: 480
investigation of the enteroinsular axis during insulin dysregulation. American Journal 481
of Physiology - Endocrinology and Metabolism310, E61–E72. 482
10. Frank, N. and Walsh, D.M. (2017) Repeatability of Oral Sugar Test Results, 483
Glucagon-Like Peptide-1 Measurements, and Serum High-Molecular-Weight 484
Adiponectin Concentrations in Horses. Journal of Veterinary Internal Medicine34, 485
465. 486
11. Knowles, E.J., Harris, P.A., Elliott, J. and Menzies-Gow, N.J. (2017) Use of the oral 487
sugar test in ponies when performed with or without prior fasting. Equine Veterinary 488
Journal49, 519–524. 489
12. Restifo, M.M., Frank, N., Hermida, P. and Sanchez-Londoño, A. (2016) Effects of 490
withholding feed on thyrotropin-releasing hormone stimulation test results and effects 491
of combined testing on oral sugar test and thyrotropin-releasing hormone stimulation 492
test results in horses. http://dx.doi.org/10.2460/ajvr.77.7.73877, 738–748. 493
13. Lindåse, S., Nostell, K., Askerfelt, I. and Bröjer, J. (2015) A modified oral sugar test 494
for evaluation of insulin and glucose dynamics in horses. Acta Veterinaria 495
Scandinavica 2015 57:157, O4. 496
14. Bartlett, J.W. and Frost, C. (2008) Reliability, repeatability and reproducibility: 497
analysis of measurement errors in continuous variables. Ultrasound Obstet Gynecol 498
15. de Laat, M.A. and Sillence, M.N. (2017) The repeatability of an oral glucose test in 500
ponies. Equine Veterinary Journal49, 238–243. 501
16. Place, N.J., McGowan, C.M., Lamb, S.V., Schanbacher, B.J., McGowan, T. and 502
Walsh, D.M. (2010) Seasonal variation in serum concentrations of selected metabolic 503
hormones in horses. J Vet Intern Med24, 650–654. 504
17. Bailey, S.R., Habershon-Butcher, J.L., Ransom, K.J., Elliott, J. and Menzies-Gow, N.J. 505
(2008) Hypertension and insulin resistance in a mixed-breed population of ponies 506
predisposed to laminitis. http://dx.doi.org/10.2460/ajvr.69.1.12269, 122–129. 507
18. Borer, K.E., Bailey, S.R., Menzies-Gow, N.J., Harris, P.A. and Elliott, J. (2012) Effect 508
of feeding glucose, fructose, and inulin on blood glucose and insulin concentrations in 509
normal ponies and those predisposed to laminitis. Journal of Animal Science90, 3003– 510
3011. 511
19. TÓTH, F., Frank, N., Martin Jimenez, T., Elliott, S.B., Geor, R.J. and Boston, R.C. 512
(2010) Measurement of C‐peptide concentrations and responses to somatostatin, 513
glucose infusion, and insulin resistance in horses. Equine Veterinary Journal42, 149– 514
155. 515
20. Suagee, J.K., Corl, B.A., Hulver, M.W., McCutcheon, L.J. and Geor, R.J. (2011) 516
Effects of hyperinsulinemia on glucose and lipid transporter expression in insulin-517
sensitive horses. Domestic Animal Endocrinology40, 173–181. 518
21. Lane, H.E., Burns, T.A., Hegedus, O.C., Watts, M.R., Weber, P.S., Woltman, K.A., 519
Geor, R.J., McCutcheon, L.J., Eades, S.C., Mathes, L.E. and BELKNAP, J.K. (2017) 520
22. Kullmann, A., Weber, P.S., Bishop, J.B., Roux, T.M., Norby, B., Burns, T.A., 523
McCutcheon, L.J., Belknap, J.K. and Geor, R.J. (2016) Equine insulin receptor and 524
insulin‐like growth factor‐1 receptor expression in digital lamellar tissue and insulin 525
target tissues. Equine Veterinary Journal48, 626–632. 526
23. Banse, H.E., McCann, J., Yang, F., Wagg, C. and McFarlane, D. (2014) Comparison 527
of two methods for measurement of equine insulin. Journal of Veterinary Diagnostic 528
Investigation26, 527–530. 529
24. Carslake, H.B., Pinchbeck, G.L. and McGowan, C.M. (2017) Evaluation of a 530
Chemiluminescent Immunoassay for Measurement of Equine Insulin. Journal of 531
Veterinary Internal Medicine31, 568–574. 532
25. Bamford, N.J., Potter, S.J., Harris, P.A. and Bailey, S.R. (2014) Breed differences in 533
insulin sensitivity and insulinemic responses to oral glucose in horses and ponies of 534
moderate body condition score. Domestic Animal Endocrinology47, 101–107. 535
536
537
Supplementary Information Items 538
1. Table – Signalment, laminitis history and weight from the pony subjects. 539
2. Table- Corn Syrup analysis 540