Article
Development and Implementation of the Application
APPMAR 1.0. A Toolbox for Management of
Meteorological and Marine Data on Limited
Information Regions
German Rivillas-Ospina 1*, Marianella Bolívar 2, Mauro Maza Chamorro 3, Gabriel Ruiz 4, Diego Casas 1 and Roberto Guerrero 2
1 Departamento de Ingeniería Civil y Ambiental. Universidad del Norte, Barranquilla, Colombia. PIANC-Colombia, CEMAN Network; [email protected]; [email protected].
2 Facultad de Ingenierías, Departamento de Ingeniería Civil y Ambiental, Universidad de la Costa; [email protected]; [email protected].
3 Grupo de Sistemas Ambientales e Hidráulicos (GISAH). Laboratorio de Energía, Ambiente y Desarrollo Sostenible (LEAD), Universidad Tecnológica de Bolívar, Bolívar, Colombia, CEMAN Network.; [email protected].
4 Departamento de Recursos del Mar, Centro de Investigación y Estudios Avanzados – Politécnico Nacional, Carretera Puerto Progreso Km, Mérida, Yucatán, México; [email protected].
Correspondence: [email protected]; Tel.: +57-304-547-1682 (C.O.)
Abstract: This work presents an application called APPMAR 1.0 based on Python ® environment, built to perform the downloading, treatment and analysis of meteorological and marine information. This application is composed of two main modules: the first module allows the downloading of information from the database (NOAA - WW3); the second module uses the principles of statistical mathematics for the treatment of waves and wind. The importance of this simple application is based on the free and agile access to meteorological and marine information for a coastal project. The determination of representative conditions of sea states ultimately will govern the process of design of coastal and oceanic infrastructure. The analysis of historical time series of local waves and winds allows the evaluation of average regimes or operational design, the ultimate limit states or extreme design, and the storms or design by persistence. In spite that the former analysis is a common task for coastal engineers, the codes generated are seldom shared for public use. In summary, for operational purposes is useful to have a freeware that can assist in the data processing for decision making and forcing of the mathematical models that are part of the common practice of coastal, oceanic and offshore engineering. This application has been tested in the Caribbean area of Colombia where meteorological and marine information are scarce.
Keywords: Colombia, Colombian Caribbean, marine climate, Mallorquín Lagoon, Puerto Colombia, Wave Watch III, wave, wind.
1. Introduction
Projects and studies in coastal and oceanic engineering and oceanography often require access to meteorological and marine information in specific locations. Waves, winds, currents and sea levels are essential elements for the calibration and validation of spectral and phase averaged mathematical models. However, nowadays there are serious limitations in regions like the Pacific and the Caribbean in Colombia, South America, for the gathering of these physical parameters.
According to [1] the use of wave and wind information in Colombia has been focused in the last two decades in the development of wave evolution models covering the space domain from deep to intermediate water, and in the analysis of wave energy potential. In the Colombian Caribbean there
are several limitations of observational wind and wave information in the temporal extension of the data bases, which is reflected in the statistical significance and reliability of the analysis, especially in the long term. There are also limitations in time interval, spatial resolution and spectral characteristics of the available data.
In this context of limited information, access researchers and consultants focus in the analysis of international wind and waves databases. The most used are a) NCEP/NCAR; b) NARR; NOAA-WW3; y c) CCMP DE NASA/GSFC/NOAA. These data are used as boundary conditions for third generation wave numerical models, solving the energy balance equation, such as a) Wave Modelling (WAM); b) Simulating Waves Nearshore Model (SWAN); and c) WAVEWATCH III (WW3).
[2] developed a study focused in the understanding of the maritime climate variability in scarce information conditions. A calibration and validation of the global reanalysis was performed, together with a description of the maritime climate on Latin America and the Caribbean, covering different scales of time, including scalar and directional wave parameters. The results indicate that the wave climate has significant latitudinal variation in both hemispheres, with larger energetic generation potential towards the south of the continent and significant seasonal variations in the northern latitudes.
In the domain of the Caribbean Sea, historically there has been a need of wave and wind information with high quality standards, the evidence of this is represented in the number of studies dedicated to wave propagation considering different forcing agents and models for mean and extreme climate, and also the numerous evaluations of wave energy potential [1]. For most of the developed countries, the wind and wave information are readily available and open in access, and quality monitored by the agencies in charge. This approach stimulates the optimization of the processes and procedures in coastal and oceanic engineering, oceanography and related activities in marine and coastal environments.
In this work is presented an application called APPMAR 1.0 © that allows the user to access wind and wave databases and to build multidimensional time series that can be statistically representative for implementation on studies of coastal, oceanic and offshore engineering. The application is based on the optimization of the tasks of extraction, analysis and processing of data for the creation of boundary conditions for coastal and offshore models. These operations require time and effort especially for professionals that are in the formation stages in the subjects of meteorology and oceanography. This version of the application uses databases of the National Oceanic and Atmospheric Administration (NOAA), being possible to extent functionality to other databases in the near future. The application put to use the statistical mathematics for the determination of mean regime of wind and waves, presenting results in the format of wind and wave roses, conjoint probability analysis, and the characterization of the events of mean magnitude. Additionally, it is possible to perform long terms analysis evaluating sea states, the most energetic wind conditions in a particular location, the direction of propagation of the wave field and the associated peak period. Also, it is possible to determine the meantime in that an event is exceeded relating the event with its return period. The application is easy to download and to use, and it will allow to numerous members of the fields of science and engineering to access, process and analyze large volumes of meteorological and oceanographic information, keeping quality control and statistical significance. The methodology of this work can be applied in absence of long-term wave data records, stablishing direct relationships between the atmospheric states and the most common wave spectral conditions in any chosen study area.
2. General considerations
Table 1 presents a compilation of databases commonly used for the characterization of meteorological and oceanic conditions in regions with scarce observational information (e.g.: the Colombian Caribbean). Even though this information is available there is not an open and free application that can allow the users in a simple manner the demanding task of processing the bulk of information provided for the international databases, which have multiple formats of storage. Attending to this need it was developed an application in Python language for the compilation and treatment of this information based on statistical mathematics.
3. Application description
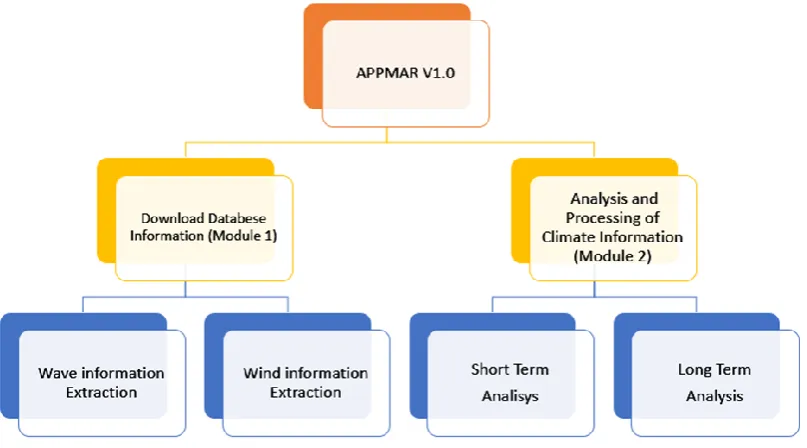
The application consists of two main modules, following the scheme presented in Figure 1. To ease the use of AppMar 1.0 © , the application utilizes a graphic user interface that allows the interaction with the final user. Figure 2 shows the opening window of AppMar 1.0 © .
APPMAR 1.0 require to the correct development on hardware Ubuntu 18.04 LTS, and the programming language is Python 3.7. The application has 93 KB and can be download from the Sustainable Development Institute (IDS, in Spanish) of Universidad del Norte web site.
3.1. Computer Code Availability
Name of code, developer and contact address, telephone number and e-mail, year first available, hardware required, software required, program language, program size, and details on how to access the source code.
Name code: APPMAR 1.0
Developer: German Rivillas-Ospina, Marianella Bolívar, Mauro Maza Chamorro, Gabriel Ruiz, Diego Casas, Roberto Guerrero.
Contact address: Km 5 Via Puerto Colombia, K Building, 9-5K office
Telephone number: +573509509, ext. 3710. +573045471682
Email: [email protected] (G. Rivillas), Universidad del Norte
Year first available: 2018
Operating System: Ubuntu 18.04 LTS
Software required: Anaconda Cloud
Programming language: Python 3.7
Program size: 93 KB
Accessibility: download from: https://www.uninorte.edu.co/web/ids/publicaciones
Based on the characteristics of Python, APPMAR 1.0 utilise the following libraries: NumPy, Matplotlib, and Pandas. The main code has the capability to call the modules 1 or 2 depending of the task that the user requires to perform. Module 1 allows the downloading of information from the databases, extracting wind and wave data (Figures 1 and 2). Module 2 process the former information based on statistical analysis, calculating the mean regime and the long-term analysis of wind and waves (Figures 1 and 2).
Figure 1. Structure of the application APPMAR V 1.0.
Figure 2. Menu window of the application APPMAR V1.0.
When the user presses the analysis and processing climate information button, the application open a submenu that contain a statistical analysis divided in Short-term and Long-term analysis (Figure 3).
Short-term analysis comprise exceedance probability of Significant Wave Height (Hs) and Peak Period (Tp), Joint Probability of Hs and Wave Roses (Figure 4).
Figure 4. Short-term analysis menu.
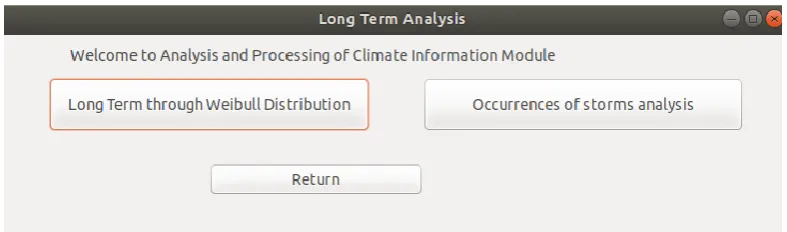
Long-term analysis is composed by elements that estimate future scenarios associated to a return period concept, and contain the analysis based on Weibull statistical distribution and Storm analysis (Figure 5).
Figure 5. Long-term analysis menu.
3.2. Module 1. Downloading information from international free access databases
3.2.1. Sources of information
The study of meteorological and marine phenomena implies the management of detailed information of wind and wave parameters. There are several databases for these kinds of data, and they are grouped in different categories:
3.2.1.1. Numerical modelling
numerical models [3,4]. The problems that arise with this source of information is the need to calibrate the models and the large computational cost that they demand. This work deals with this kind of information, considering that for most of the oceans, there is an unsatisfied need of in situ, high quality, accessible data.
3.2.1.2. Available information
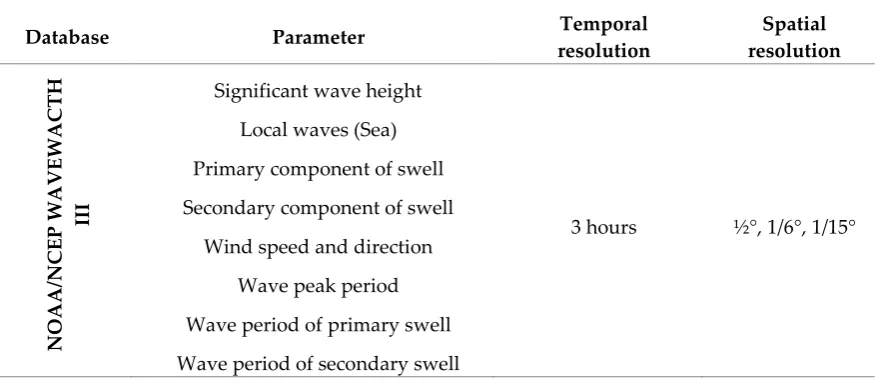
In Table 1 is presented a list of different databases and the information that can be extracted from them to be used as boundary condition for coastal and offshore numerical models.
Once the information is downloaded from the databases, it is possible to build waves and wind time series. These time series will receive a specific treatment depending of the specifications of the project that is going to be developed. Nonetheless, given the aleatory nature of the marine and meteorological conditions, which depend on the physical forcing affecting their variability, it is necessary using statistical mathematics to infer the behavior of waves and wind along time for stationary and non-stationary conditions.
At this point in time the development of the application AppMar 1.0 © is focused in the downloading of information from the database NOAA/NCEP WAVEWACTH III. The database has a spatial resolution of ½ °, 1/6°, 1/15° and a time interval of 3 hours, and provides the parameters described in Table 1. The information is in. grb and. grb2 files with matrix format. The application performs a swept on the matrix, stablishing an association between the values read and the parameter that they represent. In this way a new array is build; this array is saved in a text file, with information of wind and waves, considering the maximum and mean values, with a spatial resolution of ½ º and time interval of 3 hours. The information processed by AppMar 1.0 © in Module 1 is used for statistics calculation and organized in wave and wind time series.
Table 1. International databases with available information.
Database Parameter Temporal
resolution Spatial resolution NO A A /NCE P WA V E WA C T H III
Significant wave height
Local waves (Sea)
Primary component of swell
Secondary component of swell
Wind speed and direction
Wave peak period
Wave period of primary swell
Wave period of secondary swell
3 hours ½ °, 1/6°, 1/15°
3.3. Module 2 – Treatment and analysis of marine and meteorological information (marine climate)
The characterization of wave and wind is conceived as a description in the long term, including the extreme conditions analysis, or the description in the short term, based in the study of the irregular waves and the seasonal variations of wind, known as mean regime. In the short-term description, usually is supposed that the process is stationary, random and Gaussian, while the long-term analysis reflects the climate characteristics along a multiannual period.
the development of AppMar 1.0 © (Analysis and processing of meteorological and marine information).
AppMar 1.0 © starts with the hypothesis that statistics analysis is a mechanism that allow the user to build different probability functions, the attraction domain indicating the application range for the function, and the probability plotting papers that can be used for the representation of the linearized probability function. In the analysis of climate, adopted by AppMar 1.0 © , is defined the concept of storm, the building of the wave and wind roses, and the probability distribution functions based on methodologies found in the state of the art available. For the long-term analysis, the application stablishes the relationship between the occurrence probability of an event with its return period, the definition of the series of the historical maximum of the information considered, and the development of the wind and wave fields for the specific study area.
3.3.1. Statistical analysis of meteorological and marine information
3.3.1.1. Wave characterization
3.3.1.1.1. Definition of storm
Considering extreme wave and wind conditions, AppMar 1.0 © defines a storm as a group of sea states in which the significant wave height exceeds a threshold and this significant wave height will not be below this threshold for a continuous period of time greater than 12 hours.
The critical height (threshold) is defined as the 97 and 99 percentiles. If the wave heights, and the wind speeds exceed the threshold and continue with that behavior along a continuous period equal to or longer than 12 hours, the phenomena are considered as a storm.
The total energy in every storm is normalized with a storm equivalent to the threshold value sustained for an interval of 24 hours. In the literature is suggested to adopt a value of 1.5 times the annual mean of significant wave height.
3.3.1.1.2. Roses
A conventional form of representation of the wave historical records are graphs with a vertical axis and a concentric scale that allows to represent the intensity and the frequency of occurrence of wave height or wind speed considering the associated directions. In the wind or wave rose generated by AppMar 1.0 © , the width of the classes indicates the magnitude of the phenomena, while the length indicates the frequency of occurrence. The application builds internally the roses through the classification of values according to the direction, and the evaluation of the frequency of each class. Finally, a drawing is created with the respective angular sectors, indicating the intensity in the concentric scale.
3.3.1.1.3. Extreme regime
In ocean engineering, the extreme regime analysis is used for the selection and description of phenomena of low probability of occurrence. For these tasks, AppMar 1.0 © uses the concept of
“return period of an extreme event” defined as the average time in years that occurs between two
storms which intensity exceeds a certain value. It is convenient to clarify that in the analysis performed by AppMar 1.0 © the storm duration is not involved, for that reason the results and the applications are related with fragile or ultimate limit state.
to endure by a specific marine infrastructure work as a function of risk and useful lifetime. The extreme climate derived from the application is also used for the determination of the maximum actions to endure during the last phases of execution of a marine, coastal or oceanic work, which are lesser than the actions during the service period of the work, AppMar 1.0 © uses the Weibull probability of exceedance function because that is a model of three parameters, and because it has more degrees of freedom shows better results than the Gumbel function.
3.3.1.1.4. Occurrence of storms analysis
AppMar 1.0 © considers the storms analysis because this concept is very useful in scenarios analysis when the failure modes are of the ductile kind or relative to the limit of service kind. The relative to the limit of service kind is when the damage occurs due to the persistence of the phenomena. The characterization of storms is performed in a similar fashion to the zero-crossing analysis [5], being evaluated the energy accumulated for each one of the storms that overcome a defined threshold.
3.3.1.1.5. Energetic analysis
The wave energy is essential in the understanding of diverse phenomena, including the processes of energy generation by winds and the transformation of the waves in their propagation from deep to shallow waters.
For the energetic analysis AppMar 1.0 © selects the data in a similar fashion that for the wave height analysis: establishing a threshold. The value of this threshold was calculated based on the normalized energy. The normalized energy is determined in the application, deducting initially the specific energy for every value of wave height. AppMar 1.0 © then estimates the value of energy according to the threshold methodology for the wave height and wind parameters. Finally, with the two values calculated is obtained the normalized energy.
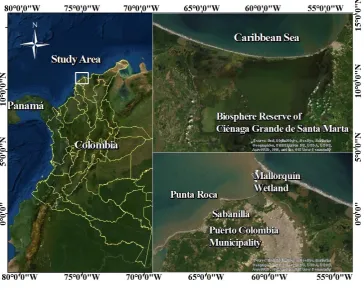
4. Illustrative case study: Study area, Mallorquín Lagoon
4.1. Study area
Figure 6. Study area.
For the definition of the forcing conditions that rules the system, were used the data of WAVEWATCH III (WWIII) from the National Weather Service (Environmental Modelling Centre), with 0.25° spatial resolution, and 3 hours of time Interval. In this case 60 individual files with waves and wind information that contain the behavior of the study area were analyzed. The information was downloaded from the NOAA homepage using the Module 1 as described previously. This database with 38 years of reanalysis was considered (in the example case of this work 1979-2017), including groups of wave and wind information for each point of the domain grid.
4.2. Materials and Methods
4.2.1. Characteristics of the calculation domain
Figure 7. Calculation domain.
A folder was generated with information of each cell, including: date (year month, day, hour): wind (speed in meter per second, averaged on 10 min at 10 meters above sea level; direction of incidence; and waves (significant wave height in meters, direction, and spectral peak period in seconds).
5. Results and discussion
Figure 8. Mean and maximum monthly number of storms
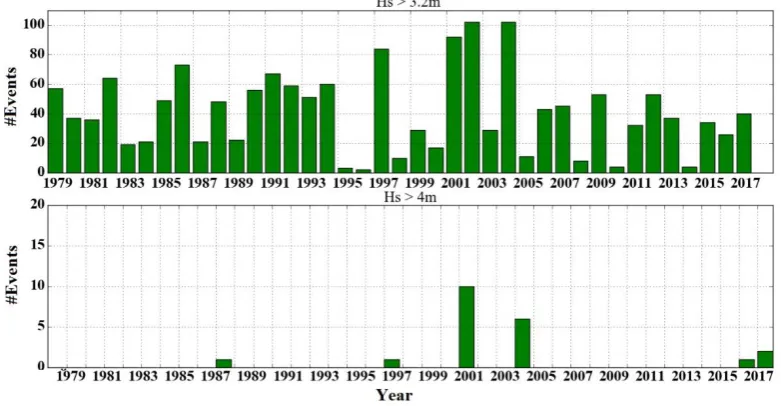
In coastal engineering design is crucial the analysis of annual events, because it is necessary to know the maximum and minimum values of the marine parameters in order to guarantee a good response of coastal structures during storms. Therefore, it was calculated the number of events with annual occurrence for the ranges 3.2 to 4 meters in significant wave height (Figure 9).
Figure 9. Mean and Maximum number of storms
.
According to AppMar 1.0 © the wave heights between 2 and 3.2 m during the years 2002 and 2004 were the most active, with the occurrence of 100 events, while the year 1996 was the calmest
year with just 3 storms per year on average. As the ranges increase the number of occurrences decreases in number, but the wave trains and the wind gusts increase in magnitude, like in the years
2016 and 2017.
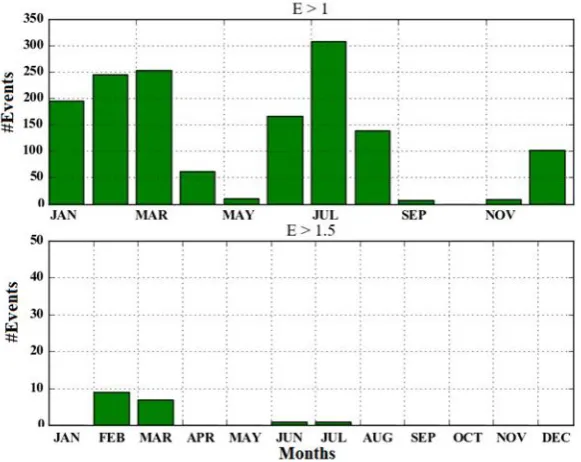
The calculation of normalized energy in AppMar 1.0 © as it is shown in Figure 10 presents similarities with the number of occurrences of wave height in a monthly scale. The difference lays in
calculation and plotting is to acquire the knowledge in understanding the energy generated by every storm.
In the upper panel of Figure 10 is shown July as the month with the highest energy content, with values of normalized energy larger than 1. This month is part of the Caribbean hurricane season, a period marked by tropical storms, hurricanes and easterly waves passage. In view of energetic
content, it is also important to consider the first quarter of the year where the influence of the cold fronts and the trade winds generates a significant marine dynamic.
Figure 10.Storms normalized by month.
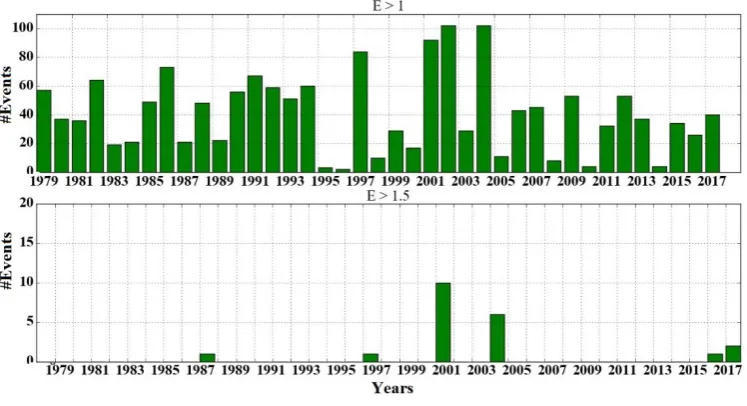
Figure 11.Annual Mean and maximum number of storms with normalized.
Figure 11 shows that the years with the most energetic events in the record considering
recurrence are 2001, 2002 and 2004.
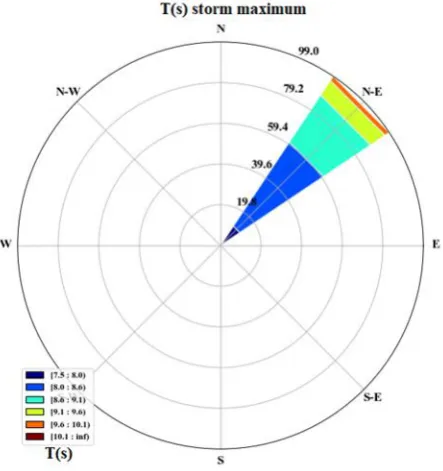
Figure 12 Significant wave height Rose calculated energetically by storm.
It is shown in Figure 12 the wave height rose calculated energetically by storm with the
application AppMar 1.0 © . Important events with duration larger than one day are observed, thought
their percentage of occurrence is low (around 1%), traveling from the North East towards the coast.
Events with higher recurrence, but with shorter duration are more common in the study area. Wave
fronts with high energy, and persistence of 21 hours, marked in orange colour, arrive with an
with short duration but with high incidence in the coastal zone present durations of 19.2 hours with
a dominant wind and wave direction from the Northeast.
The wave period rose shows the periods related to the storm events in record (Figure 13). It is
observed that the periods of larger incidence are the ones that determine the waves arriving to the
coastal zone. The maximum peak periods come from the Northeast direction, and they are related to
60% of occurrence in a range of 8 to 9 seconds, and larger periods from 9 to 11 seconds.
AppMar 1.0 © make use of the least square technique for adjusting to the Weibull distribution
the maximum annual values for climate seasons (considering the North hemisphere seasons: winter,
spring, summer and fall) when calculating the significant wave height related to the return periods.
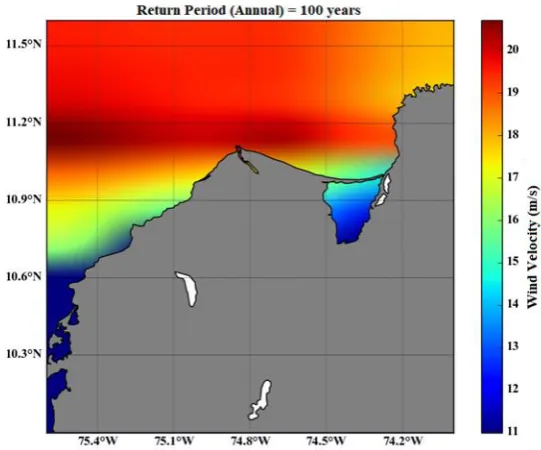
Figure 14 shows the wave height map for the 100 years return period, with events of great intensity
located to the East of the Magdalena River mouth and Figure 15 shows the wind speed map for the
100 years return period. In this sector can be observed significant wave heights close to 5 m and 20
m/s winds (Figure 15), between 10.9° N and 11.2° N. Towards the North and Easts the contours show
wave heights of 4 m and wind speeds of 15 m/s. The wave height is reduced toward the coast, with
values of 3.5 m and 11 m/s close to Puerto Colombia and the Biosphere Reserve of Ciénaga Grande
de Santa Marta.
Figure 14. Significant wave height maps for 100 years return period.
Figure 15. Wind speed maps for 100 years return period.
The analyses presented in this work show how the application APPMAR 1.0 can provide representative and relevant information of waves and winds in any area, providing a general view of the energetic distribution of the sea states, with temporal and spatial richness.
Considering the study area in particular, from the wave maps is possible to extract information that shows that nearby the Magdalena River mouth there are important values of significant wave height, decaying the magnitude of the parameter towards the South and North of the river mouth.
and the trade winds. The level of energy decays in the Northern hemisphere spring, due to the reduction in magnitude of the winds. In the summer under the influence of the cyclonic events that cross the Caribbean the level of energy rises again.
The return period of 100 years was selected for the analysis of wave magnitude and normalized energy. It is characteristic that the larger the intensity of the phenomena the shorter the duration of the event.
The behaviour of the mean regime is different, given that the duration of the storms is longer, and the events are more recurring. The study area analysed shows high values for maximum duration, being this an indication of high vulnerability and a possible trend to coastal erosion, especially nearby Mallorquín Lagoon and Puerto Colombia.
6. Conclusions
Using computational tools applied to marine sciences it was developed an application for treatment of marine and meteorological information called AppMar 1.0 © , with the objective of performing mean and extremal regimes analysis. The methodology applied considers storm events, effects of hurricanes and the condensed energy in these processes, for the determination of the sea states and the wind fields. The foundation of the application is based in the technique of statistical analysis for the determination of intensity and duration of events in different time scales. In engineering design these kinds of tools are very relevant, because with them it is possible to identify risk elements for coastal infrastructure and activities that take place in fluvial and marine areas. However, it is possible to extend this analysis to different scenarios such as risk analysis in tourism, real estate investment, territorial planning, and environmental impact studies.
The main contribution and novelty of the application is the possibility to perform statistical analysis, using standardized methodologies and free code, with easy access and user oriented. This vision of openness and freedom in the access to information and its analysis can stimulate the implementation of good practices in public and private coastal and offshore projects. This version of the application can process marine information collected from the NOAA database, and soon from other sources, in a fast, efficient, reproducible and trustworthy fashion.
Considering methodologies, the benefit of the application resides in the energetic analysis, because is more common the study of the maritime climate and the scenarios analyses using forcing from spectral averaged or phase resolving models.
7. List of Acronyms
List of Acronyms
NCEP National Centers for Environmental Prediction
NCAR National Center for Atmospheric Research
NARR North American Regional Reanalysis
NOAA National Oceanic and Atmospheric Administration
CCMP Cross-Calibrated Multi-Platform
WW3 Wave Watch III Model
GSFC Goddard Space Flight Center
WAM Wave Modelling
SWAN Wave Modelling
ERS-1, ERS-2 European Remote Sensing Satellite
GeoSAT Geodetic Satellite
Envisat Environmental Satellite
DIMAR Colombian General Maritime Direction
CMS-Wave Coastal Wave Modelling with SMS
CMS-Flow Hydrodynamic Coastal Flow Modelling with SMS
CFRS Climate Forecast System Reanalysis
NDBC National Data Buoy Centre
8. List of symbols
List de Symbols
a
n, b
n Constant dependent of n.H(x),
F(x) Non-degenerate distributions
g(x), h(y) Functions
parameter vector
parametric family of functions of accumulated distributionX:
Location parameter
Scale parameter.
Form parameter.
Threshold parameter.E
N Normalized energyE
S Specific energy for a value of wave height of 2.7 m in 24 hoursAcknowledgments: The authors thank COLCIENCIAS for the funding provided through a grant from the call 748-2016. The authors also thank the Federal Ministry for Economic Cooperation and Development from Germany, the German Academic Exchange Service (DAAD), the Centre of Excellence for the Cooperation to Development, the Centre of Excellence for Sustainable Water Management, Sustainable Water Management in Developing Countries (EXCEED SWINDOM NETWORK) and Braunschweig Technical University, and finally to COASTAL MANAGEMENT NETWORK (CEMAN). Sustainable Development Institute (IDS, in Spanish).
References
1. Maza Chamorro, M.; Del Rio Colón, R.; Campo Rojas, E. Uso de información de viento y oleaje en el Caribe. In Manual de Referencia en Mejores Prácticas de Gestión de Datos Oceánicos, 1st ed.; CTN Diocean, Eds.; DIMAR: Bogotá, D.C., Colombia, 2018; 3, pp. 32-36. doi.org/10.26640/25392212.3.2018. ISSN:2539-2212.
2. Reguero, B.G., Méndez, F.J., Lozado, I.J. Variability of multivariate wave climate in Latin America and the Caribbean. Global and Planetary Change 2013, 100, 70–84. https://doi.org/10.1016/j.gloplacha.2012.09.005.
4. Appendini, C.M., Torres-Freyermuth, A., Salles, P., López-González, J., Mendoza, E.T., Wave Climate and Trends for the Gulf of Mexico: A 30-Yr Wave Hindcast. Journal of Climate2014, 27, 1619-1632. https://doi.org/10.1175/JCLI-D-13-00206.1.
5. Silva, R. Análisis y descripción estadística del oleaje, 1st ed.; Universidad Nacional Autónoma de México: México D.F., México, 2005.
6. Ortiz-Royero, J. C., Otero, L. J., Restrepo, J. C., Ruiz, J., Cadena, M. Cold fronts in the Colombian Caribbean Sea and their relationship to extreme wave events. Natural Hazards and Earth System Sciences 2013, 11, 2797-2804. https://doi.org/10.5194/nhess-13-2797-2013.
7. Otero, L. J., Ortiz-Royero, J. C., Ruiz-Merchan, J. K., Higgins, A.E., Henriquez, S.A. Storms or cold fronts: ¿what is really responsible for the extreme waves regime in the Colombian Caribbean coastal region? Natural Hazards and Earth System Sciences 2016, 16, 391-401.
8. Castañeda, J.E.S., Valencia, C.G., Quintero, M.D. Comité Técnico Nacional de Coordinación de Datos e Información Oceánica. In Manual de referencia en mejores prácticas de gestión de datos oceanográficos; Comisión Nacional del Océano: Bogotá, D.C., Colombia, 2017; 2, pp. 34.
9. Castillo, E. Extreme value theory in engineering, 1st ed.; Elsevier: San Diego, California, United States, 1987; pp. 389.