Mud Crab (Scylla serrata) Report:
2000-–2002
Queensland the Smart State
Fisheries
Long Term
Month Year
Queensland th
Fisheries
Long Term
Monitoring Program
Mud Crab (Scylla serrata) Report:
2000–2002
Eddie Jebreen
Sue Helmke
Chad Lunow
Clare Bullock
Neil Gribble
Olivia Whybird
Department of Primary Industries and Fisheries
Queensland
PR08-3498
This document may be cited as:
Jebreen E., Helmke S., Lunow C., Bullock C., Gribble N., Whybird, O., and Coles, R. (2008). Fisheries Long Term Monitoring Program, Mud Crab (Scylla serrata) Report: 2000-2002. Department of Primary Industries and Fisheries, Brisbane, Australia.
Acknowledgments:
Field and laboratory staff from the northern and southern fisheries centres are acknowledged for their contribution to the project. Mr Michael O’Neill and David Mayer are acknowledged for their contributions towards the statistical analyses.
General Disclaimer:
The Department of Primary Industries and Fisheries (DPI&F) seeks to maximise the economic potential of Queensland’s primary industries on a sustainable basis.
This publication has been compiled by Fisheries, Assessment and Monitoring.
While every care has been taken in preparing this publication, the State of Queensland accepts no responsibility for decisions or actions taken as a result of any data, information, statement or advice, expressed or implied, contained in this report.
© The State of Queensland, Department of Primary Industries and Fisheries 2008
Copyright protects this material. Except as permitted by the Copyright Act1968 (Cwlth), reproduction by any means (photocopying, electronic, mechanical, recording or otherwise), making available online, electronic transmission or other publication of this material is prohibited without the prior written permission of The Department of Primary Industries and Fisheries, Queensland.
Inquiries should be addressed to:
Intellectual Property and Commercialisation Unit Department of Primary Industries and Fisheries GPO Box 46
Brisbane Qld 4001 or
Contents
Contents...v
Summary... vii
Long Term Monitoring Background... 1
Introduction ... 2
Methods ... 3
Sites ... 3
Times... 4
Catch sampling... 5
Water quality ... 5
Data summaries and analysis ... 6
Size frequency ... 6
Catch rate ... 6
Sex ratios... 6
Bycatch ... 7
Water quality... 7
Commercial catch data summary ... 7
Recreational catch data summary ... 8
Month Year Results ... 9
Long Term Monitoring Program survey... 9
Size frequency ... 9
Catch rates ... 10
Sex ratio... 12
Bycatch ... 14
Water quality... 15
Fishery-dependent data ... 16
Commercial catch ... 16
Recreational catch ... 19
Discussion... 20
Acronyms
DPI&F Department of Primary Industries and Fisheries, Queensland
LTMP Long Term Monitoring Program, DPI&F
Summary
The Queensland Department of Primary Industries and Fisheries (DPI&F) manages the harvest of
Queensland’s fish, mollusc and crustacean species and the habitats they live in and is committed to monitor the condition and trends in fish populations and their habitats. This information is used to assess the
effectiveness of fisheries management strategies ensuring that the fisheries continue to be ecologically sustainable.
Two species of mud crab, Scylla serrata and S. olivacea, are found in Queensland waters (Keenan et al.
1998). The most abundant of these species in Queensland is S. serrata. The annual Queensland harvest of
mud crabs, primarily S. serrata, has been steadily increasing from approximately 200 t in 1988 to around
1000 t in 2000 - 2001. Commercial catch rates remained relatively constant at about 20 kg/day until 1997, increasing to 26 kg/day in 2000 - 2001. The high value of the fishery ($10.4 M) (Williams 2002), increasing catch rates and increasing total effort combined with general public pressure to review the suitability of current management arrangements, resulted in mud crabs being included in the DPI&F, Long Term Monitoring Program (LTMP).
The objectives of the mud crab monitoring was to obtain fishery-independent catch per unit effort data to estimate annual changes in relative abundance, record size frequency and sex ratios for long-term
comparison of population structure and population sustainability indicators, and to record changes in habitat, water quality, effects of fishing pressure and several additional abiotic variables.
Month Year
The sampling design included 17 regions statewide, from the Gulf of Carpentaria in north-western Queensland to Moreton Bay in south-eastern Queensland. Each region was stratified into four locations -
foreshore, mouth, mid- and upper-estuarine. Standard commercially available Munyana© brand crab pots are
used to conduct 20 pot sets annually at each location.
Bycatch (species not targeted and not kept) in the mud crab fishery, is relatively low in both amount and
diversity when compared to other fisheries (Barker et al. 2004). Bycatch retained in pots is predominantly
alive and can be released in good condition at the point of capture. The setting of pots to reduce exposure during periods of low tide can reduce the mortality of bycatch species.
The statewide summary of water quality data yields few correlations between the various water quality parameters and mud crab catches. However, there is anecdotal evidence from LTMP staff, researchers and recreational and commercial fishers that water quality does effect the location, sex and number of crabs that can be caught.
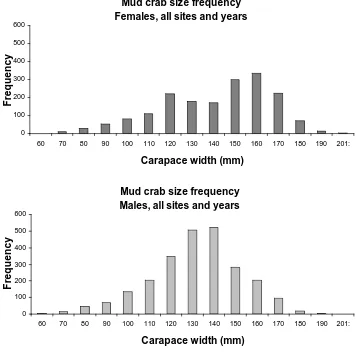
Significant differences in mean carapace width were observed between male and female crabs, between regions and between locations. However, the magnitude of these differences was often small. The size frequency of male crabs declines sharply above the 150 mm minimum carapace width where as female crabs show a bimodal size frequency distribution. This correlates with the minimum legal size, and it is likely the size frequency of male crab is influenced by fishing mortality. The difference in mean carapace width between locations showed a trend towards smaller crabs the further upstream the sampling occurred.
Long Term Monitoring Background
The Department of Primary Industries and Fisheries (DPI&F), Queensland, manages the State’s fish, mollusc and crustacean species and their habitats. As part of this commitment, DPI&F monitors the condition of, and trends in, fish populations and their associated habitats. This information is used to assess the effectiveness of fisheries management strategies and helps ensure that the fisheries remain ecologically sustainable.
DPI&F uses the information to demonstrate that Queensland’s fisheries comply with national sustainability guidelines, allowing exemption from export restrictions under the Australian
Government’s Environment Protection and Biodiversity Conservation Act 1999.
DPI&F initiated a statewide Long Term Monitoring Program (LTMP) in 1999, in response to a need for enhanced data used in assessment of Queensland’s fisheries resources. The LTMP is managed centrally by a steering committee with operational aspects of the program managed regionally from the Southern and Northern Fisheries Centres located at Deception Bay and Cairns respectively. The regional teams are responsible for organising and undertaking the collection of data used for monitoring key commercial and recreational species, and for preparing data summaries and preliminary resource assessments.
The LTMP collects data for resource assessment (ranging from analyses of trends in stock abundance indices to more complex, quantitative stock assessments) and management strategy evaluations.
Month Year
Stock assessment models have already been developed for saucer scallops, spanner crabs, stout whiting, mullet, tailor, barramundi, tiger and endeavour prawns, redthroat emperor, and spotted and Spanish mackerel. In some cases management strategy evaluations have also been completed and the data collected in the LTMP proved integral to these activities.
The assessments and evaluations have allowed for improvements to the management of Queensland’s fisheries resources. Enhancements to ongoing monitoring have also been identified, particularly to address the increasing demand for high quality data for dynamic fish population models.
Introduction
In Australia mud crabs occur in estuarine and coastal marine habitats from the Exmouth Gulf, Western Australia, eastwards along the northern coastline to Cape York and south down the east coast to the
New South Wales - Victorian border (Kailola et al. 1993).
Two species of mud crab, Scylla serrata and S. olivacea, are found in Queensland waters (Keenan
et al. 1998). The most abundant of these species in Queensland commercial and recreational catches is
S. serrata. The annual Queensland harvest of mud crabs, primarily S. serrata, has steadily increased
from approximately 200 tonnes to around 1000 tonnes since 1988. Commercial catch rates remained relatively constant at about 20 kg/day until 1997, increasing to 26 kg/day in 2000-2001. Coinciding with increasing catch rates is an increase in total effort from 12,000 days fished in 1988 to 40,000 days fished in 2001 (CFISH database).
The Queensland mud crab fishery is primarily a pot/dilly fishery, with the use of hooking prohibited since 1995. Mud crabs are taken by commercial, recreational and indigenous fishers. Crabbing is generally carried out in association with other forms of fishing, such that pots are set and left while carrying out other activities like netting (commercial) or line fishing (recreational or commercial). Mud crabs are also caught as bycatch in the Queensland set gillnet fishery.
Management of the commercial mud crab fishery is based on data from the Commercial Fisheries Information System (CFISH) logbook. Gear restrictions are enforced on the type and number of pots allowed, size restrictions (15 cm minimum legal carapace width), sex restrictions (only males to be taken) and bag limits on the recreational fishery (Fisheries Regulation 1995).
The LTMP mud crab monitoring program provides data for the Queensland fishery (both east coast and Gulf of Carpentaria) by surveying key river systems throughout the state. A ‘fixed’ sampling design, where the same site locations are surveyed each year, was chosen to control for high variation in abundance.
Methods
Sites
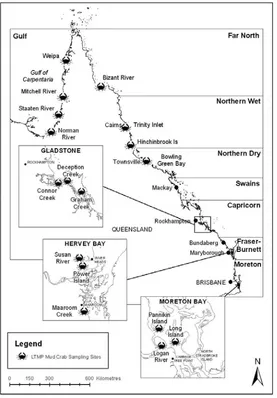
Sampling sites were selected to complement the major river catchments and correspond to areas of high commercial catches. Four regions were sampled in each of the Gulf of Carpentaria and the north east coast of Cape York. Three regions were sampled in each of the Gladstone, Hervey Bay and Moreton Bay areas (Figure 1).
Month Year
Figure 1. Map showing statewide distribution of mud crab sampling regions and commercial catch data summary regions.
Times
Sampling dates and times were determined by lunar and tidal cycles. In the Gulf of Carpentaria and north east coast regions where very large tides and strong tidal currents restrict the use of mud crab pots, sampling was conducted around the low tide during the neap tide period. In the central and south east coast regions where tidal flows are smaller and larger than average tides are required to gain vessel access to the sampling locations, sampling was conducted around the spring tides.
Trinity Inlet, Hinchinbrook and Bowling Green Bay were sampled in March each year. Gladstone, Hervey Bay and Moreton Bay were sampled in January and February. Discussions with local fishers suggested this as the optimal sampling period to maximise catches of mud crabs.
The Gulf of Carpentaria systems and Princess Charlotte Bay were sampled in May each year after the wet season. The freshwater flows will have decreased in the rivers by this time allowing the crabs to move back into the rivers.
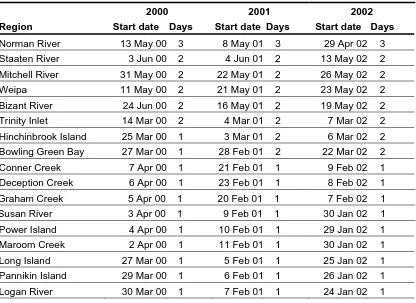
The sequence in which locations were sampled was identical between years to reduce variability associated with the tidal cycle. The start date of the surveys varied between years to coincide with the phase of the tidal cycle in the previous year. Survey dates for 2000, 2001 and 2002 are listed in Table 1.
Table 1. Mud crab survey start dates and length of survey (days) at each region from 2000 to 2002.
2000 2001 2002
Region Start date Days Start date Days Start date Days
Norman River 13 May 00 3 8 May 01 3 29 Apr 02 3 Staaten River 3 Jun 00 2 4 Jun 01 2 13 May 02 2 Mitchell River 31 May 00 2 22 May 01 2 26 May 02 2
Weipa 11 May 00 2 21 May 01 2 23 May 02 2
Catch sampling
Round, collapsible Munyana© crab pots were used to capture the crabs, as they are easily transportable
and readily available. Twenty pots were set at each of the four locations within a region. Pots were set along both sides of the creeks and rivers or one or both sides of the foreshore, parallel to shore. Depending on the available habitat either 50 or 100 m spacings are used (DPI&F 2005). Each pot was marked with a float and DPI&F label which was individually numbered, this ensures missing or displaced pots can be easily identified. Pots were baited with bait bags containing mullet.
In the Gulf of Carpentaria and the north east coast pots were set approximately three hours before the low and checked approximately three hours after the low allowing a soak time of approximately six hours for each pot. In Gladstone, Hervey Bay and Moreton Bay pots were set as close as practicable to the top of the evening high tide and retrieved approximately 12 hours later on the top of the morning
high tide. Total catch figures for Munyana© pots show no difference in either number, size or sex ratio
of crabs retained in pots set for either 6 hours or 12 hours (E. Jebreen, DPI&F, unpublished data). Several reasons could explain the drop in catch rate after six hours the most likely being that once several crabs are in the pot the rate of escape increases to match the rate of capture (E. Jebreen, DPI&F, unpublished data).
Month Year
All mud crabs (Scylla spp) caught were sexed, their carapace width measured and inspected for injury
(loss of appendages, deformity or obvious parasites). Measurements of both tip to tip (tip of the largest opercular spine) and notch to notch (base of largest opercular spine) carapace widths were made on 542 crabs to investigate the relationship between the two measurements and to permit conversion between the two. All crabs caught in the research pots were released.
In 2001, the LTMP team also collected crab samples in the Staaten River as part of the ‘white spot’ virus survey. In 2002 the total number of each species of bycatch captured in the pots was recorded.
Water quality
Water quality information may explain some of the temporal variability associated with the research catch numbers and the population size structure
Measurements of conductivity (mS/cm), salinity (ppt), turbidity (NTU), dissolved oxygen (mg/L), temperature (°C) and pH were recorded at the pot furthermost upstream and the pot furthermost downstream at each location. Water quality was measured at approximately 0.5 m below the water surface. If the water depth at this point was greater than three meters, water quality was also recorded at the bottom. Parameters were measured using a water quality meters, calibrated both before and during each survey. Dissolved oxygen was converted from milligrams per litre (mg/L) to a percentage using the following formula:
DO% = DO mg/L x 100 / {(14.3289-(0.3253*T)) + (0.0032*T2)}
DO is dissolved oxygen and T is temperature.
Data summaries and analysis
Catch data was included for analysis where pots were classified as fishing correctly. Catch from pots that were identified as having been robbed, or fouled, were not included in the analysis.
Size frequency
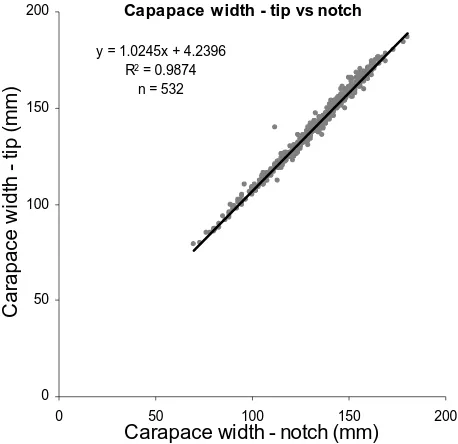
Linear regression was used to analyse the relationship between tip to tip and notch to notch carapace width measurements (Figure 2).
A generalised linear model was used to test the null hypotheses that mean carapace width does not vary between year, sex or location. The final model chosen excluded region as a main effects term and the analysis was repeated for each region. The model structure included year, sex and location as main effects, with the interactive terms year by location and location by sex.
Predicted mean carapace widths, with associated 95% confidence intervals were calculated for each region.
Figure 2. Crab size (carapace width) measurements from the tip to tip (distance between the points of the largest opercular spine on each side of the carapace) and notch to notch (distance between the notches above the largest opercular spines).
Catch rate
Mud crab catch rates expressed as the number of crabs, by sex (female, legal male and sub-legal male), were analysed using a generalised linear model with a negative binomial distribution and a logarithm link function. The model main effects were region (including all 17 regions sampled in Queensland), year (2000, 2001 and 2002), and the four locations within each region. The interaction terms, region by year and region by location were also modelled. The response variable was
standardised by the number of pot lifts that contributed to the catch by including a count of pot lifts as the first main covariate effect. The null hypothesis tested was that the number of crabs caught does not vary by region, year, location or sex.
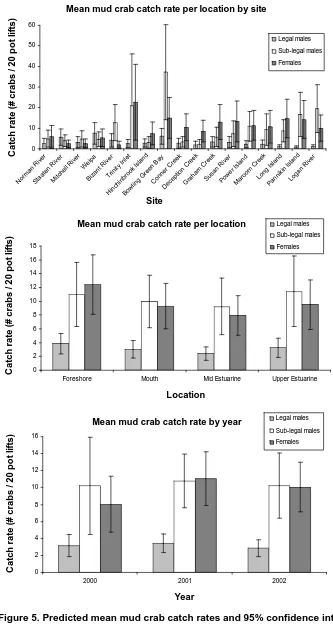
Predicted mean catches and 95% confidence intervals were calculated for each region, for sex by location and sex by year.
Sex ratios
model. The null hypothesis tested was that the proportion of crabs caught of a particular sex does not vary by region, year, or location.
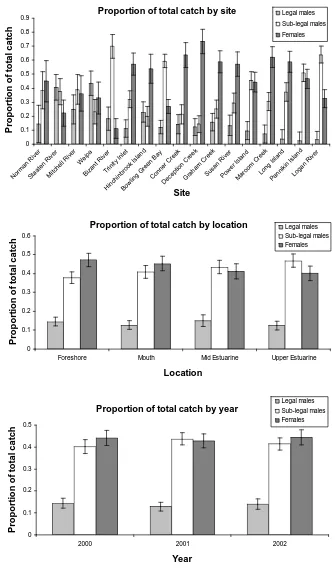
Predicted probabilities of each sex were calculated for each region, for the interactive terms sex by location and sex by year.
Bycatch
The number of bycatch species and the numbers of individuals captured for each of these species is reported by region and state. The number of individuals of each species is also reported as the percentage of total number of bycatch animals captured.
Water quality
Conductivity was measured in micro-Siemens per centimetre (μS/cm) for regions south of Bowling
Green Bay and in milli-Siemens per centimetre (mS/cm) in the northern region. All measurements have been presented as the latter. Where several measures of water quality parameters were taken for one location, the values were averaged.
Commercial catch data summary
Two main data sets were used for an overall summary of historical commercial mud crab catches for Queensland. The first are records from annual Queensland Fish Board Reports, and represent the annual reports of various fish boards responsible for marketing and distributing fish in Queensland between 1936 and 1981. This data may not include all Queensland catches, does not include reference to catch location, nor the fishing effort expended in obtaining the recorded catch and was only used in our analysis as an indication of total catch.
Month Year
A seven year gap exists in the historical data series from 1981 when the Queensland Fish Board Records ceased, until 1988 when the Queensland CFISH compulsory log book program began. The CFISH data set includes information on the location of the catch, total catch in whole weight kilograms and the amount of fishing effort in boat days required to obtain the recorded catch. In compiling summary information in relation to the catch of mud crabs some assumptions/criteria have been applied to this data set to remove potential errors These were:
Where a fishing end date has a value of 9999 this was equated to 1 day fished
Where days fished for a single record is more than 100 the record was excluded
Pot lifts were calculated as the larger of pot numbers or pot lifts. Where pot numbers and pot lifts were both null the number of pot lifts was assumed to be equal to the number of days fished x 50
(representing the maximum legal number of pots per fisher)1
Catch weight equals catch numbers for records where the catch weight equals zero (Gribble and Helmke, 1998).
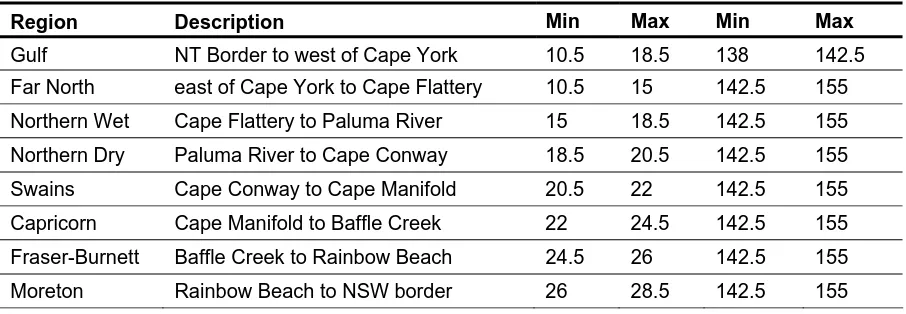
Annual statewide summaries of total catch and catch rates have been compiled for this report using the fish board and CFISH data sets. Regional summaries of total annual catch, average daily catch rate, total annual effort and total annual participation as recorded in the CFISH database, are presented based using the geographic boundaries outlined by the Tropical Resource Assessment Program (TRAP) (Gribble 2004) (Table 2).
1 Due to the difficulty in calculating the numbers of pot lifts, fishery-dependent data in this report is presented as
Table 2. Regional boundaries for summaries of commercial mud crab catch data (Source: Gribble 2004).
Region Description Min Max Min Max
Gulf NT Border to west of Cape York 10.5 18.5 138 142.5 Far North east of Cape York to Cape Flattery 10.5 15 142.5 155 Northern Wet Cape Flattery to Paluma River 15 18.5 142.5 155 Northern Dry Paluma River to Cape Conway 18.5 20.5 142.5 155 Swains Cape Conway to Cape Manifold 20.5 22 142.5 155 Capricorn Cape Manifold to Baffle Creek 22 24.5 142.5 155 Fraser-Burnett Baffle Creek to Rainbow Beach 24.5 26 142.5 155 Moreton Rainbow Beach to NSW border 26 28.5 142.5 155 Recreational catch data summary
Recreational catch and effort data collected during the 1997 and 1999 Recreational Fisheries
Results
Long Term Monitoring Program survey
Size frequency
Linear regression assessing the relationship between tip to tip and notch to notch carapace (Figure 2)
width measures yielded an R2 = 0.987, indicating a very tight relationship between the two measures
(Figure 3). Subsequently notch to notch measures of carapace width have been converted to tip to tip measures for analysis and presentation, maintaining consistency and relevance to current minimum legal size restrictions on the take of male mud crabs.
Month Year
Capapace width - tip vs notch
y = 1.0245x + 4.2396
R2 = 0.9874
n = 532
0 50 100 150 200
0 50 100 150 200
Carapace width - notch (mm)
C
a
ra
p
a
c
e
w
id
th
- t
ip
(mm)
Figure 3. Linear regression of tip to tip and notch to notch mud crab carapace width measurements.
Mud crab size frequency Females, all sites and years
0 100 200 300 400 500 600
60 70 80 90 100 110 120 130 140 150 160 170 180 190 201:
Carapace width (mm)
Fr
eque
ncy
Mud crab size frequency Males, all sites and years
0 100 200 300 400 500 600
60 70 80 90 100 110 120 130 140 150 160 170 180 190 201:
Carapace width (mm)
F
re
quenc
y
Figure 4. Mud crab size frequency for all years and regions by sex.
Catch rates
The analysis of survey catch rates standardised by number of pot lifts, region, year and location permits the direct comparison of catch rates across the state. The catch rates of females varied significantly between regions (df=17,95; F=3.47; p=<0.001), but did not vary significantly between years or locations within regions (Figure 5). The catch rate of legal male crabs varied significantly between regions (df=17,95; F=3.18; p=<0.001) but did not vary significantly with year or location within region. However, the interaction term region by year was significant (df=31,95; F=1.51; p=0.034), indicating that although catch rates did vary significantly between regions, this variation was not consistent across years (Figure 5). The catch rate of sub-legal males varied significantly between region (df=17,95; F=5.72; p=<0.001) and year (df=2,95; F=4.22; p=0.015). However, the interaction term region by year was again significant (df=31,95; F=1.78; p=0.005), indicating the variation in catch rates between regions was not consistent across years (Figure 5). Given the
Month Year
Mean mud crab catch rate per location by site
0 10 20 30 40 50 60 Norm an Ri
ver Staa
ten Ri ver Mitc
hell R iver
Wei pa Biza
nt R iver Trin ity I nlet Hinc hinbr ook Isla nd Bow ling Green Bay Conn
er Cr eek Dece
ptio n Cr
eek Grah am C reek Susa n Ri ver Pow
er Isl and Mar oom C reek Long Isla nd Pann ikin Isla nd Log
an Ri ver Site C a tc h r a te ( # c ra b s / 2 0 p o t lif ts ) Legal males Sub-legal males Females
Mean mud crab catch rate per location
0 2 4 6 8 10 12 14 16 18
Foreshore Mouth Mid Estuarine Upper Estuarine
Location C a tc h r a te ( # cr a b s / 20 pot l if ts) Legal males Sub-legal males Females
Mean mud crab catch rate by year
0 2 4 6 8 10 12 14 16
2000 2001 2002
Year C a tc h r a te (# c ra b s / 2 0 p o t li ft s ) Legal males Sub-legal males Females
Sex ratio
The analysis of survey catch sex ratios standardised by region, year and location permits the direct comparison of catch proportions across the state. The proportion of total catch that were female crabs varied significantly between region (df=16,96; F=18.32; p=<0.001) and location (df=3,96; F=4.04; p=0.009). However, both interaction terms, region by year (df=31,96; F=2.75; p=<0.001) and region by location (df=48,96; F=1.65; p=0.019) were significant making interpretation of the main effect term uncertain (Figure 6). The significant interaction terms suggests that although the variation in the proportion of total catch that were female crabs was significant between regions, this was not
consistent between years or location. The proportion of total catch that were legal male crabs varied significantly between regions (df=16,96; F=17.47; p=<0.001). However, the interaction term region by year was again significant (df=31,96; F=1.87; p=0.011), indicating that differences between regions were not consistent across years (Figure 6). The proportion of total catch that were sub-legal males varied significantly between region (df=16,96; F=20.64; p=<0.001) and location (df=3,96; F=5.67; p=0.001). However, both of the interaction terms region by year (df=31,96; F=3.08; p=<0.001) and region by location (df=48,96; F=2.17; p=<0.001) were significant (Figure 6). The significant
Month Year
Proportion of total catch by site
0 0.1 0.2 0.3 0.4 0.5 0.6 0.7 0.8 0.9 Nor man Rive r Staa ten Rive r Mitc
hell R iver
Wei pa Bizan
t Riv er Trini
ty In let Hinc hinb rook Islan d Bow ling Green Bay Conn
er C reek Dec
ept ion C
ree k Grah am Creek Sus an R iver Pow
er Is land Mar oom Creek Long Island Pann ikin Islan d Loga
n R iver Site P ro por ti on of t ot a l c a tc h Legal males Sub-legal males Females
Proportion of total catch by location
0 0.1 0.2 0.3 0.4 0.5 0.6
Foreshore Mouth Mid Estuarine Upper Estuarine
Location P ro por ti on of t ot a l c a tc h Legal males Sub-legal males Females
Proportion of total catch by year
0 0.1 0.2 0.3 0.4 0.5
2000 2001 2002
Year Pr opo rt ion o f t o ta l c a tc h Legal males Sub-legal males Females
Bycatch
A total of 505 animals other than S. serrata from 36 different species were caught and released alive
(Table 3). Bycatch diversity was greatest in the northern regions (Gulf of Carpentaria and north east coast). The greatest numbers of bycatch individuals were caught in the Gladstone and Hervey Bay region.
Table 3. Number of individuals and bycatch taxa caught during the 2002 mud crab surveys.
No. of individuals No. of taxa
Gulf of Carpentaria 99 20% 18
north east coast 92 18% 20
Gladstone 118 23% 10
Hervey Bay 81 16% 6
Moreton Bay 115 23% 6
Total 505 36
Blue swimmer crabs (Portunus pelagicus) and yellow-finned bream (Acanthopagarus australis) were the most common species in the bycatch (Appendix A).
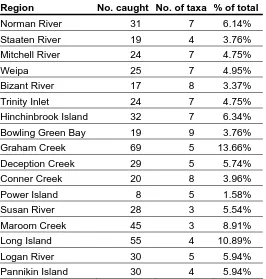
The greatest amount of bycatch by number of individuals was caught in south east Queensland in Graham Creek (13.7%), Long Island (10.9%) and Maroom Creek (8.91%). The largest number of bycatch species was caught in Bowling Green Bay (9), the Bizant River (8) and Conner Creek (8) (Table 4).
Table 4. Number of individuals and bycatch taxa caught during the 2002 mud crab surveys.
Region No. caught No. of taxa % of total
Norman River 31 7 6.14%
Staaten River 19 4 3.76%
Mitchell River 24 7 4.75%
Weipa 25 7 4.95%
Bizant River 17 8 3.37%
Trinity Inlet 24 7 4.75%
Hinchinbrook Island 32 7 6.34% Bowling Green Bay 19 9 3.76%
Graham Creek 69 5 13.66%
Deception Creek 29 5 5.74%
Conner Creek 20 8 3.96%
Power Island 8 5 1.58%
Susan River 28 3 5.54%
Maroom Creek 45 3 8.91%
Long Island 55 4 10.89%
Logan River 30 5 5.94%
Water quality
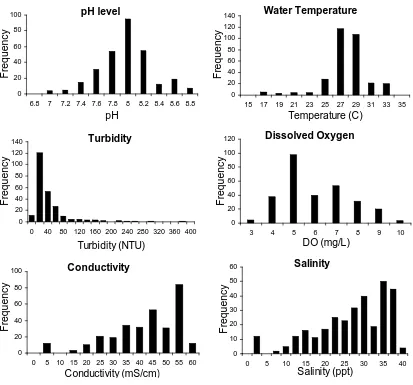
Water quality parameters varied within expected limits with the exception of some low salinity (<5 ppt) and correspondingly low conductivity (<5 mS/cm) (Figure 7). Water temperature varied from 17 to 33°C, pH from 7 to 8.8, turbidity was generally low between 20 and 80 NTU and dissolved oxygen ranged from 3 to 10 mg/L (Figure 7).
Month Year
Figure 7. Water quality parameters for all years and regions. pH level
0 20 40 60 80 100
6.8 7 7.2 7.4 7.6 7.8 8 8.2 8.4 8.6 8.8
pH
F
reque
ncy
Salinity
0 10 20 30 40 50 60
0 5 10 15 20 25 30 35 40
Salinity (ppt)
F
requenc
y
Conductivity
0 20 40 60 80 100
0 5 10 15 20 25 30 35 40 45 50 55 60
Conductivity (mS/cm)
F
reque
ncy
Turbidity
0 20 40 60 80 100 120 140
0 40 80 120 160 200 240 280 320 360 400
Turbidity (NTU)
F
requenc
y
Water Temperature
0 20 40 60 80 100 120 140
15 17 19 21 23 25 27 29 31 33 35
Temperature (C)
F
requenc
y
Dissolved Oxygen
0 20 40 60 80 100 120
3 4 5 6 7 8 9 10
DO (mg/L)
F
requenc
Fishery-dependent data
Commercial catch
Queensland Fish Board records show a stable total mud crab catch of approximately 125 t between 1961 and 1981 (Figure 8). CFISH records indicate an increase in total catch from 247 t in 1988 to a maximum annual catch of 1034 t in 2000. Total catch for 2001 was slightly lower than in 2000 at 1029 t and figures for 2002 were incomplete at the time of analysis. Average daily catch rate,
expressed as kilograms per boat day, remained relatively stable between 18 and 22 kg/day from 1988 until 1997. Average daily catch rate then increased from 19 kg/day in 1997 to 25 kg/day in 2000. The average daily catch rates appear to have stabilised at this level with a similar figure of 26 kg/day for 2001. Average daily catch rates for 2002 are artificially inflated due the incomplete data set for this year (Figure 8).
Mud crab total annual catch and average daily catch rate
0 200 400 600 800 1000 1200 196 1 196 2 196 3 196 4 196 5 196 6 196 7 196 8 196 9 197 0 197 1 197 2 197 3 197 4 197 5 197 6 197 7 197 8 197 9 198 0 198 1 198 8 198 9 199 0 199 1 199 2 199 3 199 4 199 5 199 6 199 7 199 8 199 9 200 0 200 1 200 2 Year C at c h ( tons ) 0 5 10 15 20 25 30 C a tc h r a te ( k g .d a y )
Total catch (t) (Fish board) Total catch (t) (CFish) Total catch (t) (CFish incomplete) Catch rate (kg/day)
Figure 8. Queensland mud crab annual total catch and average daily catch rates (Source: Queensland Fish Board and Commercial Fisheries Information System) Note: no data is available for 1982-1987.
Mud crab annual effort
0 5000 10000 15000 20000 25000 30000 35000 40000 45000
19
88
19
89
19
90
19
91
19
92
19
93
19
94
19
95
19
96
19
97
19
98
19
99
20
00
20
01
20
02
Year
E
ff
o
rt
(d
a
y
s
)
0 100 200 300 400 500 600
P
ar
ti
c
ip
ant
s
(
#boa
ts
)
Days fished Days fished (incomplete) Boat numbers
Figure 9. Queensland mud crab annual total effort and participation (Source: Commercial Fisheries Information System).
Month Year
Capricorn 0 50 100 150 200 250 300 350 400 450 19 88 19 89 19 90 19 91 19 92 19 93 19 94 19 95 19 96 19 97 19 98 19 99 20 00 20 01 20 02 Year Ca tc h ( t) 0 10 20 30 40 C a tc h r a te ( k g/ day)
Total catch (t) Catch rate (kg/day)
Far North 0 50 100 150 200 250 300 350 400 450 19 88 19 89 19 90 19 91 19 92 19 93 19 94 19 95 19 96 19 97 19 98 19 99 20 00 20 01 20 02 Year Ca tc h ( t) 0 10 20 30 40 C a tc h r a te ( k g /d a y )
Total catch (t) Catch rate (kg/day)
Fraser Burnett 0 50 100 150 200 250 300 350 400 450 19 88 19 89 19 90 19 91 19 92 19 93 19 94 19 95 19 96 19 97 19 98 19 99 20 00 20 01 20 02 Year Ca tc h ( t) 0 10 20 30 40 C a tc h r a te ( k g /d a y )
Total catch (t) Catch rate (kg/day)
Gulf 0 50 100 150 200 250 300 350 400 450 19 88 19 89 19 90 19 91 19 92 19 93 19 94 19 95 19 96 19 97 19 98 19 99 20 00 20 01 20 02 Year Ca tc h ( t) 0 10 20 30 40 C a tc h r a te ( k g /d a y )
Total catch (t) Catch rate (kg/day)
Capricorn 0 2000 4000 6000 8000 10000 12000 19 88 19 89 19 90 19 91 19 92 19 93 19 94 19 95 19 96 19 97 19 98 19 99 20 00 20 01 20 02 Year E ff o rt (d a y s ) 0 25 50 75 100 125 150 P a rt ic ip a tio n (# boat s)
Days fished Number boats
Far North 0 2000 4000 6000 8000 10000 12000 19 88 19 89 19 90 19 91 19 92 19 93 19 94 19 95 19 96 19 97 19 98 19 99 20 00 20 01 20 02 Year E ffo rt ( d a y s ) 0 25 50 75 100 125 150 P a rt ic ip a tio n (# boat s)
Days fished Number boats
Fraser Burnett 0 2000 4000 6000 8000 10000 12000 19 88 19 89 19 90 19 91 19 92 19 93 19 94 19 95 19 96 19 97 19 98 19 99 20 00 20 01 20 02 Year E ffo rt ( d a y s ) 0 25 50 75 100 125 150 P a rt ic ip a tio n (#bo at s)
Days fished Number boats
s Gulf 0 2000 4000 6000 8000 10000 12000 19 88 19 89 19 90 19 91 19 92 19 93 19 94 19 95 19 96 19 97 19 98 19 99 20 00 20 01 20 02 Year E ffo rt ( d a y s ) 0 25 50 75 100 125 150 P a rt ic ipat io n ( # b oat s)
Days fished Number boats
Month Year Moreton 0 50 100 150 200 250 300 350 400 450 198 8 198 9 199 0 199 1 199 2 199 3 199 4 199 5 199 6 199 7 199 8 199 9 200 0 200 1 200 2 Year Ca tc h ( t) 0 10 20 30 40 C a tc h r a te ( k g /d a y )
Total catch (t) Catch rate (kg/day)
Northern Dry 0 50 100 150 200 250 300 350 400 450 19 88 19 89 19 90 19 91 19 92 19 93 19 94 19 95 19 96 19 97 19 98 19 99 20 00 20 01 20 02 Year Ca tc h ( t) 0 10 20 30 40 C a tc h ra te (k g /d a y )
Total catch (t) Catch rate (kg/day)
Northern Wet 0 50 100 150 200 250 300 350 400 450 19 88 19 89 19 90 19 91 19 92 19 93 19 94 19 95 19 96 19 97 19 98 19 99 20 00 20 01 20 02 Year Ca tc h ( t) 0 10 20 30 40 C a tc h ra te (k g /d a y )
Total catch (t) Catch rate (kg/day)
Moreton 0 2000 4000 6000 8000 10000 12000 1 988 1 989 1 990 1 991 1 992 1 993 1 994 1 995 1 996 1 997 1 998 1 999 2 000 2 001 2 002 Year E ff o rt (d a y s ) 0 25 50 75 100 125 150 P a rt ic ip at io n ( #bo at s )
Days fished Number boats
Northern Dry 0 2000 4000 6000 8000 10000 12000 19 88 19 89 19 90 19 91 19 92 19 93 19 94 19 95 19 96 19 97 19 98 19 99 20 00 20 01 20 02 Year E ff o rt (d a y s ) 0 25 50 75 100 125 150 P a rt ic ipa ti o n ( # bo at s )
Days fished Number boats
Northern Wet 0 2000 4000 6000 8000 10000 12000 19 88 19 89 19 90 19 91 19 92 19 93 19 94 19 95 19 96 19 97 19 98 19 99 20 00 20 01 20 02 Year E ff o rt (d a y s ) 0 25 50 75 100 125 150 P ar ti c ipat ion ( # boa ts )
Days f ished Number boats
Swains 0 2000 4000 6000 8000 10000 12000 19 88 19 89 19 90 19 91 19 92 19 93 19 94 19 95 19 96 19 97 19 98 19 99 20 00 20 01 20 02 Year E ff o rt ( day s ) 0 25 50 75 100 125 150 Pa rt ic ip a tio n (# bo at s )
Days f ished Number boats
Swains 0 50 100 150 200 250 300 350 400 450 19 88 19 89 19 90 19 91 19 92 19 93 19 94 19 95 19 96 19 97 19 98 19 99 20 00 20 01 20 02 Year Ca tc h ( t) 0 10 20 30 40 C a tc h ra te (k g /d a y )
Total catch (t) Catch rate (kg/day)
Recreational catch
Recreational catch statistics show approximately 50% of total catch and 60% of total effort occur in close proximity to the major east coast urban centres of Cairns, Townsville and Brisbane. In contrast between 40 and 60% of commercial catch and effort is located in the remote regional communities of the Gulf of Carpentaria and the Capricorn region on the central east coast. Recreational catch data for the Far North Region is shown as zero percent for both catch and effort statistics, most likely due to its small population leading to an under representation in the recreational survey .
Table 5. Recreational and commercial catch presented as a percentage of the total catch, by weight, retained for each region in 1997, 1999 and commercial catch only 2001. (Source: Recreational and Commercial Fisheries Information System).
Catch Recreational Commercial
Region 1997 1999 1997 1999 2001
Gulf 5% 5% 22% 14% 18%
Far North 0% 0% 6% 5% 4%
Northern Wet 4% 11% 9% 10% 7%
Northern Dry 20% 29% 12% 20% 12%
Swains 11% 4% 2% 2% 3%
Capricorn 17% 15% 29% 29% 40%
Fraser-Burnett 10% 16% 9% 9% 8%
Moreton 34% 20% 11% 11% 9%
Table 6. Recreational and commercial effort data presented as a percentage of the total effort in numbers of trips or numbers of days fished respectively, for each region in 1997, 1999 and commercial only 2001 (Source: Recreational and Commercial Fisheries Information System).
Effort Recreational Commercial
Region 1997 1999 1997 1999 2001
Gulf 3% 3% 17% 12% 14%
Far North 0% 0% 4% 3% 3%
Northern Wet 3% 8% 10% 10% 10%
Northern Dry 16% 20% 11% 16% 15%
Swains 9% 4% 2% 2% 2%
Capricorn 14% 12% 28% 27% 29%
Fraser-Burnett 12% 18% 12% 10% 10%
Discussion
The DPI&F manages the harvest of Queensland’s fish, mollusc and crustacean species and the habitats they live in. It is committed to monitor the condition and trends in fish populations and their habitats through a long term monitoring program. Information from this program is used to assess the effectiveness of fisheries management strategies and to ensure that fisheries continue to be
ecologically sustainable. The LTMP data is used in conjunction with surveys and logbook data from recreational and commercial fishers.
Mud crabs were included in this LTMP because of the high value of the fishery to local economies ($10.4 M) (Williams 2002), increasing catch rates and increasing total effort and general public pressure to review the suitability of current management arrangements.
The objectives of the mud crab monitoring was to obtain fishery-independent catch per unit effort data to estimate annual changes in relative abundance, to record size frequency and to measure sex ratios for long-term comparison of population structure and population sustainability indicators. Changes, water quality and fishing pressure and several additional abiotic variables were also collected.
Month Year
Although total catch increased, commercial catch rates remained relatively constant at about 20 kg/day until 1997, and then increased to around 26 kg/day in 2000-01. There is no evidence to suggest
trapping equipment or fishing methods have improved through this time. An explanation for catch rates improving as total catch increases is that access to more remote parts of the coast has become easier through demographic change and/or that effort has expanded to fish previously unexploited or poorly exploited populations.
Differences in mean carapace width were observed between male and female crabs, between regions and between locations. However, the magnitude of these differences was often small. The size
frequency of male crabs declines sharply above the 150 mm minimum carapace width where as female crabs show a bimodal size frequency distribution. This correlates for male crabs with the minimum legal size, and it is likely the size frequency of male crab is influenced by fishing mortality. There are indications from the bimodal nature of the female crab carapace width data that mid sized female crabs are underrepresented in the catches and they may move or migrate away from inshore areas at this time.
The difference in mean carapace width between locations appeared to show a preliminary indication of size specific habitat utilisation. However locations were chosen to represent a habitat type and were not necessarily up or down-stream from each other.
In the Gulf of Carpentaria, which has no major urban centres, catch rates were lower than on the east coast and the catch rates of females were lower than male catch rates in the fishery-independent sampling. The total catch rates in independent sampling of sub-legal male crabs increased and legal male crabs decreased with proximity to major urban centres (Trinity Inlet, Bowling Green Bay and Hervey and Moreton Bays). No correlation was apparent between the catch rates of female crabs and proximity to urban centres. Queensland legislation prohibits keeping female crabs of any size and male crabs with a carapace width less than 150 mm. This leads to a bias in fishing pressure to larger males. Near urban centres the populations have more female crabs and a greater proportion of male crabs are small.
conducive to mud crab populations as the large extent of the mangrove forests would suggest. Catch rates from the LTMP were highest in large north facing bays (Trinity Inlet, Bowling Green Bay and Moreton Bay) that have previously been identified as highly productive for marine plant communities
such as seagrass (Coles et al. 1993)
Bycatch (species not targeted) in the mud crab fishery, was relatively low in both amount and diversity
when compared to other fisheries (Barker et al. 2004). Bycatch retained in pots was predominantly
alive and released in good condition at the point of capture. The setting of pots to reduce exposure during periods of low tide can reduce the mortality of bycatch species. Blue swimmer crabs, yellow-fin brim, and forktailed catfish were by far the most common fish. Occasional sharks and rays enter pots but at extremely small numbers. No bycatch is of significance as a species of conservation interest.
The statewide summary of water quality data yields few correlations between the various water quality parameters and mud crab catches. However, there is anecdotal evidence from, researchers and
recreational and commercial fishers that water quality does effect the location, sex and number of crabs that can be caught. It is possible that the effect of water quality has influence at finer spatial and temporal scales than could be addressed in this statewide survey approach. Further analysis of this data is required to further understand the relationship between water quality and mud crab movements and catch rates.
References
ANZECC and ARMCANZ (2000). ‘Australian and New Zealand Guidelines for Fresh and Marine Water Quality’. National Water Quality Management Strategy Paper No.4., Volume 1
(Australian and New Zealand Environment and Conservation Council and the Agriculture and Resource Management Council of Australia and New Zealand: Canberra).
Barker, J., O’ Sullivan, S., Jebreen, E.J, Roy, D., and Kennedy, C. (2004). Fisheries Long-Term Monitoring Program, Benthic Marine Fauna Composition in the Scallop Fishery Area in 2000 and 2002, Department of Primary Industries and Fisheries, Brisbane, Australia.
Coles, R.G., Lee Long, W.J., Watson, R.A., and Derbyshire, K.J. (1993). Distribution of seagrasses, and their fish and penaeid prawn communities, in Cairns Harbour, a tropical estuary, northern
Queensland, Australia. Australian Journal of Marine and Freshwater Research. 44, 193-210.
Department of Primary Industries and Fisheries (2005). Fisheries Long Term Monitoring Program Sampling Protocol – Mud Crab (2000-2005). Department of Primary Industries and Fisheries, Queensland, Brisbane, Australia.
Fisheries Regulation 1995, subordinate legislation of the Fisheries Act 1994, Office of the Queensland Parliamentary Council.
Month Year
Gribble, N.A. (Ed) (2004). Tropical Resource Assessment Program Final Report (Qld inshore fish stocks): Phase I, Collation and assessment of available fisheries information. Phase II Model application and validation. FRDC 1999/125 Final Report. Queensland Department of Primary Industries Information Series. Cairns, Australia.
Gribble, N., and Helmke, S. (1998). Tropical Resource Assessment Program: Summary of mud crab distribution in Tropical Queensland. Department of Primary Industries, Brisbane, Australia.
Kailola, P., Williams, M.J., Stewart, P., Reichelt, R., McNee, A., and Grieve, C. (1993). ‘Australian Fisheries Resources.’ (Bureau of Resource Science, Department of Primary Industries and Energy: Canberra).
Keenan C.P., Davie, P.J.F., and Mann, D.L. (1998). A revision of the genus Scylla De Hann, 1833
(crustacean: Decapoda: Brachyura: Portunidae). Raffles Bulletin of Zoology 46, 217–45.
Appendix
Table 7. Bycatch species caught in mud crab pots during 2002 surveys.
Scientific Name Common Name
Norman River Staaten Riv
er
Mitchell River Weipa Bizant Riv
er
Trinity Inlet Hinch
in
brook I
s
lan
d
Bowli
ng Gree
n
Bay
Con
ner Cre
e
k
Dece
ption Cr
e
e
k
Graham Cre
e
k
Susan R
iver
Power Isla
nd
Maroom Creek Lon
g Islan
d
Pann
ikin Isla
nd
Log
an Riv
er
Tota
l n
u
mbe
r c
a
ught
Portunus pelagicus blue swimmer crab 7 7 13 17 3 8 18 7 3 1 12 43 17 8 164
Acanthopagrus australis yellow-fin bream 1 2 3 42 24 1 10 9 11 19 122
Arius spp. forktail catfishes 18 14 6 9 4 3 3 1 4 1 63
Thalamita crenata crenate swimming crab 3 2 1 23 2 1 1 33
Epinephelus coioides estuary cod 3 8 2 4 12 29
Xanthidae - undifferentiated crabs 1 6 1 1 3 7 19
Acanthopagrus berda pikey bream 5 1 2 1 2 11
Paguridae - undifferentiated hermit crabs 2 1 6 9 Epinephelus malabaricus malabar grouper 2 1 1 2 6 Nibea squamosa jewel fish 3 2 5 Protonibea diacanthus black jewfish 5 5 Scatophagidae - undifferentiated scats 2 2 4
Brachaelurus waddi blind shark 3 3 Dasyatidae - undifferentiated stingrays 1 2 3
jelly fish jelly fish 2 1 3 Triodontidae - undifferentiated three-toothed puffers 2 1 3
Carcharhinidae- undifferentiated requiem sharks 1 1 2
Monacanthus chinensis fanbellied leatherjacket 1 1 2 Nibea soldado silver jewfish 2 2 Ambassis spp. glassfishes 1 1 Amniataba percoides banded grunter 1 1
Aptychotrema vincentiana western shovelnose ray 1 1
Carcharhinus macloti hardnose shark 1 1
Eleutheronema tetradactylum blue salmon 1 1 Epinephelus spp. rockcods 1 1 Halophryne diemensis banded frogfish 1 1
Latridae - undifferentiated trumpeters 1 1
Microcanthus strigatus stripey 1 1 Muraenesox cinereus dagger tooth pike conger 1 1
Netuma thalassinus giant seacatfish 1 1 Platycephalus arenarius sand flathead 1 1
Platycephalusspp. flatheads 1 1
Pomadasys agenteus small spotted grunter bream 1 1
Pomadasysspp. grunter breams 1 1
Soleidae - undifferentiated soles 1 1
Uranoscopidae - undifferentiated stargazers 1 1