Fair Cellular Throughput Optimization
with the Aid of Coordinated Drones
Edgar Arribas
IMDEA Networks Institute Universidad Carlos III de MadridVincenzo Mancuso
IMDEA Networks Institute [email protected]Vicent Cholvi
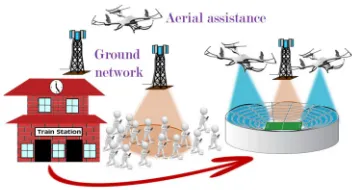
Universitat Jaume IAbstract—The interest on flexible air-to-ground channels from aerial base stations to enhance users access by seeking good line-of-sight connectivity from the air has increased in the past years. In this paper, we propose a deployable analytical framework for the 3-D placement of a fleet of coordinated drone relay stations to optimize network capacity according to α-fairness metrics. We formulate a mixed-integer non-convex program, which results to be intractable. Therefore, we design a near-optimal heuristic that can solve the problem in real-time applications. We assess the performance of our proposal by simulation, using a realistic urban topology, and study pros and cons of using drone relay stations in both static and dynamic scenarios, when popular events gather masses of users in limited areas.
I. INTRODUCTION
Cellular infrastructures are evolving towards flexible and reconfigurable solutions, able to cope with high densities of users. The fifth generation (5G) of networks [1] will include novel network paradigms, like smart and flexible relaying [2]. Precise beamforming and efficient cooperative transmission techniques will enable to operate broadband wireless backhaul links [3], which are key to promote the use of mobile relays. Mobile relays can be mounted on vehicles and drones, so to move the network with the users, by moving relays where the fixed network cannot sustain the user demand [4]. Guo and O’Farrel [5] derived the capacity of OFDMA cellular networks like LTE/LTE-A in presence of relays reusing cellular frequen-cies. Although they do not model the use of drones, they show interference is the main limiting factor, so that relays like drones do need to be operated onto orthogonal frequencies, which gives additional advantages in terms of simplified re-source allocation control [6]. Thus, we study the case of drones and base stations (BSs) transmitting on orthogonal bands.
Current works study optimal drone placement in oversimpli-fied cases, neglecting inter-drone interference and fairness. We focus instead on the optimization of 3-D positions for a fleet of coordinated drone relays, as shown in Figure 1, based on the α-fairness metric—a high-level generalization of fairness metrics to target maximum throughput, proportional fairness ormax-minfairness in one framework [7]. We model random variations of signals, interference from relays and BSs, use of slotted time-frequency resources, cell selection and resource allocation schemes. Concretely, we adopt stochastic models for path-loss and availability of line-of-sight (LoS) and non-LoS (Nnon-LoS) links, and cast our problem into an OFDMA-like resource allocation scheme.
Finding the optimal drone positions is an NP-complete problem. However, we leverage a class of algorithms designed
Figure 1: Reference scenario: multi-drone-aided network.
for optimization with intertwined variables: Extremal Opti-mization (EO) [8], which run in polynomial time. EO is based on iteratively picking the “least fit” element of a discrete set and change its parameters to improve the utility function.
We therefore formulate a suitable utility function, targeting
α-fair user throughput, and design PD-EOA: a Partially-Distributed EO Algorithm that iteratively updates the position of the least fit drone, i.e., the drone relay that contributes the least to the utility function. Although EO is a form of central-ized algorithms originally introduced for static optimization, we use such technique to design a partially distributed algo-rithm that works dynamically, as the system evolves.
We validate our proposal and assess its performance by simulations in realistic static and dynamic scenarios. As an illustration, we evaluate the performance of PD-EOA when users move towards a stadium before a sport event, so that their density grows over time. Our analysis unveils that the role of interference from drones and the stochastic characterization of LoS between drones and users make the optimization problem intractable, yet we are able to provide a near-optimal heuristic.
II. RELATED WORK
neither fixed nor unplanned, and the channel propagation is impacted by the LoS state, which varies over time.
Thus, satellites, balloons or terrestrial relays cannot face scenarios as the ones we study, since protocol designs, technol-ogy constraints and signal propagation are radically different. Moving drones to optimal locations to maximize various metrics is actively being investigated in the literature. Al-Hourani et al. [12] derived optimal altitude for one drone to maximize coverage, while Hayajneh et al. [13] derived optimum drone altitude to minimize outages and bit-error rate. Mozaffariet al.[14] found optimal locations for multiple non-interfering drones to minimize the total transmission power. Guo et al. [4] studied the generic use of drones as relays. Their approach provides more throughput in low-connectivity areas, but does not account for issues like spectral efficiency. Andryeyevet al.[15] estimate drone positions to increase cel-lular capacity through a self-organization algorithm based on repulsionfrom BSs and drones, andattractionby mobile users. These works provide valuable and foundational contribu-tion, but do not study problems like fair capacity maximization when drones assist cellular networks, neither provide realistic frameworks to integrate drone relays into current cellular networks, which is what we target with our approach.
III. SYSTEM MODEL
We derive an analytical framework to find optimal 3-D loca-tions of drone relays, given the position of users and ground BSs. We target α-fair instantaneous user rates by selecting drone positions as a function of the resource allocation policy adopted by ground BSs and drones the users can attach to.
A. Reference Scenario
We consider a ground surfaceSwhere a setG ofGground BSs (gBS) provide service to a set U of U user equipments (UEs). The positions of each gBS g and user u are known and denoted as Πg= (Xg, Yg) and π
u= (xu, yu). We also consider a fleet A of A aerial BSs (aBS) as mobile relays, carried by drones. We assume the system operator offers user access through two bands, one used bygBSs and another used byaBSs, soaBSs andgBSs do not interfere. We denote by
Πa= (Xa, Ya, ha)the 3-D position of eachaBS a∈ A, and by B=G ∪Athe set of all BSsb∈ Bthat form the whole network. We assume that aBSs connect to the closestgBS through wireless links with finite rate constraints. Operators usually installgBSs on top of buildings or towers, so we assume that
gBS-aBS links are free of obstacles. We denote the limit on the gBS-aBS link capacity as τa, and assume that it can be computed based on the position of a∈ A.
The interference from aBSs affects the Signal-to-Noise-and-Interference Ratio (SINR) that UEs receive, and hence the air-to-ground link capacity changes depending on theaBS
positions. The propagation channel model from air to ground differs from conventional ground channels, and it is based on the LoS likelihood betweenaBSs and users, as we detail next.
B. Path-loss and Interference
The conditions for the BS-UE access channels differ much depending whether users attach to agBS or anaBS. While the ground attenuation forgBS-UE links follows conventional
path-loss models based on slow and fast fading, aBS-UE channels suffer additional attenuation depending on the LoS state, referred in the literature as anexcess attenuation [16].
The LoS-likelihood is a complex function of the elevation angle between useru∈ U andaBS a∈ A:
PLoS(a, u) = 1 +β1·e −β2
180
π arctan
ha ra,u
−β1
!−1 , (1)
where ha is the height of a, and β1 and β2 depend on the
number of obstructions per unit area, buildings height, etc., as shown in [12], based on ITU recommendations [17]. In Eq. (1),
arctan(ha/ra,u)is the elevation angle, derived from theaBS height ha and the distance between user u and the ground projection of dronea,ra,u=k(Xa,Ya)−πuk. Safety, legislation and technology restrict drones to fly only at few hundreds of meters, so the ground distance has the same order as the drone height. Thus, the LoS varies sensibly with user and drone positions, and affect air-to-ground channel conditions.
The higher a drone hovers, the more likely it is to have LoS. However, the signal also attenuates with the distance and, in multi-aBS scenarios as we discuss in this paper, interference from otheraBSs is an important parameter to consider. Thus, optimal drone hovering altitude depends on all aBSs.
As obtained in [12], the average attenuation (in dB units) of an air-to-ground channel is based on the LoS likelihood from Eq. (1). Hence, for all dronea∈ Aand useru∈ U:
LA(a, u) = 20 log10
4πfA
c · q
h2 a+r2a,u
+
+ PLoS(a, u)·(ξLoS−ξNLoS) +ξNLoS, (2)
where ξLoS, ξNLoS are the excess attenuation components discussed above in LoS and NLoS conditions respectively,fA
is the carrier band in Hz andc is the speed of light in m/s. GroundgBS-UE links experience an attenuation based on the well known path-loss model with slow fading (in dB units):
LG(g, u) = 10ηGlog10
4πf
G
c · kΠ
g −πuk
+N(0, σ2G), (3)
whereηG>2is the ground path-loss exponent,fGis the carrier
band in Hz, andσG is the standard deviation of the gaussian
variableN(0, σ2
G), modelling the effects of shadowing.
To measure the network capacity, we consider that the BSs serve ground users with the rate corresponding to the Shannon capacity, according to the SINR of the link. The bands used by
gBSs andaBSs have bandwidth ofWGandWA, respectively.
With the above, SINRs for links(g, u)and(a, u)are:
γg,uG =
PT xg ·10−LG(g,u)/10
Ng,u+Ig,uG
, γa,uA =
Pa
T x·10−LA(a,u)/10
Na,u+Ia,uA
, (4)
where PT xg and P a
T x are the transmission power of the BSs
g ∈ G and a∈ A, respectively, Ng,u and Na,u represent thermal noise, andIG
g,u andI
A
a,u are interferences that useru suffers from gBSs or aBSs, respectively. While for ground connections the position of the interfering gBS in G \{g} is fixed and known so that the interference IG
g,u is a constant value,1 the 3-D position of an aBS is variable and directly
affects the interfering signals received by useru, i.e.: Ia,uA =
X
a′∈A\{a}
PT xa ·10−LA(a ′
,u)/10,
∀a∈ A. (5)
C. Cell Selection and Resource Allocation
BSs cannot provide service to unlimited users. Hence, we assume that eachgBS oraBScan serveUmaxusers at most.
Users perform cell selection as in LTE networks, before the optimization: first, UEs select the BS with strongest Signal-to-Noise Ratio (SNR); if the link request is rejected, then the UE performs cell re-selection, and tries to attach to the BS with next strongest SNR observed, until the user gets attached. We denote thegBSto which useruattaches asgu. This best-SNR policy is the one currently adopted in LTE networks [18].
We assume that gBSs and aBSs schedule users using an OFDMA system (like in LTE). BSs have a finite set of physical resource blocks (PRB)—the smallest unit of time-frequency resources—organized in subframes. Thus, the minimum band-width allocated to a user is the bandband-width of one PRB per frame. We denote asWmin
G andW
min
A the minimum bandwidth
that a gBS or anaBS can allocate to a single user.
IV. OPTIMAL FAIR THROUGHPUT BY DRONE POSITIONING
Here we derive an analytic framework for the 3-D positions of aBSs, to optimize throughputs based on α-fairness. De-pending on the value ofα≥0—the fairness level—we capture different fairness criterias such as proportional fairness (α= 1),
max-minfairness (α→+∞) or the maximum capacity (α= 0). Denoting by Tb,u the access link throughput between BS
b∈ B=G ∪Aand useru∈ U, we have the following utility:
Uthrα =
1 1−α·
P
u∈U
P
b∈B
Tb,u
1−α
, α6= 1;
P
u∈U
log
P
b∈B
Tb,u
, α= 1.
(6)
Throughput ProblemT:GivenG gBSs,A aBSs hovering at heights in the range[hmin, hmax],U UEs that may connect
to either agBSor anaBSs, each of which servesUmaxUEs
at most, and a backhaul capacityτa, find the optimal position of aBSs, optimal user association, and the optimal user re-source allocation so to maximize theα-fair throughput utility.
We denote as Ca,u and Cugu the binary decision variables that tell whetheru∈ Uconnects toa∈ AorgBS gu. Variables
Tb,uandWb,udenote the throughput and bandwidth allocated to access link(b, u). The resulting optimization program is:
maxCa,u, Cgu
u,Πa, Tb,u, Wb,u U α thr
Cgu
u +Pa∈ACa,u= 1, ∀u∈ U;
Tgu,u=Wgu,u·log2 1 +γgGu,u
, ∀u∈ U; WGmin·Cugu ≤Wgu,u≤WG·Cugu ∀u∈ U;
P
u∈UWg,u≤WG; ∀g∈ G;
Ta,u=Wa,u·log2 1 +γ A
a,u
, ∀a∈ A,∀u∈ U; WAmin·Ca,u≤Wa,u≤WA·Ca,u, ∀a∈ A,∀u∈ U;
P
u∈UWa,u≤WA, ∀a∈ A;
P
u∈UTa,u≤τa, ∀a∈ A;
P
u∈U,g=gu Cg
u≤Umax, P u∈U
Ca,u≤Umax, ∀g∈ G,∀a∈ A;
(Xa, Ya, ha)∈ Sa, hmin≤ha≤hmax, ∀a∈ A.
(7)
The first constraint states that each u∈ U connects only to one BS. The second constraint gets the throughput allocated to
gBSs. The third and fourth constraints get the bandwidth al-located to each user ofgBSs, with minimum guarantees. The fifth constraint gets the air-to-ground link rates, and the sixth and seventh constraints get the bandwidth allocated byaBSs,
with minimum guarantees. The eighth and ninth constraints limit the aggregate transmission rate ofaBSs to their backhaul capacity, and the maximum allowed served users by each BS, respectively. The last constraint delimits the 3-D space within a ballSa centered on the current position of the drone.
The formulated problem is mixed-integer and non-convex, hence not tractable with currently available optimizers. Note in fact that air-to-ground links bring unavoidable non-convex functions. Finding the optimal drone positions is an NP-Complete problem. Indeed, the NP-NP-Complete Minimum-Geometric Disk-Cover (MGDC) problem [19] can be reduced, in polynomial time, to a special instance of the problem where users get 1 bps if a drone serves them and 0 bps otherwise. We omit the details due to lack of space.
V. PARTIALLY-DISTRIBUTEDEXTREMALOPTIMIZATION
ProblemT is hard to solve since any change in a decision variable affects association and resource allocation of all users. This is the kind of problems EO has been thought for. Hence, in order to find time-efficient and near-optimal solutions, we propose EOA, a partially-distributed EO algorithm. PD-EOA is based on the three decisions that the framework makes:
(i)3-DaBSpositions;(ii)sets of UEs attached to eachgBS
andaBS; and (iii)bandwidth allocation from each gBS or
aBS to their attached UEs. PD-EOA iteratively solves these three steps: step (i) is solved centrally with EO, step (ii)
is solved independently by users, and step (iii)is optimally solveddistributedly by eachgBS andaBS, as detailed next. The pseudocode of PD-EOA is shown in Algorithm 1. The algorithm starts from an initial random feasible implemen-tation of the system. Let Ug and Ua be the sets of users attached to gBS g and aBS a, respectively. We can split the utility into a utility provided by gBSs Uα
G(Ug) and by
aBSs (Uα
A(Ua)). The aBS that provides theworst utility is
aw= arg mina∈AUAα(Ua), referred as the “least fit”aBS. At each iteration, PD-EOA identifies and moves the least fit aBS to a position where the system utility increases the most (step(i)). To this end, the algorithm explores candidate positions within a ballSa and only considers the points of a 3-D lattice that spans equal-volume subspaces.
User attachment (step (ii)) is based on SNR, so it is performed by users and BSs distributedly: each user requests connection to the BS that offers the best SNR. If accepted, it is associated to the BS, otherwise it requests association to the BS with the next-in-list best SNR.
Finally, since BS utilities are additive, eachgBS andaBS
can address the bandwidth allocation optimally on its own (step(iii)). Specifically, given a BSb∈ B=G∪Aand its po-sition, the set of attached usersUb, and the spectral efficiency of users computed with the Shannon formula, we obtain the following Convex Program (CP) for resource allocation:
maxwu
1 1−α·
P
u∈Ub
WV·wu·log2(1 +γVb,u)
1−α ; P
u∈Ubwu= 1;
wu≥WVmin/WV, ∀u∈ Ub;
(8)
TABLE I: OPTIMAL SOLUTION FOR THECONVEXPROGRAM(8)
α= 0;
wu=
Wmin
V /WV, u6= arg maxv∈Ubθv;
1−(|Ub|−1)·WVmin/WV, u= arg maxv∈Ubθv;
α∈]0,1[; α= 1;
wu= θ 1/α−1
u
P
v∈Ubθv, ∀u∈ Ub; wu=
1
|Ub|, ∀u∈ Ub; α→+∞;
wu=
(
Wmin
V /WV, ifu /∈ J; 1−(|Ub|−|J |)·WVmin/WV
θu·Pv∈J1/θv , ifu∈ J.
Algorithm 1 PD-EOA
Require: Lattice L, fleetA, usersU, and Signal parameters.
1: Randomly place allaatΠa∈ L. DefineΠ ={Πa} a∈A. 2: Obtain setUb(Π)of users that connect to eachb∈ B.
3: UBα(Ub(Π))←optimalα-utility of eachb∈ Bfrom CP (8).
4: Selecta0= arg mina∈A{UBα(Ub(Π))}.
5: TakeΠa0 = arg max
π∈L{Uthrα } and place a0atΠa0. 6: Go back to step 2 until:
• No better position is found foraBS a0.
• Maximum number of iterationsκis reached.
CP (8) is convex when α∈ [0,1[, α→1 or α→+∞, which are the cases of interest of this paper. Thus, we derive KKT conditions [20] and find a closed-form solution. The KKT approach is well-known and extensively studied. Thus, we directly show the solution in Table I, where computingJ when α→+∞ takes linear time with respect to |Ub|, and is equal to J ={u∈ Ub | wu·θu= minv∈Ubwv·θv}.
PD-EOA is fast and requires few iterations. We have per-formed all the optimizations reported in less than 1 second on a personal computer. Thus, PD-EOA suits for on-demand op-timization to dynamically reposition drones to adapt to user’s movements over time. The complexity is O(|L| ·Umax).
VI. NUMERICALSIMULATIONS
Here we show numerical simulations of the proposed frame-work in static and dynamic cases over the real topology of a dense city covered by 10 gBSs, serving 1000 users. We validate PD-EOA in comparison with optimal results approxi-mated with Monte-Carlo (MC) simulations in small networks and study three significative static and dynamic scenarios:
• PPP: We place UEs through a Poisson point process. • Stadium: we statically place 60% of the UEs in the
surroundings of a stadium, and the rest like in PPP.
• Event: 40% of the UEs move according to the random
way-point model. Rest of UEs arrive at an official sched-uled rate of a train station and move towards the stadium. We study drones placement, throughput and system fairness and show results for three cases: (i) for α= 0, we get the maximum throughput (MaxThr), (ii) for α = 1, we optimize proportional fairness (PropFair), and (iii) for
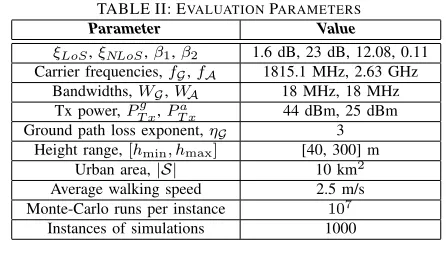
α→+∞, we optimize the max-minfairness (MaxMin). We use these α-values also for the ground network in absence of drones (Ground) and to compare PD-EOA to a state-of-the-art proposal: the Repulsion-Attractionscheme (RA) [15]. Error bars in the figures are 95% confidence intervals. Table II gathers the used parameters. We use MATLAB R2018a to simulate channel conditions and optimize aBS positions.
TABLE II: EVALUATIONPARAMETERS
Parameter Value
ξLoS,ξNLoS,β1,β2 1.6 dB, 23 dB, 12.08, 0.11 Carrier frequencies,fG,fA 1815.1 MHz, 2.63 GHz
Bandwidths,WG,WA 18 MHz, 18 MHz Tx power,PT xg ,Pa
T x 44 dBm, 25 dBm
Ground path loss exponent,ηG 3 Height range,[hmin, hmax] [40, 300] m
Urban area,|S| 10 km2
Average walking speed 2.5 m/s Monte-Carlo runs per instance 107
Instances of simulations 1000
A. Validation of PD-EOA operation
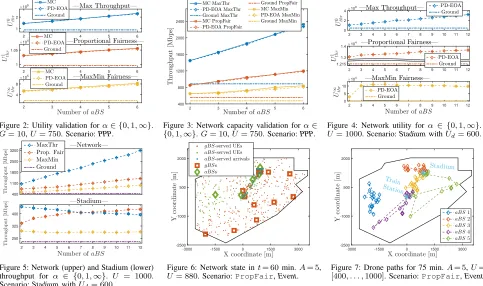
We compare PD-EOA and optima in thePPPcase. Figure 2 shows that utilities from PD-EOA and MC only differ by1%. Similarly, Figure 3 shows that throughput is like in the optimal case. Fairness, not shown here for lack of space, is near-optimal as well. The figures also unveil that utility grows lin-early with the fleet size, and the gain can be significantly large. Utility and throughput increase with the fleet size because more capacity, connectivity and placement options appear, despite the interference.MaxThris always unfair (Jain’s index is below 0.05) because it allocates one resource block to each user and the rest of resources to users with best channels. Coversly, PropFair and MaxMinprovide less throughput, but compensate with higher fairness, above 0.65 and 0.95 (not shown due to lack of space). Placing drones withPropFair orMaxMindoes not hurt fairness, yet only a limited number of users benefit from them, which may generate undesired behaviors. The gain with respect to Ground is remarkable, and confirms that drone relays have huge potentials.
B. Performance evaluation in the static Stadium case
TheStadiumcase described here studies the network when people gather in dense spots. Here, 60% of users are in a stadium: 600 UEs, which is a typical case of users allocated over the same LTE band by the same operator (i.e., we take a stadium of 12000 seats, 4 operators, 3 LTE bands, and 60% of the attendance connected).
2 3 4 5 6
U
0 th
r
×109
1 2
—Max Throughput—
MC PD-EOA Ground
2 3 4 5 6
U
1 th
r
×104
1 1.05
—Proportional Fairness—
MC PD-EOA Ground
Number ofaBS
2 3 4 5 6
U
∞ th
r
×105
4 8
—MaxMin Fairness—
MC PD-EOA Ground
Figure 2: Utility validation forα∈ {0,1,∞}.
G= 10,U= 750. Scenario:PPP.
Figure 3: Network capacity validation forα∈ {0,1,∞}.G= 10,U= 750. Scenario:PPP.
Figure 4: Network utility forα ∈ {0,1,∞}.
U= 1000. Scenario:StadiumwithUd= 600.
T
h
ro
u
g
h
p
u
t
[M
b
p
s]
400 1100 1800 2500 3200
—Network—
Number ofaBS
2 3 4 5 6 7 8 9 10 11 12
T
h
ro
u
g
h
p
u
t
[M
b
p
s]
250 325 400
—Stadium—
MaxThr Prop. Fair MaxMin Ground
Figure 5: Network (upper) and Stadium (lower) throughput for α ∈ {0,1,∞}. U = 1000. Scenario:StadiumwithUd= 600.
X coordinate [m]
-3000 -1500 0 1500 3000
Y
co
or
d
in
at
e
[m
]
-2500 -1000 500 2000
gBS-served UEs
aBS-served UEs
aBS-served arrivals
gBSs
aBSs
Figure 6: Network state int= 60min.A= 5,
U= 880. Scenario:PropFair,Event.
X coordinate [m]
-3000 -1500 0 1500 3000
Y
co
or
d
in
at
e
[m
]
-2500 -1000 500 2000
Train Station
Stadium
aBS1
aBS2
aBS3
aBS4
aBS5
Figure 7: Drone paths for 75 min.A= 5,U= [400, . . . ,1000]. Scenario:PropFair,Event.
This evaluation tells that aBSs are beneficial to help the ground network in dense spots, except they cannot purely maximize throughput. They cannot either “rescue” all users with bad channel conditions, but can always provide fairness.
C. Performance evaluation in a dynamic event case
In this scenario, masses of 40 users arrive to the train station every 5 minutes. The initial population is 400 users and grows during 75 minutes up to 1000 users. There are 5aBSs
hovering the area. Upon a train arrival, users walk towards the stadium, located 1.5 km away. We usePropFairto compute drone positions, since it conveys a good tradeoff of throughput and fairness. Drones reposition every 5 minutes with PD-EOA. As time passes by, e.g., after 30 min. of train arrivals, some people have reached the stadium, while many others keep walking towards it. At this point, the fleet is ready to serve the users by the stadium and also the smaller masses of people that are by the train station or on their way to the event. After one hour, drones have repositioned, as shown in Figure 6, where the mass at the stadium is much denser and more drones come to assist the users by the stadium. The trajectories of drones over 75 minutes are shown in Figure 7: the network tracks users and dispatches drones accordingly.aBS1 is not required to assist the dense spot;aBSs 2 and 3 keep moving back and forth between the train station and the stadium; and aBSs 4 and 5 move within different regions, to fairly supply the users. Figures 8–10 illustrate performance over time. We compare PD-EOA to the RA scheme proposed in [15], in whichaBSs are attracted by UE’s inverse SNR, and repulsed by proximity to gBSs to avoid interference. The figures only consider performance of users arriving over time (i.e., the attendance). As the attendance increases, we observe in Figure 8 a utility raise with MaxThr and PropFair, since both are oppor-tunistic schemes. With MaxThr, the gain of PD-EOA over RA andGroundis high, although it saturates quickly. Instead,
withPropFair, PD-EOA exhibits a smoother behavior, as its gain keeps increasing. In contrast, withMaxMinwe observe a decay of performance over time, since the higher the number of users, the lower the minimum achieved rate.
In all cases, the aggregated throughput increases for all schemes andα-values, as shown in Figure 9.PropFair ex-hibits a similar—slightly better in most of the cases—increase than MaxThr. However, the attendance grows linearly over time, while the throughput does not. This occurs because a fixed number of drones cannot serve unlimited users. Clearly, the RA scheme is not able to opportunistically take advantage of user’s diversity and improve utility because it does not target a throughput-based metric. In contrast,PropFair with PD-EOA provides better throughput and fairness guarantees.
Finally, Figure 10 shows the fairness achieved over time by the attendance. PD-EOA with PropFair and MaxMin provide better fairness, with values over 0.63 in all cases. In particular, with a proportionally-fair resource allocation, PD-EOA can provide up to a 20% more fairness than RA.
VII. LESSONS LEARNT AND DISCUSSION
Our results show the importance of integrating a fleet of drone relay stations in a cellular network. They also unveil that optimizing drone positions to boost throughput, without con-sidering fairness, has little relevance in presence of dense spots of ground users. In contrast, a fair metric like PropFair provides relevant throughput improvement opportunities and achieves fair behaviors. Other metrics likeMaxMinare useful for cases not addressed in this paper, e.g., to bring minimal communications in case of temporary loss of infrastructure.
15 30 45 60 75
U
0 th
r
×108
0
5 —Max Throughput—
PD-EOA RA [15] Ground
15 30 45 60 75
U
1 th
r
0 5000
10000 —Proportional Fairness—
PD-EOA RA [15] Ground
Time [min]
15 30 45 60 75
U
∞ th
r
×105
0 5 10
—MaxMin Fairness— PD-EOA RA [15] Ground
Figure 8: Attendance utility forα∈ {0,1,∞}.
A= 5,U= [400, . . . ,1000]. Scenario:Event.
Figure 9: Attendance capacity forα∈ {0,1,∞}.
A= 5,U= [400, . . . ,1000]. Scenario:Event.
Figure 10: Attendance fairness forα∈ {0,1,∞}.
A= 5,U= [400, . . . ,1000]. Scenario:Event.
optimal positions for a fixedα, which states the fairness degree in the network. Since PD-EOA is fast, it is possible to design an almost continuous repositioning in realistic networks.
The actual implementation of PD-EOA needs further work. It is clear that it requires exchanging signaling information be-tween drones and a centralized orchestrator, and implementing a mechanism to track users. Signaling (out of the scope of this paper) incurs some overhead, depending on the frequency of reconfigurations, to gather positions and instruct drones.
Another constraint that might hinder the performance of drone relays is the backhaul capacity, i.e., the bandwidth that drones can use to accommodate the demand of users towards the core of the network. There are promising technologies to avoid bottlenecks on such backhaul, e.g., based on mmWave in 5G [21]. This is left for future work, yet our study already analytically accounts for backhaul bandwidth constraints.
Regarding drone mechanicals, commercial drones can carry small BSs, although they can fly for short time due to battery limitations (∼30 min.). They can move at speeds of 15 m/s, so it is possible to derive a repositioning scheme that replaces drones that recharge on dedicated charging stations. For the case of Section VI-C, the routes flown by drones are short enough, and they can hover a city district in few minutes. Thus, notwithstanding the intricacies of the analysis, the performance evaluation discussed is relevant for realistic systems.
VIII. CONCLUSIONS
In this paper we have proposed an analytic framework to optimize drone-aided cellular networks in terms of an α-fair throughput utility function under realistic stochastic models. Specifically, we have studied the integration of a coordinated fleet ofaerial base stationsto complement the service offered by ground base stations. Due to the complexity of the studied problem, we resorted to a heuristic, and so designed PD-EOA, a partially distributed algorithm based on extremal optimiza-tion. PD-EOA performs near-optimally in polynomial time, which makes it suitable for implementation in dynamically changing environments. The performance evaluation presented shows that PD-EOA brings significant gain and outperforms existing approaches. It also unveils that using fairness is key to get benefit from coordinated yet interfering drone relays.
ACKNOWLEDGMENTS
The work of E. Arribas is partially supported by the FPU15/02051 grant from the Spanish Ministry of Education, Culture and Sports (MECD). The work of V. Mancuso is supported by the Ram´on y Cajal grant (ref: RYC-2014-16285)
from the Spanish Ministry of Economy and Competitiveness and by the DiscoEdge grant (TIN2017-88749-R) from the Spanish Ministry of Science, Innovation and Universities.
REFERENCES
[1] W. Mohr, “5G empowering vertical industries,” Tech. Rep., April 2016. [2] M. Maternia et al., “5G PPP use cases and performance evaluation
models,” 5G-PPP, Tech. Rep., Apr. 2016, White Paper.
[3] C. Liu, K. Sundaresan, M. Jiang, S. Rangarajan, and G. Chang, “The case for re-configurable backhaul in cloud-RAN based small cell net-works,” inIEEE INFOCOM, 2013.
[4] W. Guo, C. Devine, and S. Wang, “Performance analysis of micro unmanned airborne communication relays for cellular networks,” in
IEEE CSNDSP. IEEE, 2014.
[5] W. Guo and T. O’Farrell, “Relay deployment in cellular networks: Planning and optimization,”IEEE JSAC, vol. 31, no. 8, 2013. [6] M. Mozaffari, W. Saad, M. Bennis, and M. Debbah, “Wireless
com-munication using unmanned aerial vehicles (UAVs): Optimal transport theory for hover time optimization,” IEEE Transactions on Wireless Communications, vol. 16, no. 12, pp. 8052–8066, 2017.
[7] L. Buzna and R. Carvalho, “Controlling congestion on complex net-works: fairness, efficiency and network structure,” Scientific reports, vol. 7, no. 1, p. 9152, 2017.
[8] S. Boettcher and A. Percus, “Optimization with extremal dynamics,”
Phys. Rev. Lett., vol. 86, pp. 5211–5214, 2001.
[9] R. Ferr´us, H. Koumaras, O. Sallent, G. Agapiou, T. Rasheed, M.-A. Kourtis, C. Boustie, P. G´elard, and T. Ahmed, “SDN/NFV-enabled satel-lite communications networks: Opportunities, scenarios and challenges,”
Physical Communication, vol. 18, pp. 95–112, 2016.
[10] S. Katikala, “Google™project loon,”InSight: Rivier Academic Journal, vol. 10, no. 2, pp. 1–6, 2014.
[11] E. Arribas and V. Mancuso, “Multi-path D2D leads to satisfaction,” in
IEEE 18th International Symposium on A World of Wireless, Mobile and Multimedia Networks (WoWMoM). IEEE, 2017, pp. 1–7.
[12] A. Al-Hourani, S. Kandeepan, and S. Lardner, “Optimal LAP altitude for maximum coverage,”IEEE Wireless Communications Letters, vol. 3, no. 6, pp. 569–572, 2014.
[13] A. Hayajneh, S. Zaidi, D. McLernon, and M. Ghogho, “Optimal dimensioning and performance analysis of drone-based wireless com-munications,” inGC Wkshps. IEEE, 2016.
[14] M. Mozaffari, W. Saad, M. Bennis, and M. Debbah, “Optimal transport theory for power-efficient deployment of unmanned aerial vehicles,” in
IEEE ICC 2016, 2016.
[15] O. Andryeyev and A. Mitschele-Thiel, “Increasing the cellular network capacity using self-organized aerial base stations,” inDroNet. ACM, 2017, pp. 37–42.
[16] A. Al-Hourani, S. Kandeepan, and A. Jamalipour, “Modeling air-to-ground path loss for low altitude platforms in urban environments,” in
GLOBECOM. IEEE, 2014, pp. 2898–2904.
[17] ITU-R Recommendations, “Propagation data and prediction methods required for the design of terrestrial line-of-sight systems,”ITU-R, 2015. [18] S. Sesia, M. Baker, and I. Toufik,LTE-the UMTS long term evolution:
from theory to practice. John Wiley & Sons, 2011.
[19] G. Das, R. Fraser, A. L´oopez-Ortiz, and B. Nickerson, “On the dis-crete unit disk cover problem,”International Journal of Computational Geometry & Applications, vol. 22, no. 05, pp. 407–419, 2012. [20] H. W. Kuhn and A. W. Tucker, “Nonlinear programming,” inTraces and
emergence of nonlinear programming. Springer, 2014, pp. 247–258. [21] E. Kalantari, M. Z. Shakir, H. Yanikomeroglu, and A. Yongacoglu,
![Figure 8: Attendance utility for α∈{0, 1, ∞}.A=5, U =[400, . . . , 1000]. Scenario: Event.Figure 9: Attendance capacity for α ∈ {0, 1, ∞}.A=5, U =[400,](https://thumb-us.123doks.com/thumbv2/123dok_us/1107331.1611775/6.612.61.539.37.153/figure-attendance-utility-scenario-event-figure-attendance-capacity.webp)