RVC OPEN ACCESS REPOSITORY – COPYRIGHT NOTICE
This is the peer reviewed, manuscript version of the following article:
Kinnison, T., S. A. May and D. Guile (2015). "Veterinary team interactions, part one: the practice effect." Veterinary Record 177(16): 419.
Which has been published in final form at http://dx.doi.org/10.1136/vr.103312. The final article is © 2015, BMJ Publishing Group.
The full details of the published version of the article are as follows:
TITLE: Veterinary team interactions, part one: the practice effect AUTHORS: T. Kinnison, S. A. May, D. Guile
JOURNAL TITLE: Veterinary Record VOLUME/EDITION: 177/16
1 Veterinary Team Interactions Part One: The Practice Effect
Tierney Kinnison, BSc, MSc
The Royal Veterinary College, Hawkshead Lane, Hatfield, Hertfordshire, AL9 7TA [email protected]
Stephen A May, MA VetMB PhD DVR DEO FRCVS DipECVS FHEA
The Royal Veterinary College, Hawkshead Lane, Hatfield, Hertfordshire, AL9 7TA David Guile, Post-Graduate Teaching Certificate, MA, BA, PhD
The Institute of Education, 20 Bedford Way, London, WC1H 0AL
Abstract
Veterinary practices have evolved since the era of solo practitioners working on one site. Today veterinary practices tend to include veterinary surgeons, veterinary nurses, receptionists and business managers, leading to the notion of the veterinary team and the rise of interprofessional working. In addition, practices have grown in size and frequently include several branches, creating a distributed team. Research regarding veterinary teamwork is lacking. This paper uses Social Network Analysis (SNA) to address this issue. SNA measures interactions between members of a network. The types of interactions in practice and the effects of practice size and location (branches) are
2 Introduction
The evolutionary change from the solo practitioner, when veterinarians were part of an emerging profession, to the team-based interprofessional veterinary practices of today has been significant. As veterinary surgeons began to treat increasing numbers of small animals, a niche opened for
assistants who would care for the animals while the veterinary surgeon specialised on the diagnostic process and choice of therapies. This new role has developed significantly over the last 50 years and, in the UK especially, has led to the highly trained veterinary nurse profession. It is likely that the relationship between the two professions will have changed, and will continue to do so. It is not only the veterinary surgeon - veterinary nurse working relationship that may evolve. Numerous other groups are now involved in day-to-day veterinary based work, including technicians, practice managers, receptionists, physiotherapists, farriers, equine dentists and more. The factors leading to a rise in veterinary interprofessional working, and the resulting potential for evolving relationships between the groups, has been described in more detail by the authors elsewhere (Kinnison and others 2014).
In addition to team composition changes, the owner of the practice is also changing. Sole principals and partnerships have slightly declined from 2006 to 2010 and limited corporations and corporate concerns have increased (Robertson-Smith and others 2010). It is anticipated that the trend has continued since 2010. Veterinary practices are also expanding with, for example, the mean number of veterinary surgeons per practice increasing from 3.0 in 2006 (Robertson-Smith and others 2010), to 7.1 in 2014 (Buzzeo and others 2014). These trends may explain the rise in teams spread across multiple branches.
3 In order for the proposed advantages of teamwork to be achieved, however, a veterinary practice must work as a unified team. This can be challenging, as a group of professionals with individual competence does not necessarily equate to group competence (Lingard 2009). The increase in interprofessional working has therefore not come without challenges. Each group is part of the ‘jostle for jurisdiction’ (Bechky 2003), experiencing a struggle as a collective to find their place in the world. This involves the emergence of roles and responsibilities which other members of the team can respect and trust members to undertake. Where there is confusion or great overlap in roles, insecurity and the potential for difficulties in working arise (Baxter and Brumfitt 2008). Teamwork undeniably requires communication. Team communication is a well-researched topic which has suggested links to medical errors (Lingard and others 2004; Kobayashi and others 2006; Alvarez and Coiera 2006). Different professions have different discourses and ingrained boundaries which evolve in part due to separation of training (Baxter and Brumfitt 2008), and necessitate the creation of a collaborative interprofessional discourse (Barr and others 2005).
In order to understand, and eventually improve, veterinary team working, a method is required to enable the consideration of team behaviour. Social Network Analysis (SNA) is suggested to be one such novel framework. SNA is an examination of a group, such as a veterinary practice, and is concerned with the interactions between individuals, rather than the study of individuals acting independently (Wasserman & Faust, 1994, p17). A frequent focus of SNA is on resource flow, such as information or advice. The flow of resources enables individuals to work successfully as a team and to build greater joint understanding with the consequent benefits of teamwork as identified previously. SNA has not been used to assess veterinary teamwork; however, there are examples from healthcare which have guided this paper’s hypotheses and methodology.
SNA has been used to identify different types of interactions which have different levels of occurrence, or density. For example, within a hospital, interactions can include asking for advice, changing habits and sharing thoughts; these interactions have been suggested to increase in difficulty due to their decreasing densities (Wagter and others 2012). The first hypothesis of this paper is: different levels of interaction have different densities in veterinary practices.
4 multiple practice branches. The second hypothesis of this paper is: interactions will be affected by practice size (Hypothesis 2a) and team locations (Hypothesis 2b).
The present paper aims to add to the literature regarding working and learning within
(interprofessional) veterinary teams and arises from a large scale study. This paper focuses on the overarching analysis of the interactions within practices (Hypothesis 1) and includes analysis of the practice effects of size and physical proximity on the interactions (Hypothesis 2a and 2b). These factors are increasingly important considerations as practices expand in terms of the number of individuals they employ, the number of branches they contain and whether they are independent or part of a corporate group. In a subsequent article, the personal effects (key individuals,
interprofessional relations and social factors) are the focus. Together the two articles aim to
formulate a map of veterinary interactions, providing a snapshot of teamwork in modern veterinary teams.
Methods
Participants
A total of 43 veterinary practices were approached to take part in the study between October 2013 and April 2014. All practices had a multiprofessional team composition identified via their website. The practices were purposively sampled based on their location (across England), species type (small animal, equine, mixed practice), size (<10 people, 10-40 people, >40 people) and business status (independent, corporate). A mix of these characteristics was chosen to provide a representation of practices. Eleven practices, which covered all practice types, took part in the study. All individuals identified as being employed by each of the practices were targeted in the research.
The SNA Questionnaire
The questionnaire consisted of a demographic section and a main section which asked participants to identify whether they did or did not have specific interactions with all other members of the practice team at the current point in time. The four interaction questions considered in this paper are shown in Table 1 below.
Table 1. The four interactions investigated in the SNA questionnaire.
5 2. When you feel unsure about something during your work in practice, who of the following
do you ask for advice, help, explanation?
3. Who of the following significantly influences your working habits, for example through observation of their work?
4. Who do you talk to about your work activities to develop new ideas or ways to solve problems?
The interactions were presented across the top of a table which contained a list of all members of the practice team down the left hand side in a sociocentric (whole network) roster format. Participants were asked to tick or cross each box within the table to identify their interactions. Participants were not directed to consider any one mode of interaction (face-to-face, telephone, email), all modes could be included.
The interactions were developed from published literature in healthcare (Cott 1997; Creswick and Westbrook 2010; Wagter and others 2012). The questionnaire was piloted with one typical veterinary practice (22 participants) and adaptations relating to presentation and wording were incorporated.
Distribution
Each practice was visited by the senior author (TK) to distribute the paper based questionnaires and answer any questions regarding the project. The team had been advised of the visit through posters or emails and were informed that it was for a PhD regarding the veterinary team. Those members of the practice team available during the visit completed the questionnaire. These initial response rates averaged 42.5%. The remaining unanswered questionnaires were left with a representative who organised their completion and return. Final details of the practices can be seen in the Results. Participation was voluntary as was explained within a consent paragraph on the questionnaire. Participants could opt out at any time. The project received ethics approval from the Royal Veterinary College’s Ethics and Welfare Committee, Ref: URN 2013 0086H.
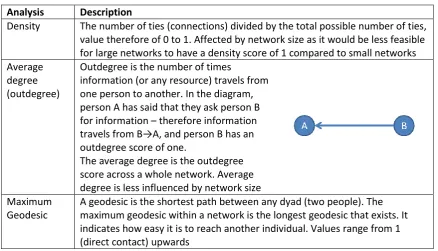
6 The first stage of analysis involved creating diagrams of the networks known as sociograms using NetDraw (Borgatti 2002). Sociograms are a tool for identifying patterns in the data. Further to this several SNA calculations were employed using the SNA programme UciNet (Borgatti and others 2001). As these are likely to be novel to many readers, they are explained in Table 2 below. Table 2. SNA statistics and explanations.
Analysis Description
Density The number of ties (connections) divided by the total possible number of ties, value therefore of 0 to 1. Affected by network size as it would be less feasible for large networks to have a density score of 1 compared to small networks Average
degree (outdegree)
Outdegree is the number of times
information (or any resource) travels from one person to another. In the diagram, person A has said that they ask person B for information – therefore information travels from B→A, and person B has an outdegree score of one.
The average degree is the outdegree score across a whole network. Average degree is less influenced by network size Maximum
Geodesic
A geodesic is the shortest path between any dyad (two people). The maximum geodesic within a network is the longest geodesic that exists. It indicates how easy it is to reach another individual. Values range from 1 (direct contact) upwards
Results
7
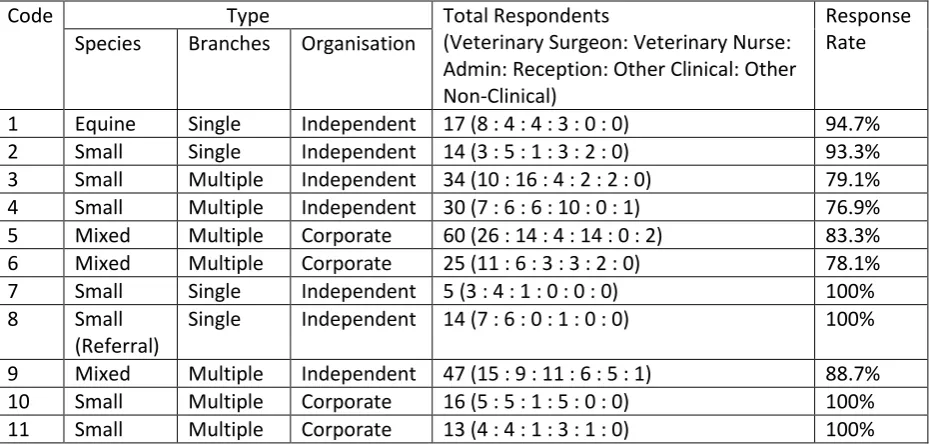
Code Type Total Respondents
(Veterinary Surgeon: Veterinary Nurse: Admin: Reception: Other Clinical: Other Non-Clinical)
Response Rate Species Branches Organisation
1 Equine Single Independent 17 (8 : 4 : 4 : 3 : 0 : 0) 94.7% 2 Small Single Independent 14 (3 : 5 : 1 : 3 : 2 : 0) 93.3% 3 Small Multiple Independent 34 (10 : 16 : 4 : 2 : 2 : 0) 79.1% 4 Small Multiple Independent 30 (7 : 6 : 6 : 10 : 0 : 1) 76.9% 5 Mixed Multiple Corporate 60 (26 : 14 : 4 : 14 : 0 : 2) 83.3% 6 Mixed Multiple Corporate 25 (11 : 6 : 3 : 3 : 2 : 0) 78.1%
7 Small Single Independent 5 (3 : 4 : 1 : 0 : 0 : 0) 100%
8 Small (Referral)
Single Independent 14 (7 : 6 : 0 : 1 : 0 : 0) 100% 9 Mixed Multiple Independent 47 (15 : 9 : 11 : 6 : 5 : 1) 88.7% 10 Small Multiple Corporate 16 (5 : 5 : 1 : 5 : 0 : 0) 100% 11 Small Multiple Corporate 13 (4 : 4 : 1 : 3 : 1 : 0) 100% Table 3: Participating Practices.
Hypothesis 1: Different levels of interaction have different densities in veterinary practices.
The four main interactions have different numbers of ties, densities and average degrees, known as cohesion scores. Table 4 demonstrates the average cohesion results for the participating practices. The Standard Deviation shows the difference between the practices, due largely to their size.
Table 4. Average scores of number of ties, density and average degree for the 11 practices according to interaction type. Standard Deviation (SD) is also reported
Number of Ties (SD) Density (SD) Average Degree (SD)
Information 515.09 (571.73) 0.58 (0.18) 13.69 (6.37)
Advice 353.45 (366.94) 0.47 (0.20) 10.07 (3.56)
Problem Solve 242.18 (252.01) 0.31 (0.13) 6.79 (2.34)
Influence Change 195.55 (192.52) 0.27 (0.13) 5.66 (1.70)
8 are influenced by any one individual. Clearly individuals differ in these scores and this is explored in the personal effects paper in this series.
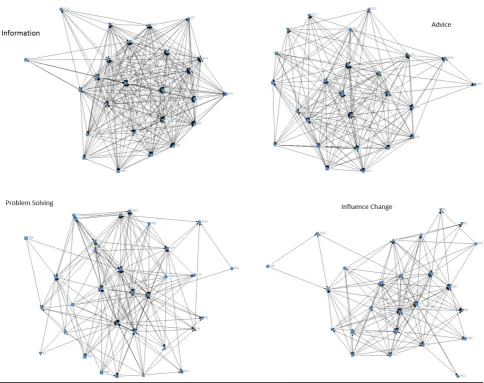
The pattern of densities across interactions can be clearly seen in sociograms. The sociograms of one practice (Code 6) are shown as an exemplar in Figure 1. Each dot is termed a node and represents a respondent. The nodes are shaped for the profession of the respondent. The lines are termed arcs and show the direction of the interaction.
Figure 1: Sociograms of the four main interactions for practice code 6. Node shape key: circle— veterinary surgeon, square—veterinary nurse, up triangle—office/administration, down triangle— receptionist, diamond—other clinical
Hypothesis 2a - Interactions will be affected by practice size.
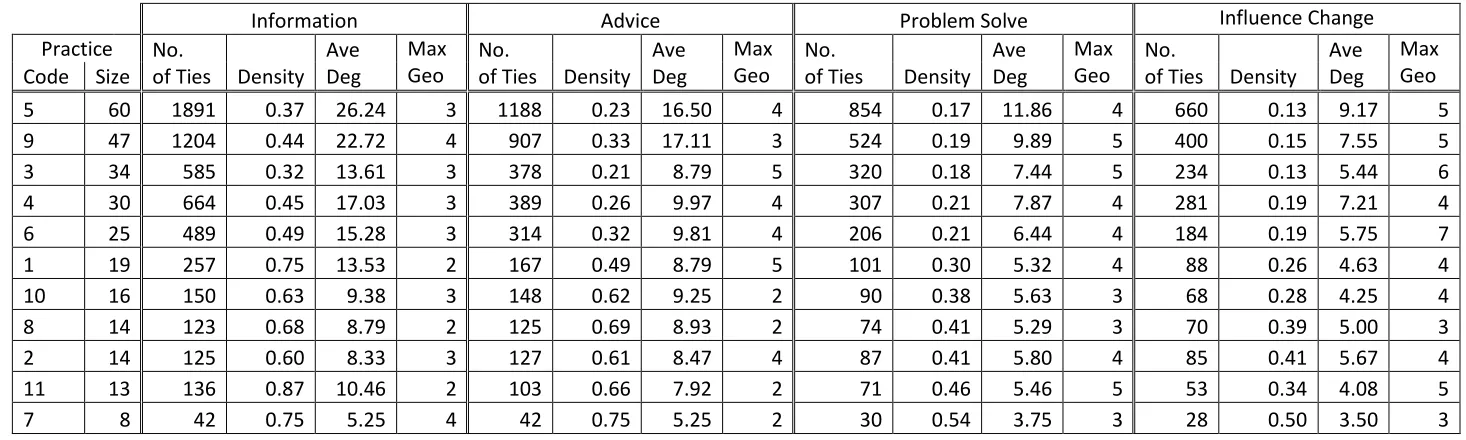
9 Table 5. Cohesion scores ranked according to practice size (largest to smallest). Ave Deg stands for Average Degree (outdegree). Max Geo stands for
maximum geodesic
Information Advice Problem Solve Influence Change
Practice No.
of Ties Density Ave Deg
Max Geo
No.
of Ties Density Ave Deg
Max Geo
No.
of Ties Density Ave Deg
Max Geo
No.
of Ties Density Ave Deg
Max Geo Code Size
5 60 1891 0.37 26.24 3 1188 0.23 16.50 4 854 0.17 11.86 4 660 0.13 9.17 5
9 47 1204 0.44 22.72 4 907 0.33 17.11 3 524 0.19 9.89 5 400 0.15 7.55 5
3 34 585 0.32 13.61 3 378 0.21 8.79 5 320 0.18 7.44 5 234 0.13 5.44 6
4 30 664 0.45 17.03 3 389 0.26 9.97 4 307 0.21 7.87 4 281 0.19 7.21 4
6 25 489 0.49 15.28 3 314 0.32 9.81 4 206 0.21 6.44 4 184 0.19 5.75 7
1 19 257 0.75 13.53 2 167 0.49 8.79 5 101 0.30 5.32 4 88 0.26 4.63 4
10 16 150 0.63 9.38 3 148 0.62 9.25 2 90 0.38 5.63 3 68 0.28 4.25 4
8 14 123 0.68 8.79 2 125 0.69 8.93 2 74 0.41 5.29 3 70 0.39 5.00 3
2 14 125 0.60 8.33 3 127 0.61 8.47 4 87 0.41 5.80 4 85 0.41 5.67 4
11 13 136 0.87 10.46 2 103 0.66 7.92 2 71 0.46 5.46 5 53 0.34 4.08 5
7 8 42 0.75 5.25 4 42 0.75 5.25 2 30 0.54 3.75 3 28 0.50 3.50 3
10 Hypothesis 2b - Interactions will be affected by team locations.
Four of the 11 practices were single site practices. All other practices had between two and five branches. In all cases there were identifiable main branches and satellite branches.
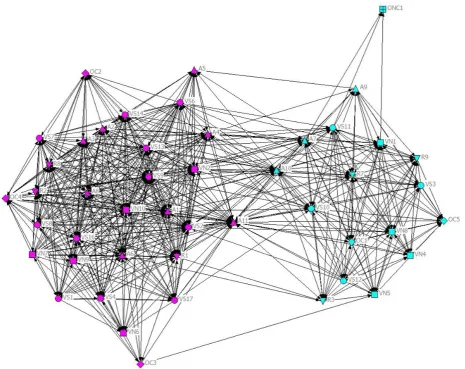
The sociograms of three practices (Codes 3, 4 and 9) highlighted a limited flow of resources between some of their branches. Interactions are therefore affected by the location of the team as suggested in Hypothesis 2b. The most extreme example was for Practice Code 9 which had two branches 13.9 miles apart. The sociogram for the advice interaction of Practice Code 9 is shown in Figure 2. The colour of the nodes depicts the branch the individual worked in.
Figure 2. The branch divide in asking for advice of Practice Code 9.
Discussion
11 advice could be considered more straightforward, lower order, interactions due to higher densities. Problem solving and being influenced by another’s actions could be considered more complex, higher order, interactions due to lower densities. Similar results have been previously identified in hospitals (Wagter and others 2012).
The size of the practice affects the interactions. The number of ties decreases with decreasing practice size. This is to be expected as within networks of fewer people, there are fewer
opportunities for ties. The density of ties increases with decreasing practice size. This is due to the fact that while the total number of ties decreases, the number of possible ties decreases further. A smaller network is therefore more connected than a larger network and resources flow more easily. Smaller teams have also been suggested to function better than larger teams in primary and
community care (Xyrichis and Lowton 2008). This is relevant for practices aiming to increasing in size. To explore the effect of team size in more depth, the average degree was calculated. It depicts the average number of respondents who identify each individual (outdegree). It can be used to compare networks as it should not be as affected by network size as other indices, as in any given
circumstance there is a limit to the number of people with whom you can interact. However the size of the participating practices falls below the value where it is possible to have interactions with everyone for some interactions. As practice Code 5 shows, it is possible to have an outdegree of over 26 for information. Several practices are smaller than this and therefore cannot have scores as high as Code 5. This makes comparing these networks challenging and is why average results are
provided. The problem solving and influence interactions demonstrate, however, that even when there is the opportunity for the smaller practices to have similar results to the larger practices, they do not; instead their average degrees remain smaller. Practice size appears therefore to have a genuine effect, for some interactions at least. Even when it is possible to maintain interactions with more people, participants in small practices do not. Instead, individuals choose with whom to interact . Understanding the reasons for these choices requires further research and is explored in Part Two of this series.
12 details on individual expertise, such as small animal surgery or computers, as well as some personal details. To share information, memos and emails may be useful; while to disseminate innovative ideas, targeting people with many connections would be most influential (West and others 1999; Anderson 2002).
It is important to note that a higher density does not unequivocally imply a ‘better’ transfer of resources. In high density networks there may be redundant ties whereby an individual is connected to two people who have the same information. Therefore the same information could be obtained by maintaining just one of those ties (Burt 1992). Hence, a network with a lower density may be more efficient and equally effective. Networks with low densities – but which include individuals who link separate subgroups – are therefore useful for the transfer of novel resources while networks with high densities are useful for maintaining group cultural norms and allow the same information to spread quickly (Adler and Kwon 2002). The density of information flow within the current veterinary practices (average 58%) and low maximum geodesics can be considered beneficial as the whole team is able to ‘work from the same page’. At the other extreme, the lower density of influencing behaviour fits with the density theory as only novel behaviours need to flow through the network, although the higher maximum geodesics suggest it may be unlikely a new behaviour will spread across the whole network quickly.
Physical proximity has been hypothesised as having an influence on interactions (Wagter and others 2012). In line with this, the current study demonstrated the effect of separate branches on overall practice integration. Some teams managed to interact across branches while others experienced ‘structural holes’ (Burt 1992) around the branches, indicated by fewer interactions and gaps in the sociograms. Reasons for this do not seem to be purely geographical. The most extreme example has only two branches relatively close together (Practice Code 9). The majority of individuals working within this practice do not work across branches. It could be suggested that there is a lack of
boundary spanners or brokers (Akkerman and Bakker 2011); people who are forced to, or choose to, work across a boundary (be it physical or cultural). This is an issue which is considered more
extensively in Part Two of this series regarding personal effects on interactions. Each branch may run very successfully independently, however, this potentially contradicts one of the proposed
advantages of the changing veterinary field - whereby corporates are replacing small scale private practices: that of gaining best practice through sharing experience across a wider network of
13 understanding differences and sharing best practice. Ultimately an ideal model of processes could be agreed upon, ensuring branch uniformity which regulates team roles and client experience.
This study aimed to create a map of interactions based on a representation of practices in England. This was achieved through the inclusion of pet and large animal practices, practices of different size and location and practices with different management structures. The small scale means that the study does not profess that the results are generalisable to every veterinary practice. It does however provide theoretical propositions (Yin 2009) suggesting that in similar situations, similar results can be anticipated.
SNA is an excellent methodology for mapping interactions within networks. It does however have some limitations. SNA using a roster format enforces a limit on the participants involved, in this case, practices’ ‘employees’. Although the questionnaire did ask for ‘extended team members’ from outside the practice, little data of these types were received. This may suggest limited activity outside of the practice, or a limitation of the questionnaire. Missing data have been suggested to have effects on SNA due to the nature of studying interactions. The authors compared the results of their statistics with missing data removed and included and noted no difference in the pattern of results. Further, response rates from all practices were comparable to other reports and were higher (minimum in this study of 76.9%) than the suggested acceptable rates of over 70% for many indices in an assessment of missing data by Kossinets (2006). This led the authors to include all available data in the analysis. This may however underestimate trends through the inclusion of individuals with missing ties. The results are also self-reported. While anonymity was assured, it is possible participants overestimated their interactions to portray their importance to the group. The similarity in overall patterns of interactions within practices and the clarity of the sociograms, however, suggests that these results are valid. Subsequent observational based SNA have been conducted by TK to assess the self-awareness of interactions and this has revealed that reported results were very similar to observed results (unpublished data). As suggested in previous SNA studies, the
14 regarding their future growth. Methods to maintain and improve interactions between team
members should be considered and involve a move from the informal to the formal, including team meetings, modes of information dissemination, rotation of staff and uniform practice protocols across branches (Greiner 1998). In the following paper in this series, the personal effects, including interprofessional interactions, are considered.
References
ABBOTT, A. (1988) The System of Professions: An Essay on the Division of Expert Labor. The University of Chicago Press.
ADLER, P.S. and KWON, S. (2002) SOCIAL CAPITAL : PROSPECTS FOR A NEW CONCEPT. Academy of
Management Review 27, 17–40.
ADLER, P.S., KWON, S.-W. and HECKSCHER, C. (2008) Perspective--Professional Work: The Emergence of Collaborative Community. Organization Science 19, 359–376.
AKKERMAN, S.F. and BAKKER, A. (2011) Boundary Crossing and Boundary Objects. Review of
Educational Research 81, 132–169.
ALVAREZ, G. and COIERA, E. (2006) Interdisciplinary communication: an uncharted source of medical error? Journal of critical care 21, 236–242.
ANDERSON, J.G. (2002) Evaluation in health informatics: social network analysis. Computers in
biology and medicine 32, 179–93.
BARR, H., KOPPEL, I., REEVES, S., HAMMICK, M. and FREETH, D. (2005) Effective Interprofessional Education: Argument, Assumption and Evidence. Blackwell Publishing Ltd.
BAXTER, S.K. and BRUMFITT, S.M. (2008) Professional differences in interprofessional working.
Journal of Interprofessional Care 22, 239–251.
BECHKY, B.A. (2003) Object Lessons : Workplace Artifacts as Representations of Occupational Jurisdiction. American Journal of Sociology 109, 720–752.
BORGATTI, S.., EVERETT, M.G. and FREEMAN, L.C. (2001) Ucinet 6 for Windows: Software for Social Network Analysis.
BORGATTI, S.P. (2002) Netdraw Network Visualization.
BURT, R.S. (1992) The social structure of competition. In Structural holes: The social structure of competition. Harvard University Press. pp 57–91.
15 COTT, C. (1997) “We decide, you carry it out”: a social network analysis of multidisciplinary
long-term care teams. Social science & medicine (1982) 45, 1411–21.
CRESWICK, N. and WESTBROOK, J.I. (2010) Social network analysis of medication advice-seeking interactions among staff in an Australian hospital. International journal of medical informatics
79, e116–25.
CROSS, R. and PARKER, A. (2004) The Hidden Power of Social Networks: Understanding How Work Really Gets Done in Organizations. Harvard Business School Press.
GETZ, M. (2012) Education and Earnings in the Health Professions. Journal of Veterinary Medical
Education 39, 247–256.
GREINER, L. (1998) Evolution and Revolution as Organizations Grow - Harvard Business Review.
Harvard Business Review 76, 55–68.
KINNISON, T., MAY, S.A. and GUILE, D. (2014) Inter-professional practice: from veterinarian to the veterinary team. Journal of veterinary medical education 41, 172–8.
KOBAYASHI, H., PIAN-SMITH, M., SATO, M., SAWA, R., TAKESHITA, T. and RAEMER, D. (2006) A cross-cultural survey of residents’ perceived barriers in questioning/challenging authority. Quality &
safety in health care 15, 277–83.
KOSSINETS, G. (2006) Effects of missing data in social networks. Social Networks 28, 247–268. LINGARD, L. (2009) What we see and don’t see when we look at “competence”: Notes on a god
term. Advances in Health Sciences Education 14, 625–628.
LINGARD, L., ESPIN, S., WHYTE, S, REGEHR, G., BAKER, G., REZNICK, R., BOHNEN, J., ORSER, B., DORAN, D. and GROBER, E. (2004) Communication failures in the operating room: an
observational classification of recurrent types and effects. Quality and Safety in Health Care 13, 330–334.
MULLINS, L.J. (2007) Management and Organisational Behaviour. Eighth Edi. Pearson Education Limited.
PATEL, V.L., CYTRYN, K.N., SHORTLIFFE, E.H. and SAFRAN, C. (2009) The Collaborative Health Care Team : The Role of Individual and Group Expertise. Teaching and Learning in Medicine 12, 37– 41.
ROBERTSON-SMITH, G., ROBINSON, D., HICKS, B., KHAMBHAITA, P. and HAYDAY, S. (2010) RCVS survey of the veterinary professions 2010. http://www.rcvs.org.uk/document-library/rcvs-survey-of-the-veterinary-professions-2010/.
TASSELLI, S. (2015) Social Networks and Inter-professional Knowledge Transfer: The Case of Healthcare Professionals. Organization Studies 36, 841–872.
TASSELLI, S. (2014) Social Networks of Professionals in Health Care Organizations: A Review. Medical
16 WAGTER, J.M., VAN DE BUNT, G., HONING, M., ECKENHAUSEN, M. and SCHERPBIER, A. (2012)
Informal interprofessional learning: visualizing the clinical workplace. Journal of
interprofessional care 26, 173–82.
WASSERMAN, S. and FAUST, K. (1994) Social Network Analysis: Methods and Applications. Cambridge University Press.
WEST, E., BARRON, D.N., DOWSETT, J. and NEWTON, J.N. (1999) Hierarchies and cliques in the social networks of health care professionals: implications for the design of dissemination strategies.
Social science & medicine (1982) 48, 633–46.
XYRICHIS, A. and LOWTON, K. (2008) What fosters or prevents interprofessional teamworking in primary and community care? A literature review. International journal of nursing studies 45, 140–153.