Processes and patterns of flow, erosion, and deposition at shipwreck
1
sites: a computational fluid dynamic simulation
2
3
4
R. Quinn1 and T.A.G. Smyth2
5
6
1 School of Geography and Environmental Sciences, Ulster University, Coleraine BT52 1SA,
7
8
Northern Ireland, [email protected] (author for correspondence)2 Department of Geography and Environmental Science, Liverpool Hope University, Hope Park, Liverpool, L16 9JD, United Kingdom.
9
10
11
Keywords
12
Computational fluid dynamics; shipwreck; fluid flow; site formation processes;
13
hydrodynamics; scour; deposition
14
15
Abstract
16
17
Shipwreck sites are open systems, allowing the exchange of material and energy across
18
system boundaries. Physical processes dominate site formation at fully submerged wreck
19
sites, and in turn influence chemical and biological processes at many stages of site
20
formation. Scouring presents a fundamental yet poorly understood threat to wreck sites,
21
and the processes and patterns of erosion and deposition of sediments and artefacts at
22
wreck sites are poorly understood. Laboratory and field based experiments to study these
23
phenomena are time-consuming and expensive. In this study open-source computational
24
fluid dynamic (CFD) simulations are used to model the processes and patterns of flow,
25
erosion, and deposition at fully submerged wreck sites. Simulations successfully capture
26
changes in the flow regime in the environment of the wreck as a function of incidence angle,
27
including flow contraction, the generation of horseshoe vortices in front of the wreck, the
28
formation of lee-wake vortices behind the structure, and increased turbulence and shear
29
stress in the lee of the wreck site. CFD simulations demonstrate that horseshoe vortices
30
control scour on the upstream face of structure, but play a minimal role in scouring on the
31
lee side. Lee-wake vortices dominate behind the structure, with low pressure zones in the
32
lee of the wreck capturing flow. The amplification and reduction of wall shear stress and
33
turbulent kinetic energy in the lee of the vessel form distinctive patterns in relation to flow
34
direction, with areas of amplified and reduced wall shear stress and turbulent kinetic energy
35
demonstrating excellent spatial correlation with erosional and depositional patterns
36
developed at real-world wreck sites.
1. Introduction
39
40
Erosional and depositional features form in the lee of obstacles on the seafloor and are
41
widely reported from all offshore environments (Whitehouse, 1998). Natural features such
42
as rock outcrops and anthropogenic obstacles including breakwaters, pilings, foundations,
43
and shipwrecks give rise to sediment deposits and scour features in their wake (Astley et al.,
44
2014; Whitehouse et al., 2010). An understanding of the processes that form and maintain
45
these erosional and depositional features is critical as they can control the stability and
long-46
term integrity of submerged anthropogenic structures.
47
48
In archaeological investigations, scouring is reported widely, from nearshore submerged
49
wreck sites in shallow water (Arnold et al. 1999; Baeye et al., 2016; Caston 1979; McNinch
50
et al. 2001; Quinn et al. 1997; Wheeler 2002) to deep-water sites on the continental shelf
51
and beyond (Ballard et al. 2000, 2002; McCann and Oleson 2004; Uchupi et al. 1988). Scour
52
is reported from intact and scattered wreck sites (Arnold et al. 1999; Caston 1979; McNinch
53
et al. 2001; Quinn 2006; Wheeler 2002) and from individual artifacts and artifact scatters
54
(Ballard et al. 2000, 2002; McCann and Oleson 2004). In maritime archaeology the focus on
55
site formation theory (Muckelroy 1978; O’Shea 2002; Quinn 2006; Stewart 1999; Ward et
56
al. 1999) and a general acceptance that physical processes dominate site formation in the
57
early stages (Ward et al. 1999) suggest that a greater understanding of scouring and
58
associated depositional and erosional processes and patterns at wreck sites is important.
59
60
The aim of this study is to investigate the mechanisms responsible for the formation and
61
evolution of scour and depositional features under secondary flows using computational fluid
62
dynamic (CFD) simulations (Smyth and Quinn, 2014). Until now, we have only been able to
63
investigate patterns of erosion and deposition through field-based investigations (Caston,
64
1979; Astley et al., 2014) or laboratory based physical models (Saunders, 2005; Testik et al.,
65
2005), while the complex processes giving rise to the patterns have been difficult,
time-66
consuming and expensive to investigate. CFD allows us to examine these processes in detail.
67
The results represent a significant breakthrough in understanding fluid flow and erosional
68
and depositional processes and patterns at submerged wreck sites.
69
70
2. Theory: patterns of erosion and deposition at wreck sites
71
72
Scouring is associated with areas of elevated shear stress, where shear stress exerted by
73
moving water is proportional to the square of the flow velocity. In the ocean, the majority of
74
erosion, deposition, and transport of sediment takes place in the boundary layer adjacent to
the seafloor. The extent to which sediment movement takes place depends on the amount
76
of turbulence (turbulent kinetic energy, TKE) and shear stress (wall shear stress, WSS)
77
exerted on the bed. Sediment moves on the seafloor when the shear stress at the bed
78
exceeds the frictional and gravitational forces holding the grains to the bed (i.e. when critical
79
shear stress is reached). Marine scour occurs when sediment is eroded by oscillatory flows
80
such as waves, by directional flows (tidal, river, or density induced), or a combination of
81
both (Whitehouse 1998). The introduction of an object (shipwreck or engineering
82
structure) to the seafloor may initiate scour (Soulsby 1997; Whitehouse 1998; Quinn 2006),
83
and scour processes can ultimately lead to complete failure and collapse of the structure
84
(Soulsby 1997; Whitehouse 1998). Scour signatures are widely reported from the marine
85
environment, and their development and importance in short- and long- term site evolution
86
are noted in shipwreck archaeology (Arnold et al. 1999; Baeye et al., 2016; Caston 1979;
87
McNinch et al. 2001; Quinn 2006; Trembanis and McNinch 2003; Uchupi et al. 1988; Ward
88
et al. 1999).
89
90
In summary, the introduction of an object to the seafloor leads to an increase in flow
91
velocity (due to continuity) and turbulence (due to the generation of vortices; Whitehouse
92
1998). Scouring subsequently results in the lowering of the seabed due to flow velocity
93
increase near the object, a resulting increase in the local Shields parameter (a
non-94
dimensional number used to calculate the initiation of motion of sediment in a fluid flow),
95
and subsequent divergences in the sediment transport regime (Voropayev et al. 2003).
96
Therefore the introduction of an object to the seafloor causes changes in the flow regime in
97
its immediate environs, resulting in one, or a combination of, the following: flow contraction;
98
the formation of a horseshoe vortex in front of the structure; the formation of lee-wake
99
vortices behind the structure (sometimes accompanied by vortex shedding); turbulence; the
100
occurrence of reflection and diffraction waves; wave breaking; and sediment liquefaction
101
promoting material loss from the site (Sumer et al. 2001). These processes increase local
102
sediment transport and subsequently lead to scour (Sumer et al. 2001).
103
104
The flow around a shipwreck is three-dimensional and consists of two basic structures
105
(Testik et al. 2005; Quinn, 2006): the horseshoe vortex formed at the front of the structure
106
and the lee-wake vortex formed behind. The horseshoe vortex is created by the rotation of
107
the incoming flow, and under the influence of the adverse pressure gradient produced by the
108
structure, rolls up to form a swirling vortex around the structure, and trails off down-flow
109
(Sumer et al. 1997). Vortex shedding sometimes occurs, where self-propelling, closed ring
110
structures are formed and transported by the flow (Testik et al. 2005). Lee wake vortices
111
are formed by the rotation in the boundary layer over the surface of the object. End effects
from the bow and stern of the vessel play a dominant role in the flow pattern and strongly
113
modify the structure of vortices (Testik et al. 2005; Quinn, 2006). Lee wake vortices
114
emanating from the surface of the object are brought together in the vicinity of the
115
structure due to flow convergence (Hatton et al. 2004; Smith et al. 2004; Testik et al. 2005).
116
Additionally, two counter-rotating vortices form a vortical region in the near wake on the
117
lee side of the object (Testik et al. 2005).
118
119
When scour occurs on fine-grained (silt or clay) seabeds, the eroded material is carried
120
away from the wreck site in suspension (Baeye et al., 2016), leaving a seafloor depression
121
that may not readily be in-filled by natural processes (Whitehouse et al. 2011). When scour
122
occurs in coarse-grained deposits (sand or gravel), it usually results in local deposition of the
123
eroded material. As the majority of wrecks of archaeological interest are located in shelf
124
seas dominated by sand- and/or gravel-substrates, this study focuses on sites located in
125
coarse-grained deposits only.
126
127
Caston (1979), Saunders (2005), Quinn (2006), and Quinn et al. (2016) previously illustrated
128
complex patterns in the formation of scour and depositional features at wrecks sites, and
129
noted the size and morphology of scour features are sensitive to the orientation of the
130
obstacle relative to flow. Knowledge of these patterns and inferred processes have been
131
largely derived from field observation through remote sensing (Caston, 1979; Quinn, 2006)
132
and laboratory-based physical models (Saunders, 2005; Testik et al., 2005). However, the
133
characteristics of the flows that develop behind shipwrecks, the stresses and turbulences
134
that are induced by the obstacle, and their relationship with the angle of incidence of the
135
flow remain poorly understood.
136
137
In engineering, scour is broadly classified as local scour (e.g. steep-sided scour pits at
138
individual obstructions), global or dishpan scour (shallow broad depressions developed
139
around installations), or general seabed movement, resulting in erosion, deposition or
140
bedform development (Whitehouse 1998). In this study, the terms local scour (steep-sided
141
scour pits formed in the immediate area of the wreck) and wake scour (shallower elongate
142
extended linear depressions formed parallel to peak flow) are adopted following Saunders
143
(2005).
144
145
3. Material and methods
146
147
3.1 Experimental setup
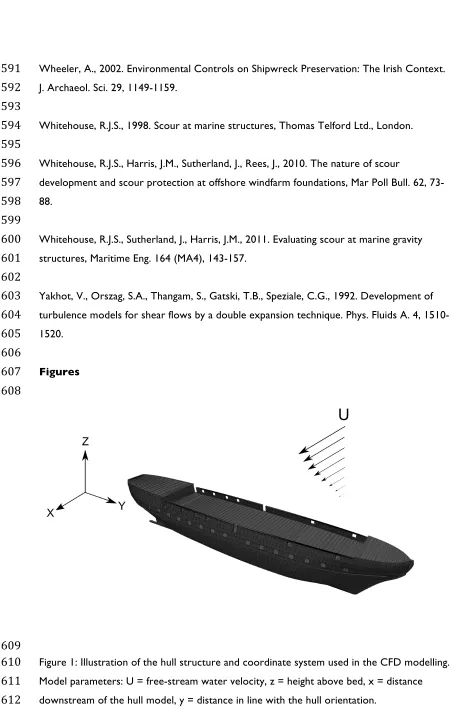
CFD simulations were conducted using a ‘generic’ hull shape (Figure 1) to represent the
150
shipwreck. The hull of Jylland (launched 1860), one of the world's largest wooden warships
151
(designed as both a screw-propelled steam frigate and a sail ship), was modelled in SketchUp
152
and converted to a stereolithography (STL) file. SnappyHexMesh, the native mesh generator
153
of the CFD software package OpenFOAM®, was used to produce the final
three-154
dimensional computational domain. The hull was positioned in the centre of a 500 x 500 x
155
40 m domain which increased in resolution from 25 m at the boundaries to 0.125 m at the
156
wreck site, finer than the resolution used by Smyth and Quinn (2014) at which mesh
157
independence was achieved. The bottom 2 m of the hull was placed beneath the seabed,
158
leaving 5 m of the structure exposed. The seabed was prescribed a roughness length (z0) of
159
0.06 m, the equivalent of rippled sand (Johns, 1983), while the water surface was defined to
160
produce zero gradient with the flow. This model was designed to mimic a typical fully
161
submerged wreck site in a shelf sea environment, and the domain size and resolution was
162
designed to optimize model run times while capturing near-field and far-field erosional and
163
depositional signatures.
164
165
3.2 Approaching flow
166
167
The secondary flows that develop in the presence of a shipwreck are formed by modification
168
of the approaching flow. Flow can be described using the Navier-Stokes equations; however,
169
calculation of the complete equations in fully turbulent flow is computationally prohibitive.
170
In these simulations flow was modelled using the Reynolds-averaged Navier-Stokes (RANS)
171
equations using OpenFOAM®. The RANS equations decompose fluid movement into
time-172
averaged and fluctuating quantities, providing an approximate solution of the Navier-Stokes
173
equations.
174
175
TKE and turbulence dissipation rate (ε) was calculated using renormalization group theory
176
(RNG). This method was employed due to the excellent comparison between measured and
177
modelled data in a wind tunnel over a backward facing step (Yakhot et al., 1992) and in field
178
experiments over three-dimensional natural complex landforms (Smyth et al., 2013; Hesp et
179
al., 2015).
180
181
As flow in the lee of a shipwreck is intrinsically unsteady, the large time-step transient solver
182
for incompressible flow (PIMPLE) was used. Simulations were considered complete once the
183
initial solver residuals representing the absolute error of a variable were 5 orders of
184
magnitude smaller than the maximum calculated. To represent determinative flow
185
conditions, 100 time steps of each simulation were averaged from which flowlines (the path
traced by a massless particle), velocity, turbulent kinetic energy, wall shear stress and
187
pressure were visualized.
188
189
Fluid flow at the inlet of the computational domain was defined as a steady logarithmic
190
boundary layer equal to 1.30 m s-1 2 m above the seabed. Simulations were conducted at 15°
191
increments, from perpendicular (90°) to parallel to flow (0°); a total of 7 simulations. To
192
represent water at 10°C, the fluid was prescribed a kinematic viscosity of 1.307 m2 s-1.
193
194
4. Results
195
196
4.1 General hydrodynamic environment in the lee of the hull
197
198
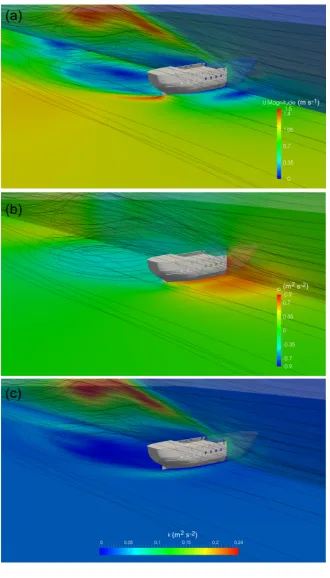
The general hydrodynamic environment in the lee of the submerged hull structure is
199
illustrated in a series of 3-dimensional CFD visualizations (Figure 2). Horizontal flow
200
separation occurs in the formation of two opposing vortices in the lee of the wreck (Figure
201
2a), with low-velocity zones developing on the upstream and downstream side of the hull
202
structure, and high velocity zones developing in the water column above the wreck and on
203
the seabed at the bow and stern of the vessel (Figure 2a). A high-pressure zone is induced
204
on the upstream side of the hull and a low pressure zone formed on the downstream side
205
(Figure 2b). Patterns of turbulence in the water column and on the seafloor (Figure 2c)
206
largely mirror the patterns in velocity, with a zone of high turbulence developed in the water
207
column on the downstream side of the hull and zones of elevated turbulence developed on
208
the seafloor on the upstream side of the wreck and at the bow and stern (Figure 2c).
209
210
The flow velocity and patterns of pressure (P), WSS, and TKE are now discussed as a
211
function of incidence at increments of 15°; from the hull orientated perpendicular to flow (at
212
90°) to parallel to flow (at 0°) (Figures 3-9; Table 1).
213
214
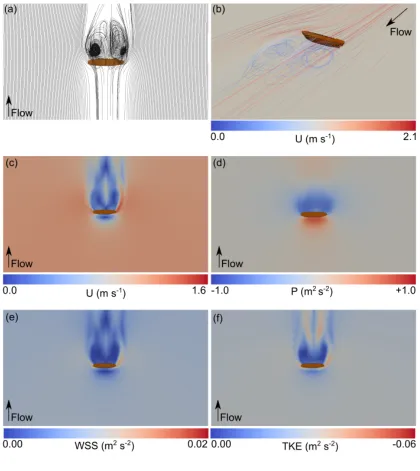
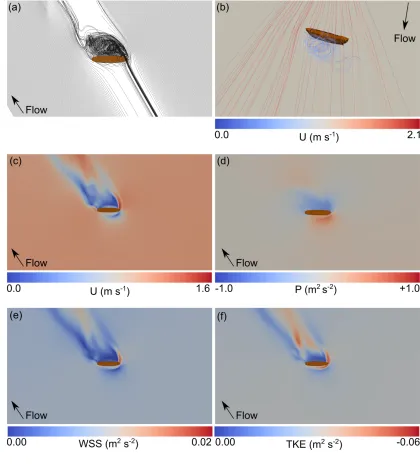
4.2 Hull at 90º to flow
215
216
Figure 3 shows typical CFD simulations for the submerged hull at an incident angle of 90º
217
under a uni-directional flow of velocity 1.3 m s-1. At this angle of incidence, flow and stress
218
patterns are almost symmetrical around a flow-parallel plane of symmetry through the
219
centre of the hull. On encountering the hull, an adverse pressure gradient induces small
220
clockwise horseshoe vortices at the near-vertical wall, and the approaching flow is diverted
221
over and around the structure, increasing in velocity (Figures 3b and 3c). Flow contraction
222
occurs at the bow and stern. Horizontal flow separation takes place, with a counter rotating
low-velocity vortex pair developing in the low-pressure zone downstream of the hull
224
(Figures 3a to 3c). Overall, the flow velocity structure is complex (Figure 3c), but virtually
225
symmetrical around the plane. Low velocity zones form immediately upstream and
226
downstream of the hull. Two crescentic regions of increased velocity originate from the bow
227
and stern, converging downstream. A central high-velocity, flow-parallel zone is located
228
between the two counter-rotating vortices (Figure 3c). A high-pressure zone develops
229
upstream, probably by pressure-induced down-flow on the seafloor (Figure 3d). Immediately
230
in the lee of the hull, a low pressure zone develops and extends downstream for
231
approximately one full length. This is in turn replaced by a zone of intermediate pressure
232
(Figure 3d). Two crescentic regions of amplified wall shear stress (WSS, Figure 3e) and
233
turbulent kinetic energy (TKE, Figure 3f) originate at the bow and stern, coincident with the
234
zones of elevated flow velocity modelled in the CFD simulations (Figure 3c). Furthermore, in
235
the TKE simulation, two symmetrical turbulent zones form parallel to dominant flow,
236
emanating approximately one ship-length from the hull. Zones of low WSS and low TKE
237
form immediately in the lee of the hull and on the upstream side of the structure.
238
239
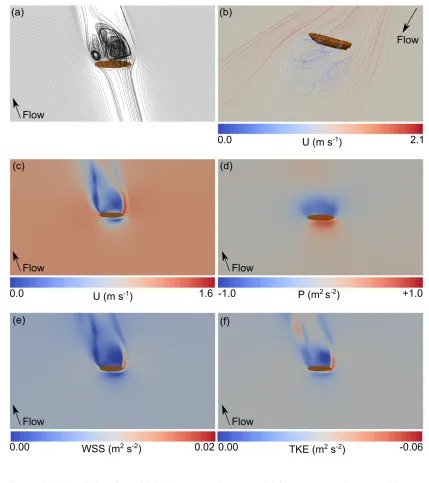
4.3 Hull at 75º to flow
240
241
As the approaching flow becomes more acute, the patterns developed in the CFD simulation
242
become increasingly asymmetrical. Figure 4 shows typical CFD simulations for the
243
submerged hull at an incident angle of 75º under a uni-directional flow of velocity 1.3 m s-1.
244
At this angle, flow contraction, flow separation and the development of the horseshoe
245
vortex on the upstream side of the hull structure are observed (Figures 4a and 4b).
246
Counter-rotating low-velocity vortices are again developed in the lee of the hull, with the
in-247
flow vortex dominant. The low-velocity (Figure 4c) and low-pressure (Figure 4d) zones
248
developed downstream are skewed along a line parallel to the flow, with greater
flow-249
contraction and higher velocities recorded at the bow than the stern (Figures 4b and 4c).
250
WSS and TKE patterns broadly correlate (Figures 4e and 4f) with zones of high shear stress
251
and turbulence extending from the bow and stern, with higher values recorded at and in the
252
lee of the bow section. Additionally, two asymmetric turbulent zones form downstream of
253
the hull, separated and surrounded by zones of low turbulence, elongated parallel to the
254
flow direction (Figure 4f).
255
256
4.4 Hull at 60º to flow
257
258
Figure 5 shows typical CFD simulations for the submerged hull at an incident angle of 60º
259
under a uni-directional flow of velocity 1.3 m s-1. At 60º, the upstream vortex developed at
the bow almost completely dominates vortex development in the lee of the structure. A
261
small downstream vortex is developed in the lee of the stern, but it is much smaller in terms
262
of magnitude and space (Figures 5a and 5b). Flow contraction and downward pressure is
263
greater at the bow (Figures 5a to 5d), with the low pressure zone developed in the lee of
264
the vessel skewed in direction of flow. Again, the WSS and TKE plots correlate (Figures 5e
265
and 5f) with high shear stress and turbulent areas developed at the bow and two zones of
266
high WSS/TKE converging downstream of the hull, roughly parallel to flow.
267
268
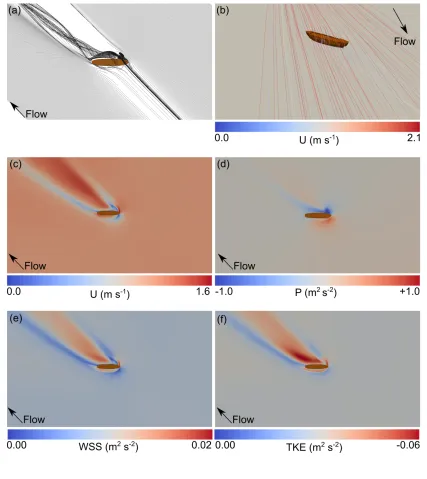
4.5 Hull at 45º to flow
269
270
Figure 6 shows typical CFD simulations for the submerged hull at an incident angle of 45º
271
under a uni-directional flow of velocity 1.3 m s-1. At 45º, the rotating vortex originating at
272
the bow of the vessel dominates the 2D and 3D flow line simulations (Figures 6a and 6b).
273
The vortex originating at the stern is negligible (Figure 6b), although still present. High
274
velocity (Figure 6c) and high pressure (Figure 6d) zones develop in the lee of the hull, with
275
low velocity and low pressure zones at their edges. Strong correlation between the WSS
276
(Figure 6e) and TKE (Figure 6f) plots are evident, with amplification of both in flow-parallel
277
zones in the lee of the hull. Both zones are bordered by narrow bands of low WSS and low
278
TKE.
279
280
4.6 Hull at 30º to flow
281
282
Figure 7 shows typical CFD simulations for the submerged hull at an incident angle of 30º
283
under a uni-directional flow of velocity 1.3 m s-1. At 30º, the rotating vortex originating at
284
the bow of the vessel again dominates (Figures 7a and 7b), with the ensuing more open
285
vortex aligned at 30º, parallel to the approaching flow. High velocity (Figure 7c) and high
286
pressure (Figure 7d) zones develop in the lee of the hull, again with low velocity and low
287
pressure zones at their edges. Strong correlation between the WSS (Figure 7e) and TKE
288
(Figure 7f) plots are once more evident, with amplification of both in flow-parallel zones in
289
the lee of the hull. Both zones are bordered by narrow bands of low WSS and low TKE,
290
almost symmetrical in nature about a flow-parallel plane. Zones of high WSS and TKE are
291
also evident at the front and originating from the bow of the hull.
292
293
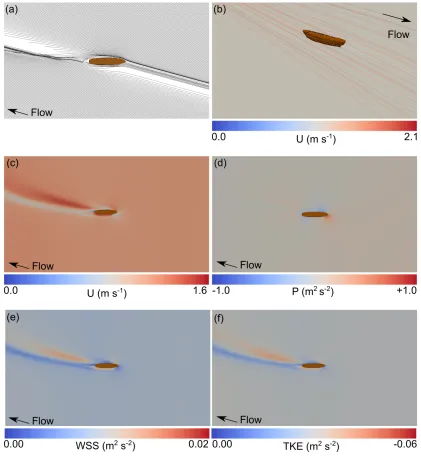
4.7 Hull at 15º to flow
294
295
Figure 8 shows typical CFD simulations for the submerged hull at an incident angle of 15º
296
under a uni-directional flow of velocity 1.3 m s-1. At 15º, with the elongate hull structure
aligned almost parallel to approaching flow, a single tight rotating vortex originates from the
298
vessel (Figures 8a and 8b), parallel to flow. A high velocity (Figure 8c) zone extends
299
downstream from the structure, accompanied by a low velocity zone below it. High and low
300
pressure zones are developed at the front and back of the bow section respectively (Figure
301
8d). Strong correlation between the WSS (Figure 8e) and TKE (Figure 8f) plots are again
302
evident, with amplification of both in flow-parallel zones in the lee of the hull. Both zones are
303
bordered at the bottom by narrow bands of low WSS and low TKE. Zones of high WSS and
304
TKE are also evident at below the hull.
305
306
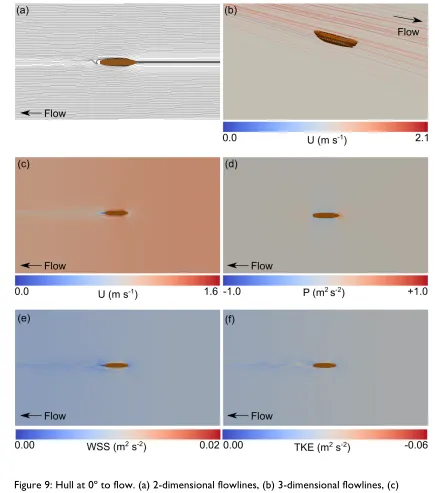
4.8 Hull at 0º to flow
307
308
Figure 9 shows typical CFD simulations for the submerged hull at an incident angle of 0º
309
under a uni-directional flow of velocity 1.3 m s-1. At 0º, with the hull aligned parallel to the
310
approaching flow, a single tight flow-parallel rotating vortex originates from the stern
311
(Figures 9a and 9b). A low velocity (Figure 9c) tail extends downstream from the structure.
312
High pressure zones are developed at the bow and stern (Figure 9d) and low pressure zones
313
to the port and starboard of the vessel. Finally, alternating zones of high and low WSS
314
(Figure 9e) and TKE (Figure 9f) originate at the stern, parallel to the approaching flow.
315
316
5. Discussion
317
318
5.1 Flow regimes
319
320
The CFD models (Figures 3-9) successfully capture the following changes in the flow regime
321
in the environment of the wreck site: flow contraction, the generation of a horseshoe
322
vortex in front of the wreck, the formation of lee-wake vortices behind the structure, and
323
increased turbulence and shear stress in the lee of the wreck site. The modelling further
324
demonstrates that horseshoe vortices control scour at the front (upstream face) of the
325
structure, but plays no role in scouring on the lee side of the structure. No horseshoe
326
vortex shedding is observed in CFD simulations. Lee-wake vortices dominate behind the
327
structure, with low pressure zones in the lee of the wreck capturing flow. The amplification
328
and reduction of wall shear stress and turbulent kinetic energy in the lee of the vessel form
329
distinctive patterns in relation to flow direction, with strongly developed areas of amplified
330
and reduced wall shear stress and turbulent kinetic energy demonstrating good spatial
331
correlation with each other.
332
333
5.2 Erosional and depositional patterns: models outputs and model validation
335
When the outputs of the CFD models are compared to existing wreck scour classification
336
schemes derived from real-world data (Caston, 1979; Quinn, 2006) and laboratory
337
experiments (Saunders, 2005; Testik et al., 2005), strong correlation is observed between
338
the morphology and orientation of elevated wall shear stress (WSS) and turbulent kinetic
339
energy (TKE) in the CFD models and the location of scour features in the scour
340
classifications. The spatial correlation between zones of elevated TKE and scour is most
341
notable. Figure 10 shows the interpreted relationship between the erosional and
342
depositional patterns formed in the wake of the wreck as a function of orientation to peak
343
tidal flow derived from the CFD modelling. Scour patterns in the classification are mapped
344
from zones of elevated TKE, and depositional patterns are mapped from zones of reduced
345
TKE. The CFD modelling and interpretation is validated by comparison with multibeam
346
echosounder derived elevation models of real world wreck sites (Plets et al. 2011) collected
347
off the south coast of England (Figure 11a) and the north east coast of Ireland (Figure 11b).
348
Both of these study sites are characterized by non-cohesive sandy seafloors and
bi-349
directional current regimes, analogous to the CFD model environment.
350
351
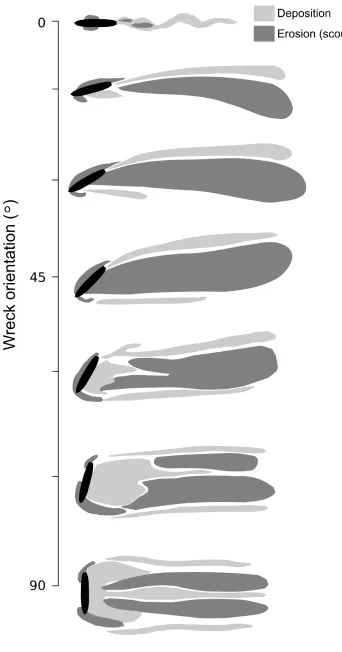
For wrecks lying at 90º to flow, the CFD model predicts twin symmetrical wake scours
352
extending downstream and local scour developed around the bow and stern of the vessel
353
(Figure 11), with an area of deposition (thicker sediment) between the two wake scour
354
features. When compared to real-world wreck sites (A and B in Figure 11a), the correlation
355
between the modelled and real world environments is convincing. The more complex
356
arrangement of erosion and deposition imaged at site B is due to the fact that the wreck is
357
broken in two around midhips, presenting a more complex obstacle to flow.
358
359
At an orientation of 75º, the CFD model predicts two asymmetric wake scours and the
360
development of local scour features at the bow and stern, with higher TKE values (deeper
361
and steeper scour) at the bow, facing into the flow. Areas of deposition are predicted on the
362
outside of the wake scours, parallel to peak flow, and immediately in the lee of the vessel,
363
where TKE and shear stress levels are reduced (Figures 4 and 10).
364
365
At an orientation of 60º, the initially separate twin scour hollows converge into one with
366
distance from the vessel (Figure 10). Local scour is developed at the bow and stern, with a
367
deeper and more extensive scour feature developed around the bow, facing the incoming
368
flow. Zones of deposition are located in the immediate lee of the vessel and as two slightly
369
asymmetric ridges extending parallel to the main wake scour.
370
At an orientation of 45º, a single broad wake scour feature is interpreted, with local scour
372
developed at the bow. Two asymmetric depositional areas are predicted along the edges of
373
the wake scour, parallel to peak flow, with the depositional tail from the stern (the end
374
facing away from flow) longer and broader than the tail from the bow end. When compared
375
to a similar real-world wreck site (F in Figure 11b), the correlation between the predicted
376
patterns and actual patterns is again compelling. Of particular note in this flow scenario is
377
that the highly elevated TKE area in the immediate lee of the vessel (Figure 6) correlate with
378
the steep-sided local scour pits developed on the lee sides of the wreck in response to flood
379
and ebb tides (Figure 11b).
380
381
At an orientation of 30º, the single broad wake scour developed in the lee of the vessel is
382
bounded by two asymmetric depositional tails, with the tail from the stern side of the vessel
383
more extending the full length of the scour. When compared to an analogous real-world
384
wreck site (E in Figure 11b), the correlation is once again striking. The depositional tails
385
developed at this wreck site are up to 1 km long, with local scour developed around the
386
bow of the structure.
387
388
At an orientation of 15º, the single lee wake scour feature dominates with the asymmetry of
389
the depositional tails increasing further (Figure 10 and Site D in Figure 11a). At an
390
orientation of 0º, the signatures of scour and deposition are much weaker, due to the
391
streamlined nature of the vessel lying parallel to peak tidal flow.
392
393
The processes and patterns inferred from the CFD modelling are in broad agreement with
394
previous studies (Caston 1979; Quinn, 2006; Saunders, 2005; Testik et al., 2005). However,
395
the level of detail generated from the CFD modelling is much greater, and the control
396
environment offered by the numerical modelling allows much greater understanding of
397
linked processes and patterns.
398
399
An additional minor point of note is that the asymmetry of the modelled shipwreck
400
(streamlined bow and square stern section) leads to slight asymmetry of scour features,
401
particularly in the local scour pits. This result indicates the morphology of the hull of the
402
wreck can impart a significant influence on the morphology (shape, depth etc.) of the scour
403
and depositional features. To date, physical laboratory experiments investigating scour
404
around fully submerged obstacles (e.g. Saunders, 2005; Testik et al. 2005) employed
405
symmetrically shaped objects, resulting in symmetrical scour patterns.
406
407
5.3 Archaeological implications
409
The archaeological implications of this method are significant in that CFD allows us to
410
examine hydrodynamic processes in detail, and make strong links between coupled
411
hydrodynamic and sediment dynamic processes and patterns. The results therefore
412
represent a significant breakthrough in understanding fluid flow and erosional and
413
depositional processes and patterns at submerged wreck sites. Research into processes that
414
form the submerged archaeological record informs effective in-situ conservation and
415
preservation of archaeological sites. Understanding N-transforms at fully submerged sites in
416
detail – specifically, the linked physical processes operating in the water column
(hydro-417
dynamics) and on the sea floor (sediment-dynamics) - can contribute greatly to the effective
418
in-situ conservation of wreck sites.
419
420
Regular site inspections are an integral part of the overall management strategy for
421
submerged sites (MacLeod and Richards, 2011). Increasingly, baseline morphological surveys
422
of submerged shipwreck sites employ multibeam echosounders (Plets et al., 2011), with
423
further inspections at (ir)regular intervals to assess change in site integrity (Manders, 2009;
424
Quinn and Boland, 2010; Bates et al., 2011; Astley et al., 2014). Over time, this can lead to
425
sophisticated models of erosion and deposition (Manders, 2009; Astley et al., 2014; Brennan
426
et al., 2016), albeit at a very high financial cost. Another drawback is that these approaches
427
only allow the patterns of erosion and deposition to be investigated, with causative
428
processes only inferred from the results.
429
430
Conversely, CFD modelling allows us to examine both patterns and processes, and allows us
431
to use high-resolution multibeam echosounder data as model inputs (Smyth and Quinn,
432
2014). CFD modelling is relatively inexpensive, can make use of open-source software (e.g.
433
OpenFOAM), and allows control of the modelling environment, scenario setting, and even
434
hypotheses testing. This approach is required to broaden our understanding of the
435
processes impacting submerged wreck sites, to inform policy makers, and to develop
436
effective mitigation strategies to minimise loss in the face of increasing human (e.g. offshore
437
developments) and natural (e.g. increased storminess associated with climate change)
438
forcing.
439
440
Due to the vast number of wrecks discovered on and under the seabed, and the prohibitive
441
costs involved in excavating, raising and conserving these structures, the past two decades
442
has seen a move toward in-situ preservation; to protect, monitor, and manage underwater
443
archaeological sites where they lie on the seabed (Gregory et al., 2012). This approach is
444
encouraed in the 2001 UNESCO Convention for the Protection of the Underwater Cultural
Heritage (UNESCO, 2001), which advises that underwater cultural heritage should be
446
protected in-situ as a first option and non-intrusive methods to document and study these
447
sites in-situ should be used (Gregory et al., 2012). The CFD approach used in this study
448
makes important contributions to not only understanding the processes acting on
449
shipwrecks, but also highlights areas where in-situ preservation measures could be
450
concentrated and targeted (in areas of high turbulence and shear stress), and therefore
451
allows the development of sophisticated plans for in-situ preservation.
452
453
Acknowledgements
454
455
The MBES data presented in Figure 11a contains public sector information, licensed under
456
the Open Government License v2.0, from Fugro EMU. The MBES data presented in Figure
457
11b contains public sector information, licensed under the Open Government License v2.0,
458
from the Royal Navy. All numerical modelling, data processing and data rendering in this
459
study was conducted in open source software; we acknowledge the OpenFOAM, Paraview,
460
QGIS and Inkscape community and developers. Thanks to Craig Dyer (Fugro EMU) for
461
useful discussion and for pointing us in the direction of the MBES data off Dartmouth.
462
Reviews by two anonymous reviewers greatly improved an earlier version of this
463
manuscript.
464
465
466
References
467
468
Arnold, J.B., Oertling, T.J., Hall, A.W., 1999. The Denbigh Project: initial observations on a
469
Civil War blockade-runner and its wreck-site. Int. J. Naut. Archaeol. 28, 126-144.
470
471
Astley, A., Dix, J.K., Thompson, C., Sturt, F., 2014. A seventeen year, near-annual,
472
bathymetric time-series of a marine structure (SS Richard Montgomery). In: Cheng, L.,
473
Draper, S. and An, H. (Eds.), Scour and Erosion: Proceedings of the 7th International
474
Conference on Scour and Erosion. International Conference on Scour and Erosion. Taylor &
475
Francis, pp 715-724.
476
477
Baeye, M., Quinn, R., Deleu, S., Fettweis, M., 2016. Detection of shipwrecks in ocean colour
478
satellite imagery. J. Archaeol. Sci. 66, 1-6.
479
480
Ballard, R.D., McCann, A.M., Yoeger, D., Whitcomb, L., Mindell, D., Oleson, J., Singh, H.,
481
Foley, B., Adams, J., Piechota, D., Giangrande, C., 2000. The discovery of ancient history in
the deep sea using advanced deep submergence technology. Deep-Sea Res. Pt I. 47:
1519-483
1620.
484
485
Ballard, R.D., Stager, L.E., Master, D., Yoerger, D., Mindell, D., Whitcomb, L.L., Singh, H. and
486
Piechota, D., 2002. Iron Age Shipwrecks in Deep Water off Ashkelon, Israel. Am. J.
487
Archaeol. 106, 151-168.
488
Bates, C.R., Lawrence, M., Dean, M., Robertson, P., 2011. Geophysical Methods for
Wreck-489
Site Monitoring: the Rapid Archaeological Site Surveying and Evaluation (RASSE) programme.
490
Int. J. Naut. Archaeol. 40, 404-416.
491
492
Brennan, M.L., Davis, D., Ballard, R.D., Trembanis, A.C., Vaughan, V.I., Krumholz, J.S.,
493
Delgado, J.P., Roman, C.N., Smart, C., Bell, K.L.C., Duman, M., DuVal, C., 2016.
494
Quantification of bottom trawl fishing damage to ancient shipwreck sites. Mar. Geol. 371,
495
82-88.
496
497
Caston, G.F., 1979. Wreck marks: indicators of net sand transport. Mar. Geol. 33, 193-204.
498
499
Gregory, D., Jensen, P., Strætkvern, K., 2012. Conservation and in situ preservation of
500
wooden shipwrecks from marine environments. J. Cult. Herit. 13, S139–S148.
501
502
Hatton, K.A., Smith, H.D. and Foster, D.L., 2004. The Scour and Burial of Submerged Mines,
503
Eos Trans. AGU. 84 (52). Ocean Sci. Meet. Suppl. Abstract OS52B-18.
504
505
Hesp, P.A., Smyth, T.A.G., Nielsen, P., Walker, I.J., Bauer, B.O., Davidson-Arnott, R., 2015.
506
Flow deflection over a foredune. Geomorphology. 230, 64-74.
507
508
Manders, M., 2009. Multibeam recording as a way to monitor shipwreck sites. In: MACHU
509
Final Report NR. 3 - Managing Cultural Heritage Underwater, pp. 59–66.
510
511
MacLeod, I.D., Richards, V.L., 2011. In situ conservation surveys of iron shipwrecks in Chuuk
512
Lagoon and the impact of human intervention. AICCM Bull. 32, 106-122.
513
514
McCann, A.M. and Oleson, J.P., 2004. Deep Water Shipwrecks off Skerki Bank: The 1997
515
Survey. J. Roman Archaeol. Supp. Ser. 58. Portsmouth, R.I.
McNinch, J.E. Wells, J.T and Drake, T.G., 2001. The fate of artifacts in an energetic,
shallow-518
water environment: scour and burial at the wreck site of Queen Anne’s Revenge.
519
Southeastern Geol. 40, 19-27.
520
521
Muckelroy, K., 1978. Maritime archaeology, Cambridge University Press, Cambridge.
522
523
O’ Shea, J.M., 2002. The archaeology of scattered wreck-sites: formation processes and
524
shallow water archaeology in western Lake Huron. Int. J. Naut. Archaeol. 31, 211-227.
525
526
Plets, R., Quinn, R., Forsythe, W., Westley, K., Bell, T., Benetti, S., McGrath, F., Robinson, R.,
527
2011. Using Multibeam Echo-Sounder Data to Identify Shipwreck Sites: archaeological
528
assessment of the Joint Irish Bathymetric Survey data. Int. J. Naut. Archaeol. 40, 87-98.
529
530
Quinn, R., 2006. The role of scour in shipwreck site formation processes and the
531
preservation of wreck-associated scour signatures in the sedimentary record - evidence
532
from seabed and sub-surface data. . J. Archaeol. Sci. 33, 1419-1432.
533
534
Quinn, R. and Boland, D., 2010. The role of time-lapse bathymetric surveys in assessing
535
morphological change at shipwreck sites. J. Archaeol. Sci. 37, 2938-2946.
536
537
Quinn, R., Saunders, R., Plets, R., Westley, K., Dix, J., 2016. Marine scour of cohesionless
538
sediments. In: Keith, M.E. (Ed.), Site Formation Processes of Submerged Shipwrecks.
539
University Press of Florida, Gainesville, pp. 70-89.
540
541
Quinn, R., Bull, J.M., Dix, J.K and Adams, J.R., 1997. The Mary Rose site - Geophysical
542
Evidence for palaeo-scour marks. Int. J. Naut. Archaeol. 26, 3-16.
543
544
Saunders, R., 2005. Seabed scour emanating from submerged three dimensional objects;
545
archaeological case studies. Unpublished PhD Thesis, University of Southampton.
546
547
Smith, H.D., Foster, D.L., Voropayev, S.I., Fernando, H.J.S., 2004. Modelling the Turbulent
548
Processes Around a 3-D Cylinder, Eos Trans. AGU 85 (47) Fall Meeting Suppl. Abstract
549
OS21B-1217.
550
551
Smyth, T.A.G., Jackson, D.W.T., Cooper, J.A.G., 2013, Three dimensional airflow patterns
552
within a coastal trough–bowl blowout during fresh breeze to hurricane force winds. Aeolian
553
Res. 9, 111-123.
555
Smyth, TAG, Quinn, R., 2014. The role of computational fluid dynamics in understanding
556
shipwreck site formation processes. J. Archaeol. Sci. 45, 220-225.
557
558
Soulsby, R., 1997. Dynamics of Marine Sands, Thomas Telford Ltd, London.
559
560
Sumer, B.M., Christiansen, N. and Fredsoe, J., 1997. The horseshoe vortex and vortex
561
shedding around a vertical wall-mounted cylinder exposed to waves, Journal of Fluid
562
Mechanics, 332: 41-70.
563
564
Sumer, B.M., Whitehouse, R., Torum, A., 2001, Scour around coastal structures: a summary
565
of recent research. Coast. Eng. 44, 153-190.
566
567
Stewart, D.J., 1999. Formation processes affecting submerged archaeological sites: An
568
overview, Geoarchaeology. 14, 565-587.
569
570
Testik, F.Y., Voropayev, S.I. and Fernando, H.J.S., 2005. Flow around a short horizontal
571
bottom cylinder under steady and oscillatory flows. Phys. Fluids. 17, 47-103.
572
573
Trembanis, A.C., McNinch, A.C., 2003. Predicting Scour and Maximum Settling Depths of
574
Shipwrecks: A Numeric Simulation of the Fate of Queen Anne's Revenge. Proceedings of
575
Coastal Sediments, Clearwater Beach, Florida.
576
577
Uchupi, E., Muck, M.T., Ballard, R.D., 1988. The geology of the Titanic site and vicinity,
578
Deep-Sea Res. Pt A. 35, 1093-1110.
579
580
UNESCO, 2001. Convention on the Protection of the Underwater Cultural Heritage.
581
http://www.unesco.org/new/en/culture/themes/underwater-cultural-heritage/2001-582
convention/ Accessed 13.08.2016
583
584
Voropayev, S.I., Testik, F.Y., Fernando, H.J.S., Boyer, D.L., 2003. Burial and scour around
585
short cylinder under progressive shoaling waves. Ocean Eng. 30, 1647-1667.
586
587
Ward, I.A.K., Larcombe, P. and Veth, P., 1999. A New Process-based Model for Wreck Site
588
Formation. J. Archaeol. Sci. 26, 561-570.
Wheeler, A., 2002. Environmental Controls on Shipwreck Preservation: The Irish Context.
591
J. Archaeol. Sci. 29, 1149-1159.
592
593
Whitehouse, R.J.S., 1998. Scour at marine structures, Thomas Telford Ltd., London.
594
595
Whitehouse, R.J.S., Harris, J.M., Sutherland, J., Rees, J., 2010. The nature of scour
596
development and scour protection at offshore windfarm foundations, Mar Poll Bull. 62,
73-597
88.
598
599
Whitehouse, R.J.S., Sutherland, J., Harris, J.M., 2011. Evaluating scour at marine gravity
600
structures, Maritime Eng. 164 (MA4), 143-157.
601
602
Yakhot, V., Orszag, S.A., Thangam, S., Gatski, T.B., Speziale, C.G., 1992. Development of
603
turbulence models for shear flows by a double expansion technique. Phys. Fluids A. 4,
1510-604
1520.
605
606
Figures
607
608
609
Figure 1: Illustration of the hull structure and coordinate system used in the CFD modelling.
610
Model parameters: U = free-stream water velocity, z = height above bed, x = distance
611
downstream of the hull model, y = distance in line with the hull orientation.
614
615
Figure 2: (a) 3D simulation with 2D vertical slice of the velocity field around the hull
616
structure with flowlines superimposed, (b) 3D simulation with 2D vertical slice of the
617
pressure field around the hull structure, and (c) 3D simulation with 2D vertical slice of the
618
TKE field around the hull structure.
621
622
Figure 3: Hull at 90º to flow. (a) 2-dimensional flowlines, (b) 3-dimensional flowlines, (c)
623
velocity, (d) pressure, (e) wall shear stress, and (f) turbulent kinetic energy maps derived
624
from CFD model.
626
627
Figure 4: Hull at 75º to flow. (a) 2-dimensional flowlines, (b) 3-dimensional flowlines, (c)
628
velocity, (d) pressure, (e) wall shear stress, and (f) turbulent kinetic energy maps derived
629
from CFD model.
632
633
Figure 5: Hull at 60º to flow. (a) 2-dimensional flowlines, (b) 3-dimensional flowlines, (c)
634
velocity, (d) pressure, (e) wall shear stress, and (f) turbulent kinetic energy maps derived
635
from CFD model.
638
639
Figure 6: Hull at 45º to flow. (a) 2-dimensional flowlines, (b) 3-dimensional flowlines, (c)
640
velocity, (d) pressure, (e) wall shear stress, and (f) turbulent kinetic energy maps derived
641
from CFD model.
644
645
Figure 7: Hull at 30º to flow. (a) 2-dimensional flowlines, (b) 3-dimensional flowlines, (c)
646
velocity, (d) pressure, (e) wall shear stress, and (f) turbulent kinetic energy maps derived
647
from CFD model.
650
651
Figure 8: Hull at 15º to flow. (a) 2-dimensional flowlines, (b) 3-dimensional flowlines, (c)
652
velocity, (d) pressure, (e) wall shear stress, and (f) turbulent kinetic energy maps derived
653
from CFD model.
656
657
Figure 9: Hull at 0º to flow. (a) 2-dimensional flowlines, (b) 3-dimensional flowlines, (c)
658
velocity, (d) pressure, (e) wall shear stress, and (f) turbulent kinetic energy maps derived
659
from CFD model.
662
663
Figure 10: Wreck associated erosional and depositional patterns around fully submerged
664
shipwrecks inferred from the output of CFD models.
666
667
Figure 11: Multibeam echosounder data from shipwreck sites off (a) Dartmouth on the south
668
coast of England, and (b) Belfast on the north east coast of Ireland.
Table 1
Summary of flow geometry and patterns of velocity (U), pressure (P), shear stress (WSS), and turbulence (TKE) from the CFD
670
simulations.
671
672
Angle (°) Flow geometry U P WSS TKE
90 Symmetrical flow patterns; horseshoe vortices form
upstream; flow contraction at bow and stern; counter-rotating symmetrical low-velocity vortex pair forms downstream of wreck.
Low U zones upstream and downstream of wreck; high flow-parallel U regions originate at bow and stern.
High P zone immediately upstream of wreck; low P zone downstream.
High flow-parallel WSS regions originate at bow and stern; low WSS zones upstream and downstream of wreck.
Low TKE zones upstream and downstream of wreck; high flow-parallel TKE regions originate at bow and stern and in two symmetric diverging flow-parallel regions downstream.
75 Increasing asymmetry of flow upstream and downstream; asymmetric counter-rotating low-velocity vortex pair forms downstream; in-flow vortex dominates.
Low U zones upstream and downstream of wreck; high U region originates at upstream end; low U region originates at downstream end.
High P zone immediately upstream of wreck; low P zone downstream.
Low WSS zones upstream and downstream of wreck; high WSS region originates at upstream end; low WSS region originates at downstream end.
Low TKE zones upstream and downstream of wreck; high TKE region originates at upstream end; low TKE region originates at downstream end; two high TKE regions in wake of hull begin to converge downstream. 60 Increasing asymmetry of flow
upstream and downstream; transition from asymmetric double to single vortex downstream; in-flow vortex dominates.
Low U zones upstream and downstream of wreck; high U region originates at upstream end; low U region originates at downstream end; complex U field in wake of hull.
High P zone immediately upstream of wreck; low P zone downstream elongated parallel to peak flow.
Low WSS zones upstream and downstream of wreck; high WSS region originates at upstream end; low WSS region originates at downstream end; complex WSS field in wake of hull; two high WSS regions in wake of hull converge downstream.
Low TKE zones upstream and downstream of wreck; high TKE region originates at upstream end; low TKE region originates at downstream end; complex WSS field in wake of hull; two high TKE regions in wake of hull converge downstream.
45 Single tight flow-aligned vortex forms downstream.
Single high U zone dominates in wake of hull; bounded by two low U flow-parallel regions originating at bow and stern.
High P zone immediately upstream of wreck, concentrated around upstream end; low P zone downstream elongated parallel to peak flow.
Single high WSS zone dominates in wake of hull; bounded by two low WSS flow-parallel regions originating at bow and stern.
Single high TKE zone dominates in wake of hull; bounded by two low TKE flow-parallel regions originating at bow and stern.
30 Single open flow-aligned vortex forms downstream.
Single high flow-parallel U zone dominates in wake of hull; bounded by two low U flow-parallel regions originating at bow and stern.
High P zone immediately upstream of wreck, concentrated around upstream end; paired high-low P zone downstream elongated parallel to peak flow.
Single high flow-parallel WSS zone dominates in wake of hull; bounded by two low WSS flow-parallel regions originating at bow and stern.
Single high flow-parallel TKE zone dominates in wake of hull; bounded by two low TKE flow-parallel regions originating at bow and stern.
15 Single tight flow-aligned vortex forms downstream.
Single high flow-parallel U zone dominates in wake of hull; bounded by a low U flow-parallel region originating at stern.
High P zone immediately upstream of wreck, concentrated around upstream end.
Single high flow-parallel WSS zone dominates in wake of hull; bounded by a low WSS flow-parallel region originating at stern.
stern. 0 Flow contraction at upstream end
only; single downstream vortex forms immediately adjacent to hull.
Single flow-parallel low-velocity
zone in wake of hull. High P zone upstream and downstream of hull; low P zones at port and starboard.
Flow-parallel laterally extensive low-velocity zone in wake of hull and another at upstream end.
Flow-parallel laterally extensive low/high-velocity zone in wake of hull.