United Kingdom Vol. V, Issue 2, February 2017
Licensed under Creative Common Page 157
http://ijecm.co.uk/
ISSN 2348 0386
ANALYSIS OF THE EFFECT OF OPERATING COST ON
FINANCIAL PERFORMANCE OF OCCUPATIONAL
PENSION SCHEMES IN KENYA
Jane Gathigia Muriithi
School of Business and Economics, Kenya Methodist University, Kenya [email protected]
Abstract
The costs of running pension schemes are believed to be significant and have the potential to
take resources away from scheme members’ pensions. This paper explores the effect of
operating costs on pension schemes which consist of administrative and investment costs which
can substantially increase the cost of retirement security. The study mainly used secondary data
from 164 pension schemes from the audited financial statements from year 2007 to 2009. The
population of interest was the value of assets, investment returns, investment costs,
administrative costs and other costs as indicated. Stratified sampling technique was used to
group the target population of 329 pension schemes into three groups (small, medium and
large) which were drawn from the Kenyan Retirement Benefits Authority register. Data on
pension schemes for the past 3 years financial statements was analyzed using Return on
Assets as the key performance indicator to ascertain the change in financial performance as a
result of operating costs. Data was presented using tables for each ratio computed showing the
annual average of the three financial years. Tabular presentation was used in trends analysis of
each ratios and the year. The study finding on regression analysis shows that there was a
strong inverse relationship between financial performance and investment management costs
as well as administrative cost. The study recommends that trustees/authorities should monitor
and regulate the operating costs incurred by the pension schemes.
Keywords: Operating costs, Administrative costs, financial performance, occupational pension
Licensed under Creative Common Page 158 INTRODUCTION
The components determining the costs of pension provisioning are the quality of the pension schemes and the net rate of return on investments. However, operating costs which consist of administrative and investment costs can also substantially increase the cost of retirement security (Batema and Mitchell, 2004). Examples of the operating costs are the costs of policy development especially asset and liability management, data management systems and reporting. Investment costs include the wages of portfolio manager and analysts, brokerage fees and the cost of electronic trading facilities. The expert personnel required are pension administrators, actuaries, accountants, and legal staff and investment managers. Pension funds can outsource fund administration and investment to specialized companies such as insurance companies, thus gaining access to the necessary expertise, particularly for small firms, at relatively low costs (Bikker and De Dreu, 2009).
A study published by the Dutch National Bank (2009) showed that the average cost per head for pension scheme administration went down as the number of members and assets increased. Large pension schemes are failing to take advantage of potential economies of scale to reduce their administration costs, so forcing investment teams to make better returns to fund their inefficiencies. Consolidation amongst smaller schemes would improve their efficiency and lower costs, but for larger schemes, joining with another would only compound the problem (Pfeuti, 2010). The Dutch National Bank report advised larger schemes to look into internal processes to lower costs and improve their service to members. The study also found that costs for administration, including audit fees and legal charges, for state and governmental schemes were up to 80% higher than the average. The study indicated that the administration costs of pension funds are very important in financial performance as they may erode the wealth accrued for retirement (Pfeuti, 2010).
Licensed under Creative Common Page 159 profitability and costs of the pension scheme agents determines business performance (Dvir, Segev&Shenhar, 1993).
Pension funds perform a useful role in providing collective pensions for individuals. Therefore, the asset allocation of pension funds should be realigned with the risks of the liability structure. Furthermore, the valuation of the pension liabilities should be reconsidered in order to make sure that the assumptions made in valuing the future cash flows are matched with the reality of investment markets. Moreover, performance measurement systems of pension funds focus on investment managers as the primary objective of pension funds (Mansfield, 1979).
Pension Schemes in Kenya
Licensed under Creative Common Page 160 In 1997, the Government of Kenya embarked on an overhaul of the retirement funds industry, previously plagued with the mismanagement and misappropriation of pension scheme assets. The Retirement Benefits Act was introduced in 1997 aimed specifically at regulating a market which had therefore lacked a harmonised legal framework. Under the RBA Act, the authority was formed with the objectives of regulating and supervising the establishment and management of retirement benefit schemes and protects the interest of members and sponsors of retirement benefits schemes. RBA also promotes the development of the retirement benefit sector and seeks to advise the Minister of Finance on national policy to be followed with regard to the retirement benefits sector (RBA, 2007). Under the Act, registered pension schemes are obliged to appoint a board of trustees, one third of whom must be elected by the scheme members, professional managers to manage the scheme assets and a custodian to hold the assets in safe-keeping. Additionally, schemes are obliged to produce audited accounts on an annual basis. Direct benefit schemes are further obliged to undergo actuarial review every 3 years. The Retirement Benefit Authority (RBA) has set guideline limits on the amount that can be invested in any particular asset class (RBA Act). The RBA provides trustee training workshops geared at educating trustees on their roles and responsibilities. The RBA has a dedicated website, containing important information on service providers, legislation and general information
A report by Mutuku (2007) on the trends and challenges of pension schemes indicated that among the problems faced by pension industry in Kenya is high service providers‟ expenses, inadequate returns, ability to meet pension promise requirements, and the need for credible fund manager performance. The problem facing Kenya‟s pension scheme that will be focused on will be the fees paid to the service providers. This is because the efficacy of pension schemes depends in part on its operating costs that are charged by the service providers. High costs of administration may lead to less income on retirement and a low annual rate of return since the expenses are paid from the pension funds; especially on defined contribution schemes (Mutuku, 2007).
Licensed under Creative Common Page 161 service providers. In order to manage the pension funds the schemes trustees need to evaluate how these costs affect its finances and return on investment as liabilities may become higher and the scheme end up liquidating. Research work done previously focused on problems facing Kenya‟s pension system (Nyakundi, 2008), but there is no research done on the effect of operating costs on financial performance of pension schemes. This study therefore aimed to find out how these operating costs affect the financial performance of the pension schemes in Kenya and to what extent
LITERATURE REVIEW
Theory of contribution density
The theory of contribution density states that the adequacy of contributory pensions depends on the contributions of the scheme (Valdes, 2007). Contribution density is defined as the share (present value of) earnings in the active phase of life on which the individual contributes to some pension scheme for old age (Salvador, 2008). Density can be far below 100% because the state is unable to or unwilling to impose the mandate to contribute on all jobs, especially on poor workers such as many in self-employment and small firms. For any given rate of turnover between covered jobs and other uses of time, average density falls when self-employment expands and when activity outside the labour force rises. The determinants of the effective rate of return offered by the pension plans include the earnings differential. This return is compared with the return offered by pure saving in the financial market, to determine the equilibrium density of contribution which affects the financial health of the pension fund (Valdes, 2007). The operating costs affect the scheme funds by reducing the annual rate of return.
Agency theory
Licensed under Creative Common Page 162 Pension schemes with very few exceptions are not resourced to manage all their activities in-house. So they employ „agents‟ in both advice roles such as investment consulting and delegated roles such investment managers. This exposes them to the „agency problem‟ that agents‟ interests may not coincide with those of the fund (Fields &Tirtiroglu, 1991). If opportunity allows, one of the most straight forward opportunistic actions agents can take is to secretly shift expenses, which they would normally bear, onto the principal.
The major issue is that pension funds‟ goals are tied to paying pensions, whereas agents may be more interested in managing their business in line with their own objectives. Furthermore, pension funds tend to use a wide array of professional firms because of the complexity of their activities and the interaction of a number of agents may not make up a cohesive „team‟. The result has been that the costs of employing agents have been high. The share-ownership cost is the second problem of the current investment system. Pension funds have had good reasons to own equities but this view is complicated by what is meant by this „ownership‟ (Steward, 1990).
According to Vittas (2003), the operating and investment performance of Mauritius, occupational pension funds varied over time. The data which was derived from the annual reports of self-administered pension funds over the period 1997 to 2001 reported that operating expenses have been on a rising trend, relative to both annual contributions and average assets. Among the operating costs such professional fees for auditors and actuaries and levies paid to the Authority are met by the employees. Other costs are incurred by the employers who are sponsors. Vittas also reported that pension funds in Mauritius had low operating expenses in comparison to the levels found in Chile and other Latin American countries or to personal pension plans in the United Kingdom (Vittas, 2003).
In Kenya, Kusewa (2007) studied the impact of regulation of the retirement benefits sector on financial performance of occupational schemes. The study was carried out on different pension schemes managed by three different insurance companies. From the study it was found that there is a linear relationship between the regulation of the retirement benefit sector and the financial performance of the occupational pension schemes.
Licensed under Creative Common Page 163 RESEARCH METHODOLOGY
Research Design
The research design employed in this study is a case study. This is considered to be the most suitable method since only one study unit; Pension schemes were studied. This method involved researching on a single unit or a few study units where many populations‟ elements exist.
Study population
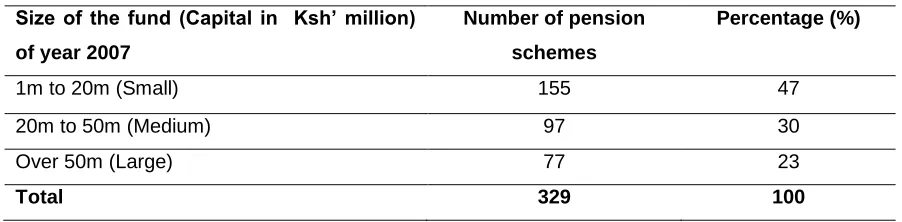
The population of the study comprised of all 329 pension schemes. The study mainly used secondary data that was obtained from the audited financial statements from year 2007 to 2009. Stratified random technique was used to group the pension schemes into three groups according to the size of the fund of base year 2007. The sample studied was selected from the accessible population.
Table 1. Target population
Size of the fund (Capital in Ksh’ million)
of year 2007
Number of pension
schemes
Percentage (%)
1m to 20m (Small) 155 47
20m to 50m (Medium) 97 30
Over 50m (Large) 77 23
Total 329 100
Sampling method and data collection procedures
Licensed under Creative Common Page 164 financial statements covering the period 2007 to 2009 financial years for the pension schemes sampled were analysed.
Table 2. Sampling Frame
Size of the fund (Capital in Ksh’ million)
Number of pension
schemes
Percentage (%) Sample size
1m to 20m (Small) 155 47 77
20m to 50m (Medium) 97 30 48
Over 50 m (Large) 77 23 39
Total 329 100 164
The study mainly used data from pension schemes for the past three years and categorized them into three (small, medium and large) groups according to the size of the fund for each pension scheme. The data was extracted from the audited financial statements of the sampled pension schemes. The data collected related to operating costs and financial performance of pension schemes, thus, data on profitability pension plan. In this study, R in the audited financial statements for each sampled pension scheme during the three years was analyzed. This period was considered long enough to provide sufficient variables to assist in ascertaining a trend on operating costs and financial performance of pension schemes.
Data Analysis and Reporting
Data on pension schemes for the past 3 years financial statements was analyzed using key performance indicators like financial ratios to ascertain the change in financial performance as a result of change in operating costs. Generally, the financial performance was done using ratios, such as, Return on Asset ratio, Return on Investment ratio and administration cost ratio, auditing cost ratio and trustee cost ratio as computed annually for each scheme category.
Licensed under Creative Common Page 165 The following model states some expected functional relationship between the dependent variables and independent variables in the following form:
0 1 1 2 2 3 3 4 4
i i
Y
x
x
x
x
Where,
Yi is the financial performance of pension scheme i measured by Return on Asset (ROA)
i
x
is the core administrative cost, investment cost, levy costs or auditing cost, where i=1,2,3,4
is the error termRESULTS AND DISCUSSION
Descriptive Statistics
This section illustrates the summary of statistics of the schemes involved in the study.
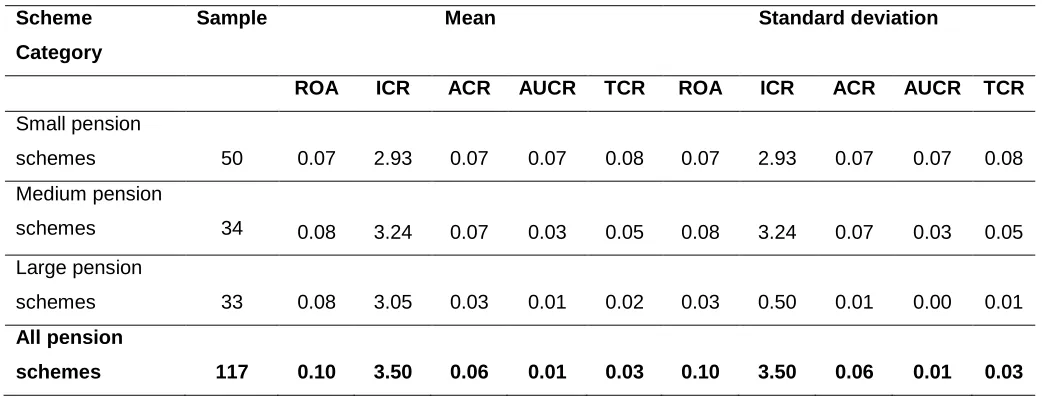
Table 3. Mean and Standard Deviation
Scheme
Category
Sample Mean Standard deviation
ROA ICR ACR AUCR TCR ROA ICR ACR AUCR TCR
Small pension
schemes 50 0.07 2.93 0.07 0.07 0.08 0.07 2.93 0.07 0.07 0.08 Medium pension
schemes 34 0.08 3.24 0.07 0.03 0.05 0.08 3.24 0.07 0.03 0.05
Large pension
schemes 33 0.08 3.05 0.03 0.01 0.02 0.03 0.50 0.01 0.00 0.01
All pension
schemes 117 0.10 3.50 0.06 0.01 0.03 0.10 3.50 0.06 0.01 0.03
ICR, ACR, AUCR and TRC represent investment cost, administration cost, auditing cost, and trustee costs respectively. In terms of financial performance focusing on Return on Assets, it was revealed that large and medium pension schemes performed better than the small schemes at 0.08. However, in terms of deviation, medium pension schemes had higher fluctuations at 0.08.
Licensed under Creative Common Page 166 their income, at a mean of 0.07, 0.07 and 0.08 respectively. Large pension schemes had low deviation on administration cost, auditing cost, and trustee cost.
Effect of Investment Cost on Financial Performance
Table 4. Regression Analysis of Return on Assets against Investment Cost Ratio
All schemes Small schemes Medium schemes Large schemes
Multiple R 0.860 0.728 485 0.961 0.865
R Square 0.740 0.531 0.923 0.748
Adjusted R Square 0.735 0.516 0.921 0.740
Standard Error 0.016 0.005 0.004 0.005
The coefficient of determination (R square-
R
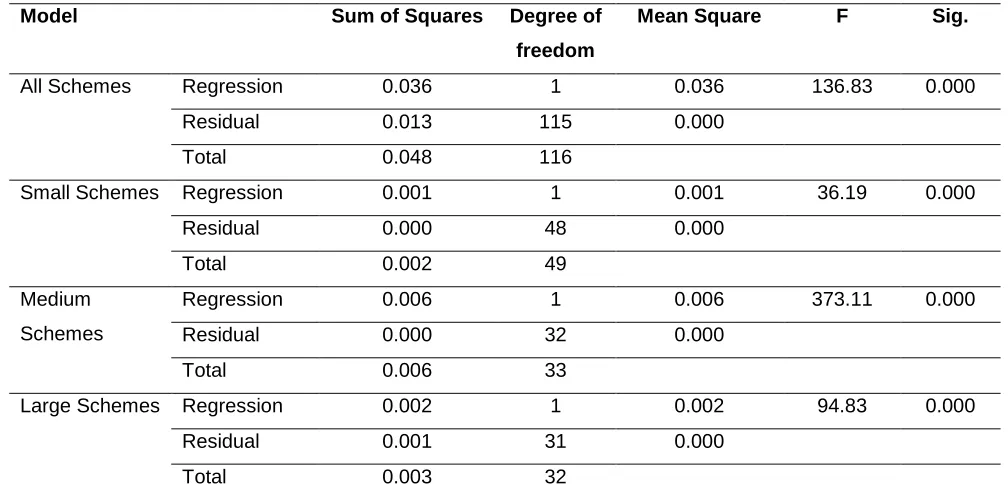
2) measures the proportion of variability in a data set that is accounted for by a statistical model. In terms of financial performance with a consideration on investment costs, the study revealed that for all the schemes involved in the study, 74% of the variation in return on asset ratio is explained by variation in the investment cost. For small pension schemes, the ratio is at 53.1% while for large pension schemes the ratio is at 74.8%. A high proportion of 92.3% of the variation in investment cost explained the variation in return on asset obtained for medium schemes.Table 5. ANOVA for Investment Cost Ratio
Model Sum of Squares Degree of
freedom
Mean Square F Sig.
All Schemes Regression 0.036 1 0.036 136.83 0.000
Residual 0.013 115 0.000
Total 0.048 116
Small Schemes Regression 0.001 1 0.001 36.19 0.000
Residual 0.000 48 0.000
Total 0.002 49
Medium Schemes
Regression 0.006 1 0.006 373.11 0.000
Residual 0.000 32 0.000
Total 0.006 33
Large Schemes Regression 0.002 1 0.002 94.83 0.000
Residual 0.001 31 0.000
Licensed under Creative Common Page 167 As with investment cost in Table 5, the regression model is higher than the residual model which means that investment cost does account too much of the variability on return on assets. Since sum of squares measures the variability of a data set, medium schemes exhibited the highest variation at 0.006, followed by large schemes at 0.002 and small schemes at 0.001.
Coefficients of Independent Variables
Table 6. Coefficients of Investment Cost Ratio
Model Unstandardized Coefficients t Sig.
B Std. Error
All Schemes Constant 0.074 0.004 19.054 .000
ICR -0.172 0.015 -11.698 .000
Small Schemes Constant 0.079 0.002 45.041 .000
ICR -0.115 0.019 -6.015 .000
Medium Schemes
Constant 0.135 0.004 35.973 .000
ICR -1.644 0.085 -19.316 .000
Large Schemes Constant 0.078 0.002 45.587 .000
ICR -0.158 0.016 -9.738 .000
Table 6 provides the quantification of the relationship between return on assets and investment cost. For small schemes, with every increase in a unit of investment cost, the return on asset decreases by 0.115 units. For medium schemes, with every increase in a unit of investment cost, the return on assets decreases by 1.644 units, while for large schemes, with every increase in a unit of investment cost, the return on assets decreases by 0.158 units. For all the pension schemes, with every increase in a unit of investment cost, the return on assets decreases by 0.172 units The Constant has no „practical‟ meaning as it gives the value of return on assets when investment cost is equal to zero.
The unstandardized coefficients are the coefficients of the estimated regression model. With respect to the return on assets, the following equations can be derived:
ROA = 0.074 -0.72 (ICR) + 0.015 (e) All pension schemes ROA = 0.079 -0.115 (ICR) + 0.019 (e) Small pension schemes ROA = 0.135 -1.644 (ICR) + 0.085 (e) Medium pension schemes ROA= 0.078 - 0.158 (ICR) + 0.016 (e) Large pension schemes
Licensed under Creative Common Page 168 The study revealed that there is an inverse relationship between return on asset and investment cost. The t-test shows that medium schemes exhibited the strongest relationship.
Effect of administrative Cost on Financial Performance
Table 7. Regression Analysis of Return on Assets against Administration Cost Ratio
All Pension
Schemes
Small Pension
Schemes
Medium Pension
Schemes
Large Pension
Schemes
Multiple R 0.888 0.860 0.865 0.820
R Square 0.788 0.740 0.748 0.672
Adjusted R Square 0.786 0.735 0.740 0.662
Standard Error 0.013 0.016 0.005 0.007
From Table 7, for all the 117 pension schemes involved in the study, 78.8% of the variation in return on assets is explained by the variation in administrative cost. For small pension schemes, variation in administrative cost ratio explains 74% of the variation in return of assets, while for medium pension schemes; this ratio is at 74.8%. On the other hand, for large pension schemes, variation in administrative cost to assets ratio explains 67.2% of the variation in return on asset.
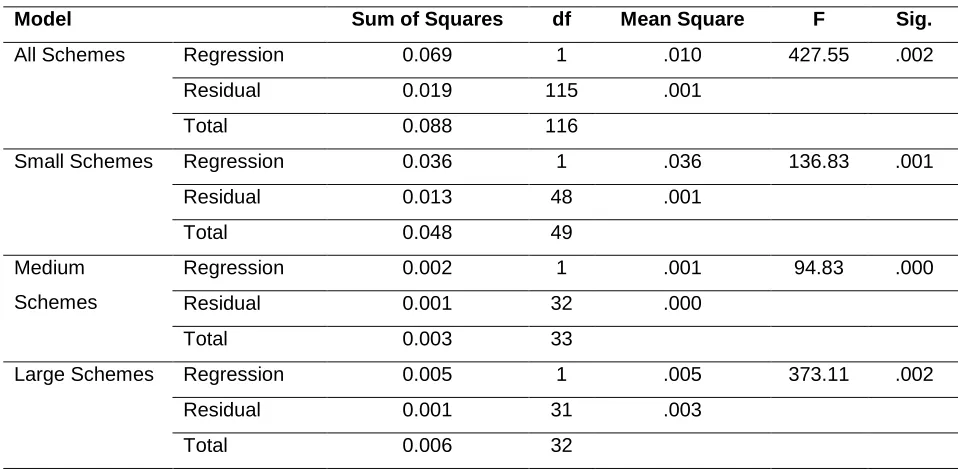
Table 8. ANOVA for Administration Cost Ratio
Model Sum of Squares df Mean Square F Sig.
All Schemes Regression 0.069 1 .010 427.55 .002
Residual 0.019 115 .001
Total 0.088 116
Small Schemes Regression 0.036 1 .036 136.83 .001
Residual 0.013 48 .001
Total 0.048 49
Medium Schemes
Regression 0.002 1 .001 94.83 .000
Residual 0.001 32 .000
Total 0.003 33
Large Schemes Regression 0.005 1 .005 373.11 .002
Residual 0.001 31 .003
Total 0.006 32
Licensed under Creative Common Page 169 residual. Thus the conclusion that the model does account for most of the variation on the dependent model, which is Return on Assets. This is confirmed by the level of significance being below our threshold of 0.05.
Sum of squares measures the variability of a data set and from the results on Table 8, small pension schemes exhibited the highest variability at 0.036 followed by large pension schemes at 0.005 and medium pension schemes at 0.002. This can be explained by the big number of schemes (50) of the small pension schemes involved in the study.
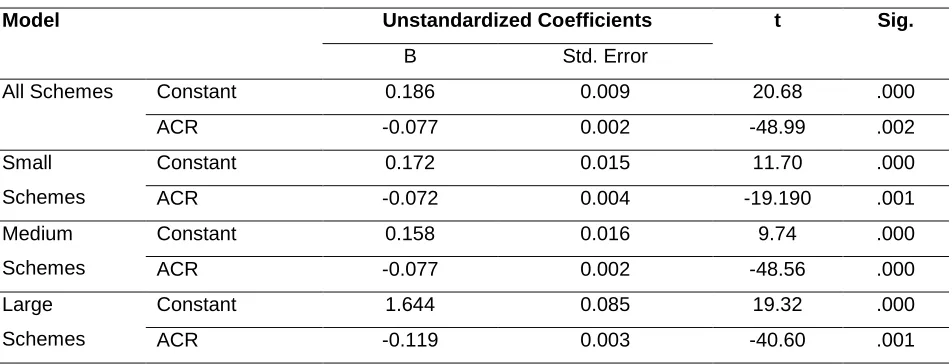
Table 9. Coefficients on Administration Cost Ratio
Model Unstandardized Coefficients t Sig.
B Std. Error
All Schemes Constant 0.186 0.009 20.68 .000
ACR -0.077 0.002 -48.99 .002
Small Schemes
Constant 0.172 0.015 11.70 .000
ACR -0.072 0.004 -19.190 .001
Medium Schemes
Constant 0.158 0.016 9.74 .000
ACR -0.077 0.002 -48.56 .000
Large Schemes
Constant 1.644 0.085 19.32 .000
ACR -0.119 0.003 -40.60 .001
Table 9 provides the quantification of the relationship between administration cost and return on assets. For, small schemes, with every increase in a unit of administration cost, the return on asset decreases by 0.072 units. For medium schemes, with every increase in a unit of administration cost, the return on assets decreases by 0.077 units, while for large schemes, with every increase in a unit of administration cost, the return on assets decreases by 0.119 units. For all the pension schemes, with every increase in a unit of administration cost, the return on assets decreases by 0.077 units, The Constant has no „practical‟ meaning as it gives the value of return on assets when administration cost is equal to zero.
The unstandardized coefficients are the coefficients of the estimated regression model. With respect to the return on assets, the following equations can be derived:
Licensed under Creative Common Page 170 There is an evidence of a negative relationship between return on asset ratio and administration cost ratio. The t-test determines the strength of the relationship, in which case, medium pension schemes and large schemes exhibited the strongest relationship.
Effect of Auditing Cost on Financial Performance
Table 10. Regression Analysis of Return on Assets against Auditing Cost Ratio
All schemes Small schemes Medium schemes Large schemes
Multiple R .275 .299 .015 .106
R Square .076 .089 .000 .011
Adjusted R Square .068 .070 -.031 -.021
Standard Error .034 .030 .007 .052
In terms of financial performance with a consideration on auditing cost, the study showed that for all the schemes involved in the study, 7.6% of the variation in return on asset ratio is explained by the variation in audit cost to assets ratio. For small pension schemes, the ratio is at 8.9% while for large pension schemes the ratio is just at 1.1%. Interestingly, there was no relationship between auditing cost and return on asset amongst the medium pension schemes.
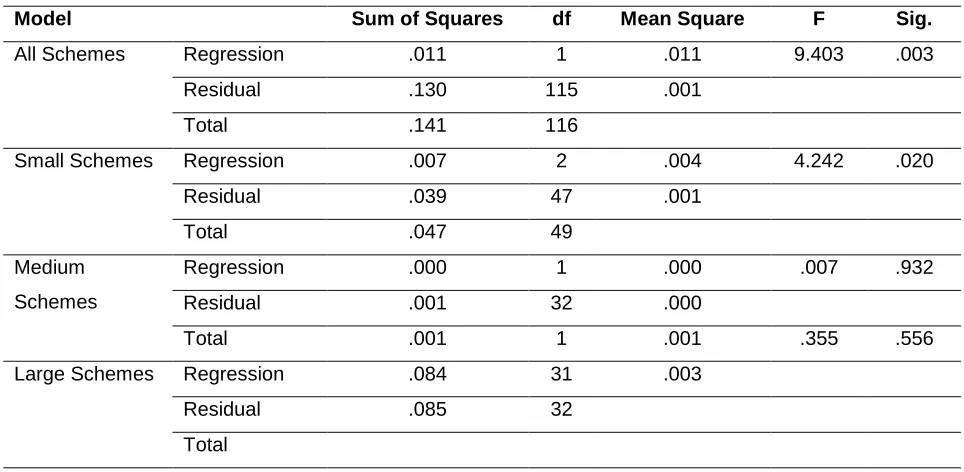
Table 11. ANOVA for Auditing Cost Ratio
Model Sum of Squares df Mean Square F Sig.
All Schemes Regression .011 1 .011 9.403 .003
Residual .130 115 .001
Total .141 116
Small Schemes Regression .007 2 .004 4.242 .020
Residual .039 47 .001
Total .047 49
Medium Schemes
Regression .000 1 .000 .007 .932
Residual .001 32 .000
Total .001 1 .001 .355 .556
Large Schemes Regression .084 31 .003
Residual .085 32
Total
Licensed under Creative Common Page 171 variability on return on assets. The bulk of the variations in return on assets are explained by other residual variable not examined in the study. The significance level being above our threshold of 0.05 confirms the significance of auditing cost ratio to return on asset to be low and confirmed by the F test. Since sum of squares measures the variability of a data set, large schemes exhibited the highest variation at 0.084, followed by small schemes at 0.007. There was no variability of a data set for medium schemes.
Table 12. Coefficients on Auditing Cost Ratio
Model Unstandardized Coefficients t Sig.
B Std. Error
All Schemes Constant .080 .004 18.768 .000
AUCR -.184 .060 -3.066 .003
Small Schemes Constant .079 .009 9.327 .000
AUCR -.173 .080 -2.171 .035
Medium Schemes
Constant .071 .002 31.300 .000
AUCR .008 .093 .086 .932
Large Schemes
Constant .090 .015 6.088 .000
AUCR -.601 1.009 -.596 .556
With respect to the return on assets, the following equations can be derived: ROA = 0.080- 0.184 (AUCR) + 0.06 (e) All pension schemes
ROA = 0.079- 0.173 (AUCR) + 0.80 (e) Small pension schemes ROA = 0.071+ 0.008 (AUCR) + 0.093 (e) Medium pension schemes ROA = 0.090 - 0. 601 (AUCR) + 1.01 (e) Large pension schemes Where, e is the error term.
From the analysis there is a negative relationship between return on asset with auditing cost to assets ratio, with the exception of the relationship for all medium schemes.
Effect of Trustee Cost on Financial Performance
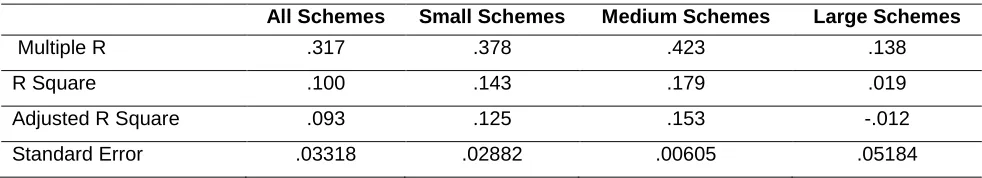
Table 13. Regression Analysis of ROA against Trustees‟ Cost Ratio
All Schemes Small Schemes Medium Schemes Large Schemes
Multiple R .317 .378 .423 .138
R Square .100 .143 .179 .019
Adjusted R Square .093 .125 .153 -.012
Licensed under Creative Common Page 172 The financial performance with regards to trustee cost showed that for all the schemes involved in the study, 10% of the variation in return on asset ratio is explained by the variation in trustee cost. For small pension schemes, 14.3% of the variation in return on asset ratio is explained by the variation in trustee cost while for large pension schemes the ratio is at 1.9%. A high proportion of 17.9% of variation in auditing cost determined the variation in return on asset amongst the medium schemes.
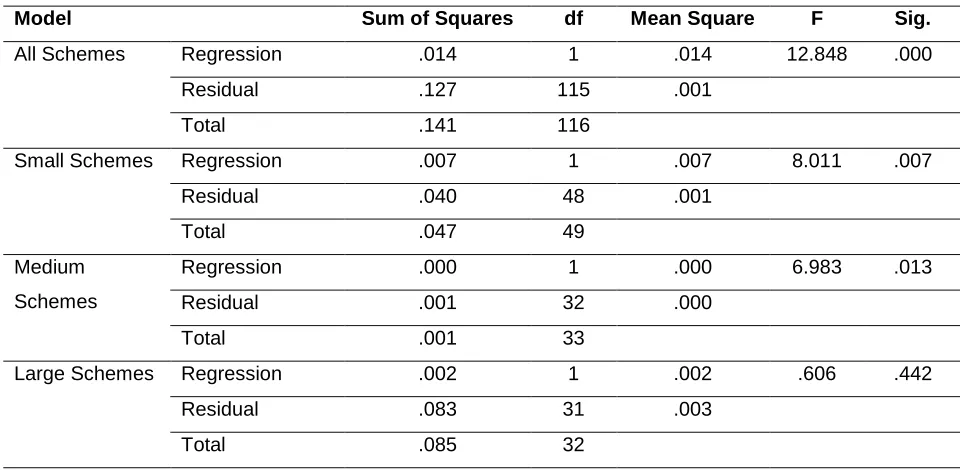
Table14. ANOVA for Trustees‟ Cost Ratio
Model Sum of Squares df Mean Square F Sig.
All Schemes Regression .014 1 .014 12.848 .000
Residual .127 115 .001
Total .141 116
Small Schemes Regression .007 1 .007 8.011 .007
Residual .040 48 .001
Total .047 49
Medium Schemes
Regression .000 1 .000 6.983 .013
Residual .001 32 .000
Total .001 33
Large Schemes Regression .002 1 .002 .606 .442
Residual .083 31 .003
Total .085 32
The findings in Table 14 show that the regression model is much lower than the residual model, which means that trustee cost ratio does not account too much of the variability on return on assets. The bulk of the variations in return on assets are explained by other residual variable that are not examined in this study. Since sum of squares measures the variability of a data set, small schemes exhibited the highest variation at 0.007, followed by large schemes at 0.002. There was no variability of a data set for medium schemes.
Table 15. Coefficients on Trustees‟ Cost Ratio
Model Unstandardized Coefficients t Sig.
B Std. Error
All Schemes Constant .084 .005 18.24 .000
TCR -.202 .056 -3.58 .000
Small Schemes
Constant .083 .008 10.32 .000
Licensed under Creative Common Page 173 Medium
Schemes
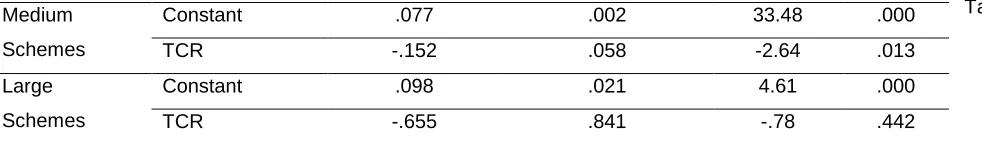
Constant .077 .002 33.48 .000
TCR -.152 .058 -2.64 .013
Large Schemes
Constant .098 .021 4.61 .000
TCR -.655 .841 -.78 .442
With respect to the return on assets, the following equations can be derived: ROA= 0.084- 0.202 (TCR) + 0.056 (e) All pension schemes
ROA= 0.083- 0.193 (TCR) + 0.068 (e) Small pension schemes ROA= 0.077- 0.152 (TCR) + 0.058 (e) Medium pension schemes ROA= 0.098- 0.655 (TCR) + 0. 841(e) Large pension schemes Where, e is the error term.
There is a negative relationship between return on asset with trustee cost on all categories of schemes. The t-test determines the strength of the relationship, in which case medium schemes exhibited the strongest relationship.
Effect of Operating Cost on Financial Performance
Table 16. Regression Analysis of ROA against TCR, ACR, AUCR, ICR
Model R R Square Adjusted R Square Std. Error of the Estimate
All Schemes 0.728 0.531 0.516 0.005
Predictors: (Constant), TCR, ACR, AUCR, ICR
The financial performance with regards to the combination of trustee cost, audit cost, administration cost and cost of investment showed that for all the schemes involved in the study, 53.1% of the variation in return on asset ratio is explained by the variation in operating costs.
Table 17. ANOVA for TCR, ACR, AUCR, ICR
Model Sum of
Squares
df Mean Square F Sig.
All Schemes Regression 0.00346 4 0.00346 63.59144 5.29E-09 Residual 0.001687 112 0.0000544
Total 0.005146 116
Predictors: (Constant), TCR, ACR, AUCR, ICR and Dependent Variable: ROA
Licensed under Creative Common Page 174 The findings shows that the regression model is higher than the residual model, which means the combination of trustee cost, audit cost, administration cost and cost of investment ratios does account to much of the variability on return on assets. The rest of the variations in return on assets are explained by other residual variable that are not examined in this study.
Table18. Coefficients on ICR, ACR, AUCR, TCR
Model Unstandardized Coefficients t Sig.
B Std. Error
All Schemes (Constant) .074 .073 45.041 0.000
ICR -0.115 .023 -6.015 0.000
ACR -.124 .098 -1.264 0.000
AUCR -.034 .111 -.311 0.000
TCR -.092 .148 -.620 0.000
Dependent Variable: ROA
This table shows the coefficients of the regression line. It states that the expected return on asset is equal to -0.115 * ICR + 0.074 + -.124 * ACR + 0.074 + -.034 * AUCR+ 0.074 +-.092 * TCR +0.074.
CONCLUSION AND RECOMMEDATIONS
The objective of the study was to determine how the operating cost affect the financial performance of occupational pension schemes in Kenya. Over the three year period (2007-2009), administrative cost and investment management cost were vital in determining the financial performance of pension schemes, no matter the size of the scheme fund.
Carrying out regressions tests, it was found out that there was a strong relationship between financial performance and investment management cost as well as administrative cost. It was revealed that 78.8% of the variation in administrative cost ratio explained financial performance in terms of return on assets for all the schemes. Still, 74% variation of the return on asset was explained by investment cost. However, there was a weak relationship between financial performance and auditing cost, since only 7.6% of the return on asset ratio was explained by auditing cost. Similarly, there was a weak relationship between financial performance and trustee cost, given that only 10% of the return on asset ratio was explained by trustee cost.
Licensed under Creative Common Page 175 except for auditing and trustee costs given that the residual on the sum of squares was less than the regression model. Therefore the model does account for most of the variation on the dependent variable, which is financial performance.
The analysis of the coefficients of independent Variables revealed that with every increase in a unit of investment cost, the return on asset decreased by a bigger margin amongst the medium schemes by 1.644 units, followed by large schemes by 0.158 units. For large schemes, with every increase in a unit of administration cost, auditing cost, and trustee cost, the return on asset decreased by bigger margins of 0.119 units, 0.601 units and 0.655 units respectively, as opposed to small and medium pension schemes. The t-test determined that large schemes exhibited the strongest direct relationship between return on asset and investment cost ratio. On administration, auditing and trustee cost large schemes exhibited the strongest inverse relationship.
Operating costs are critical for any business organization due to the need of maximizing returns to various organizational components, and also because of the impact such a decision has on a firm's ability to deal with its competitive and volatile environment effectively. Performance of pension schemes in financial terms is normally expressed in net interest earned, return on investment, and return on assets.
The findings indicate that operating cost ratio accounts for a big percentage of financial performance of all types of pension schemes. As such, high costs of administration and investments led to less income on retirement and a low annual rate of return since the expenses are paid from the pension funds. On the other hand, auditing and trustee cost do not account into a large extent the variability of return on asset, indicating a weak relationship between these costs and the financial performance of the pension schemes. The study recommends that trustees/authorities should monitor and regulate the operating cost incurred by the pension schemes.
Annual financial reports for some occupational pension schemes were missing within the three years which was considered as a limitation of the study. Pension schemes financial statement reports are also sensitive and hence the researcher would not use the real names in this the study.
REFERENCES
Kemal Avkiran, N. (1994). Developing an instrument to measure customer service quality in branch banking. International journal of bank marketing, 12(6), 10-18.
Licensed under Creative Common Page 176 Batema, H., &Mitchell,O.S. (2004). New Evidence on Pension Plan Design and Administrative Expenses: Australia Experience. Journal of Pension Economics and Finance 3, 63-76
Bikker, J., Steenbeck,O. &Torrachi,F. (2010).The Impact of scale, complexity and service quality on the administrative costs of pension funds.DNB working paper, no. 258/2010.
Chitembwe, S. (2007). The Role of NSSF in the Welfare and Development of the Kenyan Society. National Social Security Fund, Kenya, Paper Presented at the „Mijadala on Social Policy, Governance and Development in Kenya‟ sponsored by Development Policy Management Forum on 28 April, 2007 at Nairobi Safari Club.
Dvir, D. E., Segev, E., &Shenhar, A. (1993).Technology's varying impact in the success of strategic business units within the Miles and Snow typology, Strategic Management Journal, Vol. 14 No.2, pp.155-62.
Fields, A. and Tirtiroglu, D. (1991). Agency-Theory Implications for the Insurance Industry:AReview of the Theoretical and Empirical Research. Joseph Quarterly Journal of Business and Economics, Vol. 30, 1991 Gupta, V.K. (1981). Minimum efficient scale as a determinant of concentration, The Manchester School of Economic & Social Studies, Vol. 49 No.2, pp.153-64.
Jensen, M.C. &Meckling, W.H. (1976). Theory of the firm: managerial behaviour, agency costs and ownership structure. Journal of Financial Economics, 3, 305 - 60.
Kareithi A. (2009). Storm over control of multibillion pension scheme.The standard, January 21, 2009 Kusewa, L.M. (2007). The Impact of Regulation of the Retirement Benefits Sector on the Financial Performance of Occupational Pension Schemes in Kenya. Unpublished MBA Project, University of Nairobi.
Mansfield, E. (1979). Microeconomics.(3rd ed.). Norton, New York,
Mugenda O. M. and Mugenda A. G., (2003). Research Methods Qualitative and Qualitative Approaches, Acts Press, Nairobi
Mutuku, N. (2006). The trends and challenges for pension schemes. Research Paper RBA presented at Maseno University, Kenya.
Njuguna, G. (2009). Agency costs and financial performance in pension schemes in Kenya.Unpublished MBA Project, University of Nairobi.
Nyakundi, B. (2009). Pension Coverage in Kenya: Legal and Policy Framework required to encourage coverage in Kenya. Retrieved from www. ssrn. com.
Odundo, E. (2003). Retirement Benefits Authority, Kenya on Pensions Reforms: An Agenda for Sub-Saharan Africa Seminar, World Bank: Washington DC. [Online] Available: www.worldbank.org. (Retrieved 20 October 2010).
Pfeuti, E. (2010). Administration costs risking pension payouts. Financial Newspaper, Netherlands. Qian, G., Li, L. (2003). "Profitability of small and medium-sized enterprises in high-tech industries: the case of the biotechnology industry", Strategic Management Journal, Vol. 24 No.8, pp.881-7.
RBA (2007). Case File Interim Administration. RBA News, September 2006 Vol. 6 No. 1, pp. 3
Salvador V.P. (2008). A Theory of Contribution Density and Implications for Pension Design. The World Bank discussion paper no. 0828.
Valdes, P.(2007). A theory of contribution density and implication of pension design. Discussion paper no. 0828.