O R I G I N A L R E S E A R C H
Decomposing the effect of drug bene
fi
t program
on antihypertensive medication adherence among
the elderly in urban China
This article was published in the following Dove Press journal: Patient Preference and Adherence
Xiaochen Ma1,*
Yuji Zhang2,*
Mei Zhang2
Xiaoju Li2
Hongpo Yin2
Ke Li3 Mingxia Jing2
1China Center for Health Development
Studies, Peking University, Beijing 100000,
People’s Republic of China;2Department
of Public Health, Shihezi University School of Medicine, Shihezi 832002,
Xinjiang, People’s Republic of China;
3Department of Orthopedics, The First
Affiliated Hospital of the Medical College,
Shihezi University, Shihezi 832002,
Xinjiang, People’s Republic of China
*These authors contributed equally to this work
Purpose:Hypertension is a rapidly growing epidemic in People’s Republic of China, yet it
remains inadequately controlled. This study aimed to identify the relative contributions of program effects and patients’characteristics to the differences in antihypertensive medication nonadherence between drug benefit program enrollees and non-enrollees.
Patients and methods: Data were from a cross-sectional survey of 1,969
community-dwelling elderly adults with hypertension. Self-reported adherence was measured following previous studies in People’s Republic of China. The Blinder-Oaxaca nonlinear decomposi-tion method was used to identify the relative contribudecomposi-tions of program effects and patients’ individual characteristics.
Results: Eleven percent of the drug benefit program enrollees were nonadherent to their
medication, while 17% of non-enrollees were. Blinder-Oaxaca decomposition identified that over 60% of the gap between the two groups was due to the program effects (P=0.024). The rest could be explained by differences in observable characteristics (P<0.001), such as diabetic status, duration of hypertension, and blood pressure control.
Conclusion: The study confirmed that drug benefit program enrollees were more likely to
be adherent to their antihypertensive medication than non-enrollees in the context of People’s Republic of China.
Keywords:medication adherence, drug benefit program, decomposition, hypertension
Introduction
Hypertension is a major health problem and significantly contributes to morbidity and mortality worldwide.1Approximately 45% of Chinese adults aged 35–75 years have hypertension, only about 7.2% of whom have their blood pressure controlled.2 Nonadherence to antihypertensive medication regimen has long been recognized as a substantial roadblock to achieving better outcomes for patients with hypertension.3 The cost of medications, among other reasons, was one of the well-documented reasons that patients missed their doses either intentionally or unintentionally.4 To address this cost-related poor adherence issue, People’s Republic of China has piloted drug benefit programs to reduce the out-of-pocket costs of prescription drugs for eligible patients with chronic diseases at provincial level in recent years.5–7For example, starting 2015 in Xinjiang Uygur Autonomous Region, eligible hypertensive enrollees of Urban Employees Basic Medical Insurance (UEBMI) were provided with drug benefit program coverage for anti-hypertensive drugs.8–10
Correspondence: Mingxia Jing Department of Public Health, Shihezi University School of Medicine, 280 N 4th Road, Shihezi, Xinjiang Uyghur
Autonomous Region 832002, People’s
Republic of China Tel +1 829 937 7776
Email [email protected]
Patient Preference and Adherence
Dove
press
open access to scientific and medical research
Open Access Full Text Article
Patient Preference and Adherence downloaded from https://www.dovepress.com/ by 118.70.13.36 on 26-Aug-2020
Previous studies in other settings (mostly in the US) have found that drug benefit program coverage was asso-ciated with higher medication adherence,11–14 however, published research on the drug benefit program among patients with hypertension in the context of People’s Republic of China, is scarce. To date, most of the drug benefit programs in People’s Republic of China are in the early pilot stage of evaluation and adjustment. In order to improve the efficacy and targeting of those programs, rigorous quantitative evidence using data from People’s Republic of China is needed. Specifically, two questions need to be answered: first, how do you isolate the pro-gram's effect from differences in patients’characteristics? Drug benefit programs select different types of patients, so to what extent can the observed differences between pro-gram enrollees and non-enrollees be attributed to the effect of the program on the one hand and to the fact that patients in the two groups are systematically different to begin with on the other hand?15–18Second, how can the heterogeneity of program effects be understood? In other words, how can those patients who are more likely to respond to the program and achieve higher medication adherence be identified?
Tofill this gap, we used decomposition methodology to quantify the proportion of each risk factor which contri-butes to the differences in observed medication nonadher-ence according to drug benefit program enrollment status. Specifically, we had two objectives: first, to identify the relative contributions of program effects and patients’ individual characteristics. Second, to determine the those patients who would benefit better than others when cov-ered by the same drug benefit program.
Materials and methods
Setting and study design
Since January 2015, UEBMI piloted a drug benefit pro-gram which provided eligible enrollees (with hyperten-sion) with a 60%–80% reimbursement of medication cost with a deductible of 100 RMB (or US$15) and a limit of 1,500–2,000 RMB (or US$225–300) per year. A cross-sectional survey on medication adherence was performed from April to August 2016. The questionnaire included demographic characteristics, health conditions, access to care, drug benefit program coverage, and household income. In addition, medication adherence and blood pres-sure were meapres-sured. The study was approved by the Ethics Committee of the Shihezi University. During the survey
period, investigators read and explained the informed con-sent, and all patients gave written informed consent (signed or fingerprinted if illiterate) before the question-naire began. The data collected in the survey were then merged with insurance claims data to identify the drug benefit program enrollment status.
Study subjects
Participants were enrolled using the following criteria: individuals who: 1) were diagnosed with hypertension by clinical doctors with systolic blood pressure≥140 mmHg and/or diastolic blood pressure≥90 mmHg; 2) were man-aged by local community during the survey period; and 3) were taking at least one antihypertensive medication dur-ing the survey period.
The exclusion criteria were as follows: patients who: 1) had communication difficulties such as visual impairment and poor hearing; 2) exhibited severe cognitive impairment or had been diagnosed with dementia and mental disorder; 3) were too sick to participate in this study; and 4) were uncooperative.
For each respondent, blood pressure was measured with a sphygmomanometer three times at 45-second inter-vals 5–10 minutes after the completion of the question-naire. Ourfinal sample included 1,969 elderly adults with hypertension of whom 29.8% (n=586) were enrolled in drug benefit program.
Outcome measures and covariates
The outcome variable for this study was antihypertensive medication adherence, measured by a four-item interview instrument. This four-item interview instrument was based on previous studies conducted in a Chinese setting.19,20 Specifically, patients were asked: 1) can you take your antihypertensive medication every day based on the required frequency of your prescription? 2) Can you take your antihypertensive medication every day based on the required timing of your prescription? 3) Can you take your antihypertensive medication every day based on the required dose of your prescription? 4) Do you continu-ously take your antihypertensive medication? The first three questions were coded with 4-scale answers: 1) never complete, 2) sometimes complete, 3) usually com-plete, and 4) always complete. The last question was coded with different 4-scale answers: 1) discontinued the medication, 2) took the medications intermittently, 3) took the medications continuously but below the prescribed dose, and 4) took the medications continuously without
Patient Preference and Adherence downloaded from https://www.dovepress.com/ by 118.70.13.36 on 26-Aug-2020
interruption. The participants who chose either the third or the fourth options as answers to all four questions were identified as adherent; those who did not were considered as nonadherent. A binary variable of medication nonad-herence was used in data analysis.
Following Andersen’s behavioral model of health ser-vice use, the present study included covariates from the three dimensions: predisposing, enabling, and need-related factors.21,22 Predisposing factors described the propensity of individuals to use services, including gender, age, and education level. Enabling factors described the means and access that individuals have available to them for the use of services. Variables of annual household income, urban resi-dence, and frequency of clinic check-ups were included. Frequency of clinic check-ups was measured as a polyto-mous variable indicating how many times the individuals visited a clinic to monitor their health conditions over the past 12 months. Need factors reflected the most immediate cause for health services use, including diabetic status, duration of hypertension, and control of blood pressure. Diabetic status reflected the comorbid condition if a respon-dent had diabetes mellitus. Blood pressure control was defined as systolic blood pressure <140 mmHg and diastolic blood pressure <90 mmHg.
Statistical analysis
Group differences between enrollees and non-enrollees were examined by chi-squared test and the Mann– Whitney U test. Multiple logistic regression analysis was performed with medication nonadherence as the dependent variable for samples of enrollees and non-enrollees separately.
Due to the binary nature of our outcome variable, an extension of Blinder-Oaxaca decomposition method for nonlinear model was used to explain the disparities in medication nonadherence between enrollees and non-enrollees. The Blinder-Oaxaca decomposition method was originally developed to explain wage gaps between whites and blacks and between men and women since the seminal work of Oaxaca and Blinder in the early 1970s.23,24 The following equation described how the Blinder-Oaxaca decomposition method disentangled and quantified the nonadherence gap between enrollees and non-enrollees into two parts:
E Pð nPeÞ ¼ðE Z½ n E Z½ eÞβeþE Z½ nðβnβeÞ (1)
Where n represented non-enrollees and e represented enrollees; Z represented all the observed characteristics
that appeared in our study; β represented the estimated coefficients. Thefirst term in Equation (1) corresponded to the proportion of the gap in outcomes between two groups that were accounted for by group differences in the dis-tribution of observable characteristics (the explained com-ponent in decomposition literature)–in our case, the part caused by differences in patients' characteristics. The sec-ond term correspsec-onded to the proportion of the gap in outcomes between two groups that were accounted for by differences in the effects of these characteristics (the unexplained component in decomposition literature)– in our case, the part caused by differences in program effects. The “overall” explained and unexplained components could be further broken down into individual terms because of particular covariates which we described in the previous section as “detailed” explained and unex-plained decomposition components. All analyses were conducted using Stata 14.0 (Yun et al's work contains details of running the nonlinear Blinder-Oaxaca decompo-sition package).25
Results
Characteristics of study population
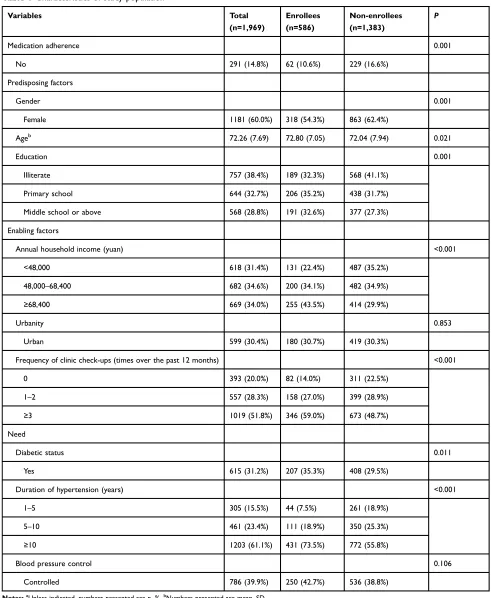
Table 1 provides descriptive statistics for all subjects as well as a comparison of all covariates between enrollment status. An amount of 10.6% of the program enrollees were not adherent to their antihypertensive medication, whereas 16.6% of non-enrollees were (P=0.001). Statistically sig-nificant differences were found in the level of all covari-ates, except for urbanity (P=0.853) and blood pressure control (P=0.106). Compared to non-enrollees, drug ben-efit program enrollees comprised less females (54.3% vs 62.4%), were older (72.8 vs 72.0), less illiterate (32.3% vs 41.1%), and more likely to live in higher income families (43.5% vs 29.9%). They were also more likely to have clinic check-ups (86.0% vs 77.5%), comorbidity of dia-betes (35.3% vs 29.5%), and duration of hypertension over 10 years (73.5% vs 55.8%).
Determinants of nonadherence by
enrollment status
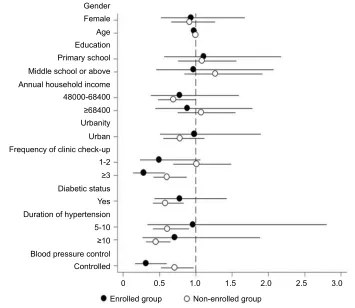
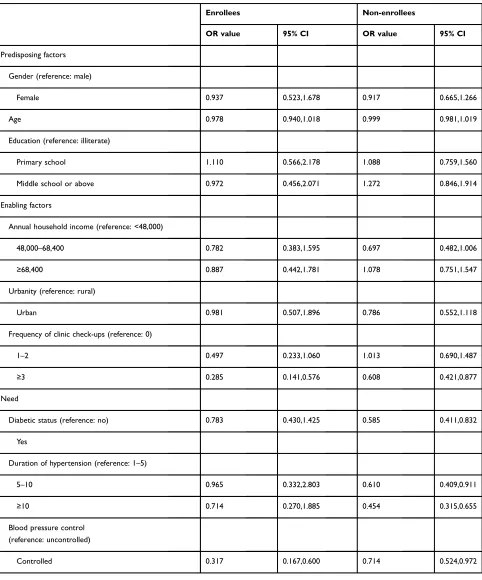
Figure 1plots the OR of the multiple logistic regression of medication nonadherence on to predisposing factors, enabling factors, and need covariates for enrollees and non-enrollees separately (details are shown in Table S1). None of the three predisposing factors including gender, age, and education was significantly associated with
Patient Preference and Adherence downloaded from https://www.dovepress.com/ by 118.70.13.36 on 26-Aug-2020
medication nonadherence in both groups. More than three times, clinic check-up visits was the only enabling variable that was significantly associated with medication
nonadherence, and with a negative sign in both groups. For the need factors, controlling blood pressure had a significant negative relationship with medication
Table 1Characteristics of study populationa
Variables Total
(n=1,969)
Enrollees (n=586)
Non-enrollees (n=1,383)
P
Medication adherence 0.001
No 291 (14.8%) 62 (10.6%) 229 (16.6%)
Predisposing factors
Gender 0.001
Female 1181 (60.0%) 318 (54.3%) 863 (62.4%)
Ageb 72.26 (7.69) 72.80 (7.05) 72.04 (7.94) 0.021
Education 0.001
Illiterate 757 (38.4%) 189 (32.3%) 568 (41.1%)
Primary school 644 (32.7%) 206 (35.2%) 438 (31.7%)
Middle school or above 568 (28.8%) 191 (32.6%) 377 (27.3%)
Enabling factors
Annual household income (yuan) <0.001
<48,000 618 (31.4%) 131 (22.4%) 487 (35.2%)
48,000–68,400 682 (34.6%) 200 (34.1%) 482 (34.9%)
≥68,400 669 (34.0%) 255 (43.5%) 414 (29.9%)
Urbanity 0.853
Urban 599 (30.4%) 180 (30.7%) 419 (30.3%)
Frequency of clinic check-ups (times over the past 12 months) <0.001
0 393 (20.0%) 82 (14.0%) 311 (22.5%)
1–2 557 (28.3%) 158 (27.0%) 399 (28.9%)
≥3 1019 (51.8%) 346 (59.0%) 673 (48.7%)
Need
Diabetic status 0.011
Yes 615 (31.2%) 207 (35.3%) 408 (29.5%)
Duration of hypertension (years) <0.001
1–5 305 (15.5%) 44 (7.5%) 261 (18.9%)
5–10 461 (23.4%) 111 (18.9%) 350 (25.3%)
≥10 1203 (61.1%) 431 (73.5%) 772 (55.8%)
Blood pressure control 0.106
Controlled 786 (39.9%) 250 (42.7%) 536 (38.8%)
Notes:a
Unless indicated, numbers presented are n, %.b
Numbers presented are mean, SD.
Patient Preference and Adherence downloaded from https://www.dovepress.com/ by 118.70.13.36 on 26-Aug-2020
nonadherence in both groups. Having diabetes and longer duration of hypertension were only significantly and nega-tively associated with medication nonadherence in the non-enrolled group.
Decomposing nonadherence gap between
enrolled and non-enrolled groups
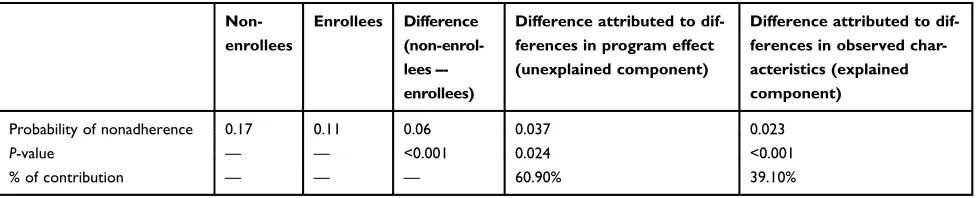
Table 2 presents the decomposition results for difference in medication nonadherence between enrollees and non-enrollees, using enrollees as the reference group. The probability of medication nonadherence for non-enrollees was 0.17, and 0.11 for program enrollees. The 6 percen-tage points gap between the two groups was largely due to the program effects (the unexplained component: 3.7 per-centage points or 60.9% in relative terms; P=0.024). Detailed decomposition analysis of the unexplained com-ponent (details are shown in Table S2) showed that the patients who had more clinic check-ups over the past 12 months (P=0.038), or those with controlled blood pressure (P=0.005) had lower medication nonadherence in the enrollees group compared with similar patients in the non-enrollees group (Figure 2). In other words, program
effects were positively associated with clinic check-ups and blood pressure control. We also found that program effects were negatively associated with having diabetes and longer duration of hypertension, although not statisti-cally significant.
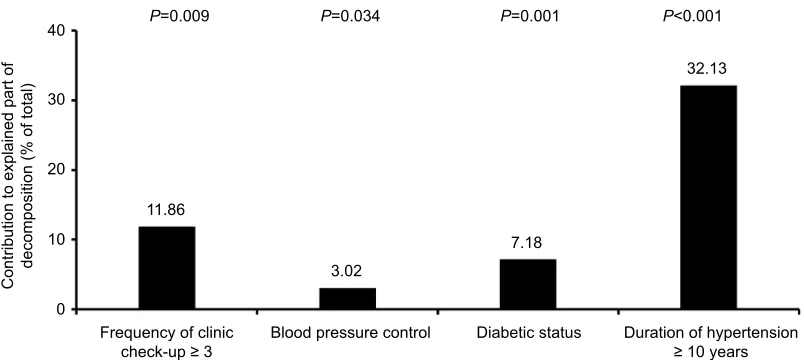
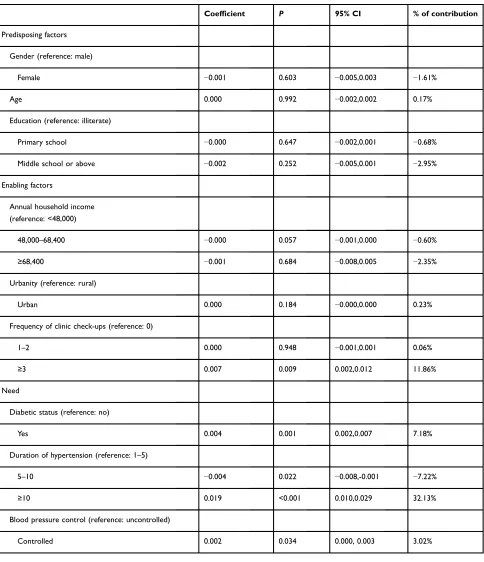
Differences in the levels of observable patient charac-teristics (or the explained component) accounted for 2.3 percentage points or 39.1% in relative terms (P<0.001) of the overall gap. Detailed decomposition analysis of the explained component (details are shown in Table S3) found that the differences in the level of need factors explained the greatest portion of the gap, accounting for 35.1%. Duration of hypertension was the most powerful explanatory variable in the model, increasing the gap by almost 32.1% (P<0.001), diabetic status increased the gap by 7.2% (P=0.001) (Figure 3).
Discussion
WHO listed nonadherence to medication as a“worldwide problem of striking magnitude”.26 This problem is parti-cularly relevant for the treatment of chronic diseases such as hypertension: on the one hand, missing doses more
Gender
Female
Age
Education
Primary school
Middle school or above
Annual household income 48000-68400
≥68400
Urbanity
Urban
Frequency of clinic check-up
Duration of hypertension
Blood pressure control
Controlled
0 0.5 1.0 1.5
Enrolled group Non-enrolled group
2.0 2.5 3.0 5-10
≥10 1-2
≥3
Diabetic status
Yes
Figure 1OR for medication nonadherence by drug benefit program enrollment status. Notes:The x-axis refers to magnitude of the OR. Black horizontal lines reflect 95% CIs.
Patient Preference and Adherence downloaded from https://www.dovepress.com/ by 118.70.13.36 on 26-Aug-2020
likely results in salient health and economic consequences in the longer term instead of short term; on the other hand, compliance to medications means costs to the patients and families on a daily basis.4,27 In our study, drug benefit program coverage that reduced the out-of-pocket expenses of hypertensive patients was associated with better media-tion compliance: non-enrollees were more than one and a half times likely to report medication nonadherence than enrollees of such program. The non-enrollees were more likely to be female, illiterate, living in lower income families, have shorter duration of hypertension, and less likely to have clinic check-ups, with comorbidity of dia-betes, compared to their counterparts in the enrolled group. This systematic difference in distribution of characteristics revealed in descriptive analysis was consistent with the
findings in other settings that drug benefit programs selected in different types of patients.28,29 It would be reasonable to expect that some of these group differences might explain the drug benefit program non-enrollees’ higher rates of medication nonadherence. Therefore, rig-orous quantitative investigation of the role of drug benefit program needed to take into account the relative contribu-tion of the group differences in patients’characteristics in order to isolate the program effects.
The decomposition analysis suggested that not only were drug benefit program enrollees different from non-enrollees – in other words, program selected in patients with different characteristics –but the program coverage itself might have an impact on medication adherence out-comes. Only about 40% of the gap in medication nonadher-ence between enrollees and non-enrollees can be explained by difference in the levels of observable characteristics (or the explained component). We found that need factors con-tributed to the major difference in medication nonadherence rather than predisposing factors and enabling factors. The
findings of the contribution of the duration of hypertension and comorbidity of diabetes on medication nonadherence
differences in the present study paralleled that of previous studies of medication nonadherence in the US Medicare population.16,17The majority of the gap (60%) in medica-tion nonadherence between enrollees and non-enrollees, however, was attributed to the program effect (or the unex-plained component). Previous studies suggested the remain-ing unexplained component might be caused by the fact that program coverage changes medication taking behaviors as well as the behaviors of physicians. For example, lower out-of-pocket medication spending might make patients more likely to take drugs,15,30–32and physicians might prescribe different types of antihypertension medications to program enrollees.18,33,34 However, our decomposition analysis could not help to explain whether it was those other factors that caused the medication nonadherence gap.
Previous studies about the role of drug benefit programs on medication adherence mostly used claims data in the US setting and applied standard regression analysis.4,30,35Hence, it was difficult to compare our findings. Nevertheless, our decomposition analysis improved the existing work from methodological and policy perspectives: first, Blinder-Oaxaca decomposition is an established methodology for investigating differences between groups, originally in the
field of social-economic inequalities.36In thefield of public health, decomposition analysis has been applied to study the disparities in health outcomes and health service utilizations according to race and other important social-economic variables.37–39Very few studies have applied the decomposi-tion method to investigate the effect of a program or treat-ment. One recent work using clinical data to decompose the source of differences in outcome between two type-2 dia-betes therapies was a welcome exception.40To our knowl-edge, our study was thefirst to apply decomposition analysis to investigate the effect of a drug benefit program on medica-tion adherence among elderly patients with hypertension in People’s Republic of China. Second, the decomposition analysis allowed us to quantify the proportion that each
Table 2 Blinder-Oaxaca nonlinear decomposition of the differences in medication nonadherence between drug benefit program
enrollees and non-enrollees
Non-enrollees
Enrollees Difference (non-enrol-lees– -enrollees)
Difference attributed to dif-ferences in program effect (unexplained component)
Difference attributed to dif-ferences in observed char-acteristics (explained component)
Probability of nonadherence 0.17 0.11 0.06 0.037 0.023
P-value — — <0.001 0.024 <0.001
% of contribution — — — 60.90% 39.10%
Patient Preference and Adherence downloaded from https://www.dovepress.com/ by 118.70.13.36 on 26-Aug-2020
covariate contributed to the differences in medication non-adherence by drug benefit program coverage. In particular, we were able to not only isolate the proportion of patient characteristics and program effect which contributed to the medication nonadherence gaps, but also the specific covari-ables that might be associated with higher program benefits if coverage was provided. Hence, our results were useful to shed some light on improving the efficacies and targeting of drug benefit programs.
Our study has several limitations. First, the observa-tional nature of our study limited the interpretation of our
findings to causal inference. We did not attempt to account for selection into the drug benefit program, which was by all means not random. There are a number of reasons why patients might choose to enroll in the program if eligible, and those same reasons might also influence their deci-sions to use medications. In previous studies of non-ran-dom assignment of program enrollment, instrumental
P=0.038 70
60 50 40 30 20 10 0 -10 -20
-30 -40 -50
Contribution to unexplained part of
decomposition (% of total)
P=0.005
46.93
-13.98
-45.01 P=0.432 P=0.406 60.55
Frequency of clinic check-up ≥ 3
Positive value = great increase in medication nonadherence when non-enrollees compared with enrollees. Negative value = great increase in medication nonadherence when enrollees compared with non-enrollees.
Blood pressure control Diabetic status Duration of hypertension ≥ 10 years
Figure 2Contribution of drug benefit program effects to antihypertensive medication nonadherence.
Notes:Other observed characteristics adjusted for in the decomposition analysis were gender, age, education, annual household income, urbanity, other frequency of clinic check-ups, and other duration of hypertension.
P=0.009 P=0.034 P=0.001 P<0.001
0 10 20 30 40
Contribution to explained part of
decomposition (% of total)
11.86
3.02
7.18
32.13
Frequency of clinic check-up ≥ 3
Positive value = great increase in medication nonadherence when non-enrollees compared with enrollees. Negative value = great increase in medication nonadherence when enrollees compared with non-enrollees.
Blood pressure control Diabetic status Duration of hypertension ≥ 10 years
Figure 3Contribution of observable characteristics to antihypertensive medication nonadherence.
Notes:Other observed characteristics adjusted for in the decomposition analysis were gender, age, education, annual household income, urbanity, other frequency of clinic check-ups, and other duration of hypertension.
Patient Preference and Adherence downloaded from https://www.dovepress.com/ by 118.70.13.36 on 26-Aug-2020
variables (IV) method was used to account for endogeneity issue.41 Future studies should consider applying IV to provide a better insight into causal inference of the pro-gram effect. Second, similar to standard regression analy-sis, the decomposition method had to concern about omitted variables. Although we have controlled a series of predisposing, enabling, and need factors that should predict medication adherence, it was possible that some potentially important confounding factors – for example, physician behaviors –were not included due to data lim-itations. In fact, our decomposition results showed the unexplained component absorbed more than half of the total disparity in medication nonadherence. In the decom-position analysis, we followed the decomdecom-position literature and interpreted the contribution of those additional unob-served variables to the total gap as the program effect (or unexplained component). However, if those variables were measured and included in the model, less of the total gap would be left as unexplained and therefore we might have a smaller program effect. Finally, our sample population in Xinjiang Uygur Autonomous Region might differ from other parts of People’s Republic of China, which might limit the generalization of our results. Although, the sam-ple in our study was from northern Han majority area, where the demographic characteristics are similar to the average People’s Republic of China.42,43
Conclusion
In summary, our study confirmed that drug benefit pro-gram enrollees were more likely to be adherent to their antihypertensive medication than non-enrollees. The decomposition analysis results showed that the drug ben-efit program accounted for most of the disparity in med-ication nonadherence. In view of the growing epidemic of hypertension and rapid pace of population aging in People’s Republic of China, we believ our findings shed light on designing polices for hypertensive patients and therefore achieving optimal hypertension management. Future research should include important factors such as medication taking or physician behavioral differences.
Acknowledgments
We sincerely acknowledge those patients who participated in the survey. We are grateful to Lu Mao, Yinxia Zheng, Wangfei Cui, Yanli He, Yan Huang, and all college stu-dents who participated in our survey for data collection. We would like to thank Rujiang Liang for STATA pro-gramming. We would also like to thank the Department of
Public Health, Shihezi University School of Medicine, for providing assistance.
Disclosure
The authors report no conflicts of interest in this work.
References
1. Olsen MH, Angell SY, Asma S, et al. A call to action and a lifecourse strategy to address the global burden of raised blood pressure on current and future generations: the Lancet commission on hyperten-sion. Lancet. 2016;388:2665–2712. doi:10.1016/S0140-6736(16) 31134-5
2. Lu J, Lu Y, Wang X, et al. Prevalence, awareness, treatment, and control of hypertension in China: data from 1.7 million adults in a population-based screening study (China PEACE Million Persons Project). Lancet. 2017;390(10112):2549–2558. doi:10.1016/S0140-6736(17)32478-9
3. Osterberg L, Blaschke T. Adherence to medication.N Engl J Med.
2005;353(18):487–497. doi:10.1056/NEJMra050100
4. Mojtabai R, Olfson M. Medication costs, adherence, and health
out-comes among Medicare beneficiaries. Health Aff (Millwood).
2003;22(4):220–229. doi:10.1377/hlthaff.22.4.220
5. Wang Y.Investigation and Prevention on Chronic Disease in China. Beijing: China Social Sciences Press;2011:39–40.
6. Zhong H. Effect of patient reimbursement method on health-care utilization: evidence from China. Health Econ. 2011;1312–1329. doi:10.1002/hec.1670
7. Zhang WJ.The Research of the Urban Employee Medical Insurance for Outpatient Health Service. Nanjing, Jiangsu, China: Southest University Press;2016:6–12.
8. Xinjiang Production and Construction Corps thirteenth division of government affairs network. Medical insurance policy guide. Available from: http://www.btnsss.gov.cn/gk/yewugongzuo/bdw/ 22109.htm. Accessed March 2,2018.
9. The Six Division of Wujiaqu City. Document on the uniform policy of the implementation corps of medical insurance policy of divison and city. Available from: http://www.wjq.gov.cn/xxbssg/100678.htm. Accessed March 2, 2018.
10. Shihezi City of Xinjiang. Document on the identification and appli-cation of drug benefit program in the urban employees basic medical insurance in 2015. Available from: http://www.shz.gov.cn/structure/
newSite/New_Channel_1/New_Page_2?infid=2558. Accessed March
2, 2018.
11. Chernew ME, Shah MR, Wegh A, et al. Impact of decreasing copayments on medication adherence within a disease management
environment. Health Aff. 2008;27(1):103–112. doi:10.1377/
hlthaff.27.1.103
12. Yu B, Zhang X, Wang G. Full coverage for hypertension drugs in rural communities in China.Am J Manag Care.2013;19(1):e22–e9. 13. Maimaris W, Paty J, Perel P, et al. The influence of health systems on
hypertension awareness, treatment, and control: a systematic litera-ture review. PLoS Med. 2013;10(7):e1001490. doi:10.1371/journal. pmed.1001490
14. Zhang YJ, Li XJ, Mao L, et al. Factors affecting medication adher-ence in community-managed patients with hypertension based on the principal component analysis: evisence from Xinjiang, China.Patient Prefer Adherence.2018;5(12):803–812. doi:10.2147/PPA.S158662 15. Doll JA, Hellkamp AS, Goyal A, Sutton NR, Peterson ED, Wang
TY. Treatment, outcomes, and adherence to medication regimens among dual Medicare-Medicaid-eligible adults with myocardial
infarction. JAMA Cardiol. 2016;1(7):787–794. doi:10.1001/
jamacardio.2016.2724
Patient Preference and Adherence downloaded from https://www.dovepress.com/ by 118.70.13.36 on 26-Aug-2020
16. Mazzaglia G, Ambrosioni E, Alacqua M, et al. Adherence to anti-hypertensive medications and cardiovascular morbidity among newly diagnosed hypertensive patients. Circulation. 2009;120(16):1598– 1605. doi:10.1161/CIRCULATIONAHA.108.830299
17. Bandi P, Goldmann E, Parikh NS, Farsi P, Bodenalbala B. Age-related differences in antihypertensive medication adherence in Hispanics: a cross-sectional community-based survey in New York city, 2011–2012.
Prev Chronic Dis.2017;14:E57. doi:10.5888/pcd14.160512
18. Cho MH, Yoo KB, Lee HY, et al. The effect of new drug pricing systems and new reimbursement guidelines on pharmaceutical expenditures and prescribing behavior among hypertensive patients in Korea.Health Policy.2015;119(5):604–611. doi:10.1016/j.healthpol.2015.01.002 19. Ye XQ, Lin FY, Chen WQ. Study on influence factoes of compliance to
antihypertensive medications.Mod Preventive Med.2007;34(3):494–496. 20. Ye XQ, Liu YL, Chen WQ. Knowledge, health beliefs in hyperten-sive patients and its influence on durg compliance. Chin J Nurs.
1998;33(11):624–626.
21. Aday LA, Andersen R. A framework for the study of access to medical care.Health Serv Res.1974;9(3):208–220.
22. Mekonnen HS, Gebrie MH, Eyasu KH, et al. Drug adherence for antihypertensive medications and its determinants among adult hypertensive patients attending in chronic clinics of referral hospitals
in Northwest Ethiopia. BMC Pharmacol Toxicol. 2017;18(1):27.
doi:10.1186/s40360-017-0134-9
23. Blinder AS. Wage discrimination: reduced form and structural esti-mates.J Hum Resour.1973;8(4):436–455. doi:10.2307/144855 24. Oaxaca R. Male-Female wage differentials in urban labor markets.Int
Econ Rev (Philadelphia).1973;14(3):693–709. doi:10.2307/2525981 25. Yun MS, Powers DA, Yoshioka H. Mvdcmp: multivariate decompo-sition for nonlinear response models.Stata J.2012;11(4):556–576. 26. De Geest S, Sabaté E. Adherence to long-term therapies: evidence for
action.Eur J Cardiovasc Nurs.2003;323. doi:10.1016/S1474-5151(03) 00091-4
27. Burnier M. Medication adherence and persistence as the cornerstone of effective antihypertensive therapy. Am J Hypertens. 2006;19 (11):1190–1196. doi:10.1016/j.amjhyper.2006.04.006
28. Zhang JX, Yin W, Sun SX, et al. The impact of the Medicare Part D prescription benefit on generic drug use.J Gen Intern Med.2008;23 (10):1673–1678. doi:10.1007/s11606-008-0742-6
29. Davidoff AJ, Stuart BT, Shoemaker JS, et al. Lessons learned: who didn’t enroll in Medicare drug coverage in 2006, and why?Health Aff.2010;29(6):1255–1263. doi:10.1377/hlthaff.2009.0002
30. Duru OK, Edgington S, Mangione C, et al. Association of Medicare Part D low-income cost subsidy program enrollment with increased
fill adherence to clopidogrel after coronary stent placement.
Pharmacotherapy.2014;34(12):1230–1238. doi:10.1002/phar.1502
31. Wei LL, Lloyd JT, Shrank WH. The relationship between the low-income subsidy and cost-related nonadherence to drug therapies in Medicare Part D.J Am Geriatr Soc.2013;61(8):1315–1323. doi:10.1111/jgs.12364 32. Yala SM, Duru O, Ettner SL, et al. Patterns of prescription drug
expenditures and medication adherence among Medicare Part D beneficiaries with and without the low-income supplement. BMC Health Serv Res.2014;14:665. doi:10.1186/s12913-014-0665-3 33. Kun YU, Cao J, Hua FU. Analysis of factors affecting physicians’
prescribing conduct.Chin J Hosp Admin.2002;18:92–94.
34. Chu HL, Liu SZ, Romeis JC. Assessing the effects of drug price reduction policies on older people in Taiwan.Health Serv Manage Res.2011;24(1):1–7. doi:10.1258/hsmr.2010.010016
35. Tran BX, Hwang J, Nguyen LH, et al. Cost-Related medication nonad-herence and cost-saving behaviors among patients with glaucoma before and after the implementation of Medicare part D.JAMA Ophthalmol.
2015;133(9):985–996. doi:10.1001/jamaophthalmol.2015.1671 36. O’Donnell O, Doorslaer EV, Wagstaff A, et al. Analyzing Health
Equity Using Household Survey Data: A Guide to Techniques and Their Implementation. The World Bank;2008:147–156. Available from: http://web.worldbank.org/archive/website01411/WEB/ IMAGES/HEALTHEQ.PDF. Accessed July 3, 2019.
37. Basu S, Hong A, Siddiqi A. Using decomposition analysis to identify modifiable racial disparities in the distribution of blood pressure in
the United States. Am J Epidemiol. 2015;182(4):345–353.
doi:10.1093/aje/kwv079
38. Mortensen K, Song PH. Minding the gap: a secomposition of emergency department use by Medicaid enrollees and the
unin-sured. Med Care. 2008;46(10):1099–1107. doi:10.1097/
MLR.0b013e318185c92d
39. Saito E, Gilmour S, Yoneoka D, et al. Inequality and inequity in healthcare utilization in urban Nepal: a cross-sectional observational study.Health Policy Plan.2016;31(7):817–824. doi:10.1093/heapol/czv137 40. Brekke L, Buysman E, Grabner M, et al. The use of decomposition
methods in real-world treatment benefits evaluation for patients with type 2 diabetes initiating different injectable therapies:findings from
the INITIATOR study. Value Health. 2017;20(10):1252–1259.
doi:10.1016/j.jval.2017.05.019
41. Jiang Y, Ni W. Estimating the impact of adherence to and persistence with atypical antipsychotic therapy on health care costs and risk of hospitaliza-tion.Pharmacotherapy.2015;35(9):813–822. doi:10.1002/phar.1634 42. Qin J, Wang J, Zhu D Analysis report of health services survey of
Xinjiang production and construction corps, 2010. Xinjiang
Production and Construction Corps Press;2013:68–69.
43. The Cebsus Office of the State Council. Tabulation on the 2010 Population Census of the People’s Republic of China. Beijing: China Statistics Press;2012:51–55.
Patient Preference and Adherence downloaded from https://www.dovepress.com/ by 118.70.13.36 on 26-Aug-2020
Supplemenatary materials
Table S1Logistic regression analysis between drug benefit program enrollees and non-enrollees
Enrollees Non-enrollees
OR value 95% CI OR value 95% CI
Predisposing factors
Gender (reference: male)
Female 0.937 0.523,1.678 0.917 0.665,1.266
Age 0.978 0.940,1.018 0.999 0.981,1.019
Education (reference: illiterate)
Primary school 1.110 0.566,2.178 1.088 0.759,1.560
Middle school or above 0.972 0.456,2.071 1.272 0.846,1.914
Enabling factors
Annual household income (reference: <48,000)
48,000–68,400 0.782 0.383,1.595 0.697 0.482,1.006
≥68,400 0.887 0.442,1.781 1.078 0.751,1.547
Urbanity (reference: rural)
Urban 0.981 0.507,1.896 0.786 0.552,1.118
Frequency of clinic check-ups (reference: 0)
1–2 0.497 0.233,1.060 1.013 0.690,1.487
≥3 0.285 0.141,0.576 0.608 0.421,0.877
Need
Diabetic status (reference: no) 0.783 0.430,1.425 0.585 0.411,0.832
Yes
Duration of hypertension (reference: 1–5)
5–10 0.965 0.332,2.803 0.610 0.409,0.911
≥10 0.714 0.270,1.885 0.454 0.315,0.655
Blood pressure control (reference: uncontrolled)
Controlled 0.317 0.167,0.600 0.714 0.524,0.972
Patient Preference and Adherence downloaded from https://www.dovepress.com/ by 118.70.13.36 on 26-Aug-2020
Table S2Contribution of drug benefit program effect to the differences in medication nonadherence between drug benefit program enrollees and non-enrollees
Coefficient P 95% CI % of contribution
Predisposing factors
Gender (reference: male)
Female −0.001 0.952 −0.030,0.028 −1.51%
Age 0.128 0.334 −0.131,0.387 213.92%
Education (reference: illiterate)
Primary school −0.001 0.960 −0.022,0.021 −0.94%
Middle school or above 0.007 0.545 −0.015,0.030 11.89%
Enabling factors
Annual household income (reference: <48,000)
48,000–68,400 −0.003 0.779 −0.026,0.019 −5.35%
≥68,400 0.007 0.629 −0.021,0.035 11.49%
Urbanity (reference: rural)
Urban −0.006 0.566 −0.024,0.013 −9.23%
Frequency of clinic check-ups (reference: 0)
1–2 0.016 0.104 −0.003,0.034 25.98%
≥3 0.036 0.038 0.002,0.070 60.55%
Need
Diabetic status (reference: no)
Yes −0.008 0.432 0.029,0.012 −13.98%
Duration of hypertension (reference: 1–5)
5–10 −0.007 0.436 −0.025,0.011 −11.76%
≥10 −0.026 0.406 −0.090,0.037 −45.01%
Blood pressure control (reference: uncontrolled)
Controlled 0.028 0.005 0.008, 0.048 46.93%
Patient Preference and Adherence downloaded from https://www.dovepress.com/ by 118.70.13.36 on 26-Aug-2020
Table S3Contribution of observed characteristics to the differences in medication nonadherence between drug benefit program enrollees and non-enrollees
Coefficient P 95% CI % of contribution
Predisposing factors
Gender (reference: male)
Female −0.001 0.603 −0.005,0.003 −1.61%
Age 0.000 0.992 −0.002,0.002 0.17%
Education (reference: illiterate)
Primary school −0.000 0.647 −0.002,0.001 −0.68%
Middle school or above −0.002 0.252 −0.005,0.001 −2.95%
Enabling factors
Annual household income (reference: <48,000)
48,000–68,400 −0.000 0.057 −0.001,0.000 −0.60%
≥68,400 −0.001 0.684 −0.008,0.005 −2.35%
Urbanity (reference: rural)
Urban 0.000 0.184 −0.000,0.000 0.23%
Frequency of clinic check-ups (reference: 0)
1–2 0.000 0.948 −0.001,0.001 0.06%
≥3 0.007 0.009 0.002,0.012 11.86%
Need
Diabetic status (reference: no)
Yes 0.004 0.001 0.002,0.007 7.18%
Duration of hypertension (reference: 1–5)
5–10 −0.004 0.022 −0.008,-0.001 −7.22%
≥10 0.019 <0.001 0.010,0.029 32.13%
Blood pressure control (reference: uncontrolled)
Controlled 0.002 0.034 0.000, 0.003 3.02%
Patient Preference and Adherence downloaded from https://www.dovepress.com/ by 118.70.13.36 on 26-Aug-2020
Patient Preference and Adherence
Dove
press
Publish your work in this journal
Patient Preference and Adherence is an international, peer-reviewed, open access journal that focusing on the growing importance of patient preference and adherence throughout the therapeutic conti-nuum. Patient satisfaction, acceptability, quality of life, compliance, persistence and their role in developing new therapeutic modalities and compounds to optimize clinical outcomes for existing disease
states are major areas of interest for the journal. This journal has been accepted for indexing on PubMed Central. The manuscript management system is completely online and includes a very quick and fair peer-review system, which is all easy to use. Visit http:// www.dovepress.com/testimonials.php to read real quotes from pub-lished authors.
Submit your manuscript here:https://www.dovepress.com/patient-preference-and-adherence-journal
Patient Preference and Adherence downloaded from https://www.dovepress.com/ by 118.70.13.36 on 26-Aug-2020