Process Parameters Optimization Using Jaya
Algorithm During Edm Machining Of Niti60 Alloy
Mahendra U Gaikwad, Krishnamoorthy A, Vijaykumar S Jatti
Abstract: Selection of appropriate process parameters for improving quality of product, time of machining largely depends upon the implementation of optimization techniques. This paper surveyed different traditional (Response surface methodology, Taguchi optimization, Grey regression analysis, Artificial neural network and Fuzzy logic techniques) and modern optimization techniques (Teaching learning based optimization, Accelerated Particle Swarm Optimization, Jaya optimization technique) with the intention to identify the effect of process parameters for improving output parameters in EDM machining process. It is observed that less study has been reported on Jaya optimization technique, hence the current research is focused on optimization of the process parameters (voltage, current, pulse on time an pulse off time) for improving material removal rate (MRR) and surface roughness(SR) during EDM machining of NiTi60 alloy. The experiments were conducted using L9 Taguchi orthogonal and mathematical predictions
models were generated using regression analysis. Jaya algorithms were developed with the intention to maximize the MRR and minimize the SR as the objective functions. Results obtained by Jaya algorithm were better than Taguchi optimization technique. Hence, it can be concluded that Jaya (modern) optimization technique can be effectively implemented to optimize the process parameters in EDM process.
Index Terms: Jaya Algorithm; EDM; NiTi60 Alloy; Material Removal Rate; Surface Roughness; Taguchi Optimization. —————————— ——————————
1.
INTRODUCTION
The input factor which influences the EDMed machined specimens or work piece are voltage, current, pulse on and pulse off time, type of dielectric fluid, material properties of electrode and specimen, etc need to be given considerable attention which affects the output parameters such as material removal rate (MRR), surface roughness (SR), electrode wear, etc [1].In order to improve these performance parameters, many researchers investigated their studies with the selection of input parameters, but unfortunately it is a difficult task till today. Also, it is important to note that, optimization of these input parameters by adopting proper optimization techniques such as taughi method, Response surface methodology (RSM), Grey regression analysis (GRE), Teaching learning based optimization (TLBO), Accelerated Particle Swarm Optimization (APSO), etc. is also a crucial task. The current paper discusses about researchers contribution towards implementation of these optimization techniques to optimize output parameters during EDM machining process. Many researchers had contributed their studies for optimization of EDM input parameters by using RSM technique out of which, Anish et al. [2] implemented RSM (Box-Behnken based) optimization technique by considering current, pulse on, pulse off, as input process parameters to improve MRR and SR during EDM machining of titanium alloy.
They found that with increment in current leads to improve MRR by the loss of SR they also observed that MRR, SR was fitted properly with experimental results at 95 % confidence level. Prajapati et al. [3] used RSM technique by considering pulse on, pulse off time, voltage, wire feed & wire Tension on MRR, SR, Kerf width during wire-EDM machining of AISI A2
tool steel. They found that pulse on, and pulse off parameter is significant for MRR and SR while voltage is significant for kerf width. They also observed that the normal probability distribution for all trials indicated high confidence level. Sanjay Kumar et al. [4] investigated effect of input parameters (pulse current, pulse on time & pulse off time) on output parameters (MRR, SR and electrode wear) during EDM machining process. The influence of these parameters was carried out by multi response analysis. They found the better combination with 5A current, 60μs pulse on time and 45μs pulse off time for improvements in output parameters. Kumar et al. [5] used RSM (quadratic mathematical model) technique to optimize wire-EDM input parameters (pulse on time, pulse off time, wire speed and wire feed) for improvements in MRR and SR during machining of Al-sic (20%) material. They observed pulse on time, pulse off time, wire speed and wire feed plays a significant role for MRR and SR. Many researchers had contributed their studies by adopting taughi method, out of which, Takale et al. [6] carried out Wire EDM machining to optimize input parameters (Gap voltage, capacitance, wire feed and wire tension) for development in MRR , SR, Kerf width by taughi method during machining of shape memory alloy (Ti49.4-Ni50.6) for orthopedic application. They found the best combination with voltage-140V, Capacitance -0.4μF, and wire feed- 30μm/sec for maximum MRR and minimum SR and kerf width. Vikasa et al. [7] conducted EDM machining of EN41 material with variation in input parameters (pulse on time, pulse off time, current and voltage) for minimizing SR. they found current is significant factor as compared to others for minimizing SR. The results carried out at 95 % confidence level show that the predicted values are very close with the experimented values. Rao et al. [8] suggested that taughi method is suitable for single performance parameters but cannot be used for multiple performance optimizations. In connection to this to overcome this problem, many authors coupled taughi method with other optimization technique. Out of which, S V Subrahmanyam et al. [9] implemented grey based taughi method by variation in input parameters (discharge current, pulse on time, pulse off time spark voltage, wire tension, wire feed, servo feed and flushing pressure of dielectric fluid) to optimize (parametric optimization) MRR and SR during wire EDM machining of hot die tool steel (H13) material. They observed that grey-taughi method is the ideal ————————————————
Mahendra U Gaikwad, Research Scholar, Department of Mechanical Engineering, Sathyabama Institute of Science and Technology, Chennai, India. [email protected] Krishnamoorthy A, Professor, Department of Mechanical
Engineering, Sathyabama Institute of Science and Technology, Chennai, India. [email protected]
Vijaykumar S Jatti, Associate Professor, Department of Mechanical Engineering, D. Y. Patil College of Engineering, Akurdi, Savitribai Phule Pune University, India.
1169 and effective for optimization of multiple performance
characteristics (MRR and SR). Somashekhar et al. [10] used taughi method by coupling with grey regression analysis method for multi-objective optimization during micro-WEDM process, the obtained results shows development in output parameters achieved successfully. Many researchers had contributed their studies by adopting Grey Regression Analysis (GRA), artificial neural network method and fuzzy logic technique out of which, Manjaiah et al. [11] used GRA optimization technique for optimization of input parameters (pulse on time, pulse off time, servo voltage, dielectric fluid pressure and wire speed) for improving MRR and SR parameters during Wire EDM machining of shape memory alloy. The result shows that Pulse on time is significant factor influencing responses MRR and surface roughness because by the increase in pulse on time and servo voltage MRR and SR founds to be increased. Jagadish et al. [12] implemented GRA technique for input parameters optimization for green EDM machining (free from toxic gases produced during machining). They found the best combination of process parameters with current- 4.5A, Pulse duration- 261 µs, dielectric fluid level- 40mm, and flushing pressure -0.3 kg/cm and successfully achieved improvements in output parameters. Majumder et al. [13], used general regression neural model for wire-EDM parameters optimization during machining of shape memory alloy. They achieved improvements in SR and micro hardness with the parameter combination of pulse on- 10s, cuttent-12 A, wire tension-12 N, wire speed-150 mm/s. The ANOVA result indicates that pulse on time was the most significant for SR. Ugrasen et al. [14], adopted artificial neural network method to optimize wire-EDM parameters (pulse-on, pulse-off, current and bed speed, voltage) for maximizing MRR and minimizing SR. During their investigation they found that current is the most significant factor for improving MRR and SR. Sengottuve et al.[15] used fuzzy logic model to correlate input (pulse on time, pulse off time, peak current, flushing pressure and electrode geometry) and output parameters (MRR, SR, electrode wear) during EDM machining of Inconel 718 material. They found best combination with current -15A, pulse on time -63μs, electrode geometry-rectangular and flushing pressure-9kgf/cm2. They concluded that fuzzy model proves to be precise and best method for achieving maximum MRR, and minimum TWR & SR. The result also indicates good validation between fuzzy and experimental results. Others researcher contributed their efforts by implementing advanced optimization techniques such as Teaching Learning Base Optimization (TLBO), Accelerated Particle Swarm Optimization (APSO)and Jaya optimization techniques, out of which, Tiwari [16], conducted a review on TLBO technique and suggested that, TLBO can be
used for conventional (milling, grinding, turning) as well as non conventional machining (electrochemical, laser beam, EDM) process. They also concluded that TLBO gives better results as compared with other optimization techniques (taughi, Grey regression analysis, etc.) which finds application in various fields of engineering (chemical, civil, production engineering). Muthukumar et al. [17] used APSO optimization technique for wire EDM machining of AISI D3 die-steel and suggested that APSO technique can be effectively used to optimize MRR and SR. Das et al. [18] used Jaya optimization technique for optimizing MRR, SR and electrode wear rate during EDM machining of nickel alloy. They achieved maximum MRR by increasing the current (up to 24A) and obtained improvements in SR by reducing the current (up to 6A). Pawade et al. [19] also used Jaya optimization technique during turning operation performed on steel material. They considered tool nose radius, cutting speed, feed rate, and depth of cut as process parameters while SR and cutting force considered as output parameters. They concluded that, increase in nose radius causes the SR to decrease while cutting force increases at low cutting speed, feed rate and depth of cut. The objective function SR and cutting force are found to be reduced from 0.3340 to 0.1856μm and 55.463 to 41.706N in just five iterations. After extensive literature review it can be observed that less study has been reported on Die sink EDM machining of NiTi60 alloy. Also less investigation on process parameter optimization using Jaya algorithm during EDM machining of NiTi60alloy has been reported. It is also observed that little investigation has been conducted to improve MRR and SR as an objective function by using Jaya algorithm.
2
EXPERIMENTAL
PROCESS
In this portion, different aspects starting from material selection, EDM type, electrode material, machine input and output parameters are explained. The work material selected during die sink EDM machining is NiTi alloy (Ni-60% and Ti-40%). The size of sample was 10*10*5 mm rectangular cross section was decided. Copper is selected as an electrode material and commercial oil is used as dielectric medium during this machining process. Voltage (V), current (C), Pulse on time (Ton), pulse off (Toff) are considered as machine inputs while MRR and SR considered as output factors. With the help of DOE optimal machining factors can be determined, as DOE is an efficient tool [20]. EDM process consists of various input factors out of which current, voltage, the pulse on time and pulse off time were selected during machining process. The input factors along with their levels of operation are shown in the table 1 below. For this work Taguchi DOE method is selected for optimization, as it is one of the superior methods [21]. L9 orthogonal array method is employed in this
work by considering MRR and SR as an output factors, as shown in the table 2 below. Estimation of MRR is done with the use of equation (1) as shown below.
MRR= (Wi- Wf)* di /t ………. (1)
Where, Wi: Specimen weight prior machining (mm3), Wf: Specimen weight after machining (mm3), MRR: Material removal rate (mm3/min), di: Density of work piece, t: Machining time.
TABLE1
MACHINING PARAMETERS
Input factors Level 1 Level 2 Level 3
Voltage 40 55 80
Current 4 6 8
Pulse On 20 40 60
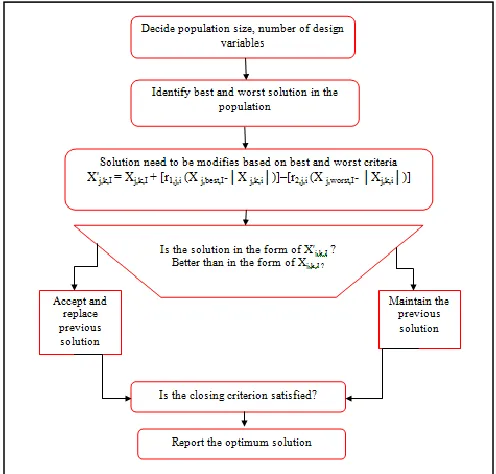
Jaya optimization is used to determine the best and worst solution from various numbers of solutions. If f (X) is the objective function to be maximized or minimized, then the best and worst solution is determined with the help of following equation (2).
X'j,k,I = Xj,k,I + [r1,j,i (X j,best,I-│X j,k,i│)]–[r2,j,i (X j,worst,I- │Xj,k,i│)] …(2)
Where,
X j,best,I: value of j variable for the best solution.
X j,worst,I: value of j variable for the worst solution. X'j,k,I: updated value of Xj,k,I,
r1,j,i and r2,j,i: random numbers for the jth variable during the ith iteration having range from 0 to 1.
X'j,k,I is accepted if it gives better function value. The Jaya algorithm is explained with the help of flowchart shown in Fig. 1.
During the iteration of Jaya optimization, all the accepted function values are maintained till the end of iteration and these values become the input to the next iteration [5].
3 RESULTS
AND
DISCUSSIONS
In this section main effect plots, residual plots, Jaya optimization results, and convergence of MRR and SR are discussed one by one. Based on the results for MRR and SR the main effect plots and residual plots are obtained using Minitab 18.1.0 software.
3.1 Effect of Input parameter on MRR and SR
The portion of material take out from the work piece in a unit time is known as MRR which is controlled by machining parameters (C,V, Pon, Poff), work piece and electrode material, size and shape of tool and work piece [22]. In this research MRR is determined based on variation in machining parameters C, V, Pon and Poff as shown in the figure (2) below. It is observed that increase in current causes spark energy and temperature of work piece to raise which in turn causes MRR to increase quickly [22].Table (2) and below figure (2) shows that maximum MRR-0.399mm3/min was achieved when current was high-8A, low voltage-40V, high Pon-60µs, high Poff- 9 µs during EDM machining of nitinol material. Increase in Pon causes plasma channel to become broad which helps to improve MRR [22], Hence it can be concluded that current and Pon are the most significant factor for MRR. SR reflects the quality of machined work piece hence needs to be given special attention during EDM machining [22]. In EDM process SR depends upon intensity of a spark, size of crater, and current parameters maintained during machining process [22] With reference to table (2) and figure (3), it is observed that minimum SR -2.787 µm was obtained for low voltage-40V, low current-4 A, low Pon-20 µs and low Poff-5 µs. Another noticeable point is that MRR was also low-0.149 mm3/min for low SR value. It is also observed that maximum SR-6.348 µm was obtained for high voltage-80V, high current-8A, moderate Pon-40 µs and low Poff-5 µs. Hence, it can be concluded that for the variation of SR (from 2.787 µm to 6.348 µm) voltage and current are the most significant factors. Residual plots for MRR and SR show in the
TABLE2
EXPERIMENTAL RUN ALONG WITH OBSERVED VALUES
Runs Voltage (V)
Current (A)
Pulse ON (Pon)
Pulse Off (Poff)
MRR (mm3/min)
SR (µm)
1 40 4 20 5 0.149 2.787
2 40 6 40 7 0.290 3.696
3 40 8 60 9 0.399 4.259
4 55 4 40 9 0.148 3.399
5 55 6 60 5 0.149 3.499
6 55 8 20 7 1.190 6.100
7 80 4 60 7 0.280 5.099
8 80 6 20 9 0.448 6.198
9 80 8 40 5 0.270 6.348
TABLE1
MACHINING PARAMETERS
Input factors Level 1 Level 2 Level 3
Voltage 40 55 80
Current 4 6 8
Pulse On 20 40 60
Pulse Off 5 7 9
1171 figure (4) and (5) indicates that histogram plot is nearly
symmetric and for normal probability plot all data lies on the straight line with little deviation hence it can be concluded that there was no error in data collection and analysis.
4 CITATIONS
3.2 Regression Analysis of MRR and SR
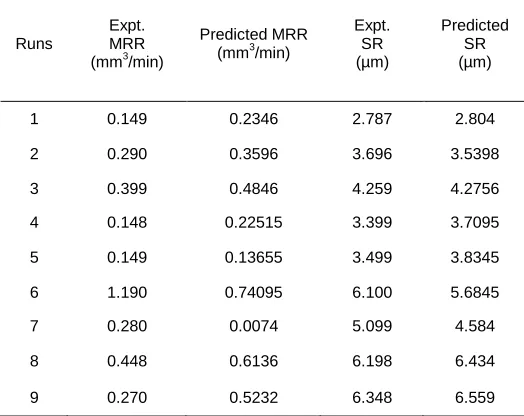
Regression analysis was developed for MRR and SR the following equation (3) and (4) indicates the same. It is important to find out the correlation between the experimented and predicted (regression) values of MRR and SR as mentioned in the table (3). It is observed from the below figure (6) and (7) that there is a close agreement between the predicted and experimented values of MRR and SR.
Regression equation for MRR
= 0.232 + 0.00053 Vtg +0.1068 Crt -0.00799 Pon +0.0356 Poff
(3)
Regression equation for SR
= 1.46 +0.05798 Vtg +0.4518 Crt -0.01857 Pon +0.1018 Poff
(4)
TABLE2
COMPARISON OF EXPERIMENTAL VALUE WITH PREDICTED
Runs
Expt. MRR (mm3/min)
Predicted MRR (mm3/min)
Expt. SR (µm)
Predicted SR (µm)
1 0.149 0.2346 2.787 2.804
2 0.290 0.3596 3.696 3.5398
3 0.399 0.4846 4.259 4.2756
4 0.148 0.22515 3.399 3.7095
5 0.149 0.13655 3.499 3.8345
6 1.190 0.74095 6.100 5.6845
7 0.280 0.0074 5.099 4.584
8 0.448 0.6136 6.198 6.434
9 0.270 0.5232 6.348 6.559
Fig. 2.Effect of Input parameter on MRR
Fig. 3Effect of Input parameter on SR
Fig. 4 Residual Plot for MRR
3.3 Parameters optimization using JAYA algorithm
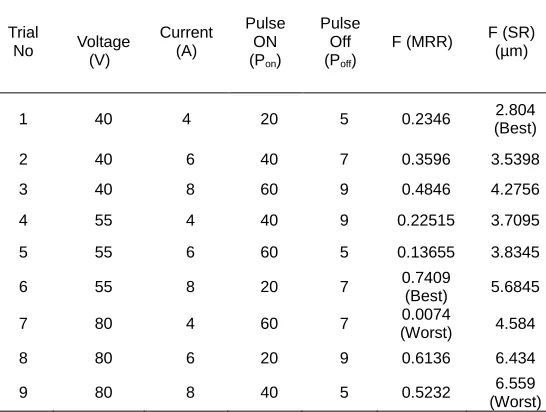
An advanced optimization technique named as Jaya algorithm is implemented in this research work, with the objective to maximize the function of F(MRR) and to minimize the function F(SR). Optimization was carried out with a population size of 9, process variables were voltage, current, Pon, Poff with in numbers of iteration 10. The initial population is randomly created within the range of process parameters as mentioned in the following equation (5) and (6) and the corresponding objective function values obtained are mentioned in the below table no.(3). For maximization function highest value is considered as best while lowest value is considered as worst and vice versa for minimization case.
For Maximization function, F(MRR)= -0.232 + 0.00053 Vtg +0.1068 Crt -0.00799 Pon +0.0356 Poff
Subjected to 40≤ Vtg ≤ 80, 4 ≤ Crt≤ 8, 20 ≤Pon ≤ 60, 5 ≤ Poff ≤
9 (5)
For Minimization fuction, F(SR)= -1.46 +0.05798 Vtg +0.4518 Crt -0.01857 Pon +0.1018 Poff
Subjected to 40≤ Vtg ≤ 80, 4≤ Crt≤ 8, 20 ≤Pon ≤ 60, 5 ≤ Poff
≤ 9 (6)
It can be observed from the table no.(3) for maximizing MRR the best solution value is 0.7409 (trial 8th) and the worst
solution value is 0.0074 (trial 7th) similarly for minimizing SR
the best solution value is 2.804 (trial 1st) and the worst solution value is 6.559 (trial 9th) now the objective is to improve the best solution values for which 10 iterations were carried out. By assuming random values of input process variables within their working range the objective function values seems to be improving as mentioned in the below table no (4), hence the objective of Jaya algorithm moving towards the best is satisfied. It can be observed from the table no.(4) for maximizing MRR the best solution value is 0.758 (trial 8th) and the worst solution value is 0.651 (trial 1st) similarly for
TABLE4
UPDATED VALUES OF THE VARIABLES AND THE OBJECTIVE FUNCTION DURING 10TH
GENERATIONS
Trial
No Voltage (V)
Current (A)
Pulse ON (Pon)
Pulse Off (Poff)
F (MRR) F (SR) (µm)
1 40 4 20 5 0.2346 (Best) 2.804
2 40 6 40 7 0.3596 3.5398
3 40 8 60 9 0.4846 4.2756
4 55 4 40 9 0.22515 3.7095
5 55 6 60 5 0.13655 3.8345
6 55 8 20 7 0.7409
(Best) 5.6845
7 80 4 60 7 0.0074
(Worst) 4.584
8 80 6 20 9 0.6136 6.434
9 80 8 40 5 0.5232 6.559
(Worst)
TABLE3
INITIAL POPULATION OF MRRANDSR
Trial No Voltag e (V) Curren t (A) Pulse ON (Pon)
Pulse Off (Poff)
F (MRR)
F (SR) (µm)
1 40 4 20 5 0.2346 2.804
(Best)
2 40 6 40 7 0.3596 3.5398
3 40 8 60 9 0.4846 4.2756
4 55 4 40 9 0.2251
5 3.7095
5 55 6 60 5 0.1365
5 3.8345
6 55 8 20 7 0.7409
(Best) 5.6845
7 80 4 60 7
0.0074 (Worst
)
4.584
8 80 6 20 9 0.6136 6.434
9 80 8 40 5 0.5232
6.559 (Worst
) TABLE3
INITIAL POPULATION OF MRRANDSR
Trial
No Voltage (V)
Current (A)
Pulse ON (Pon)
Pulse Off (Poff)
F (MRR) F (SR) (µm)
1 40 4 20 5 0.2346 2.804
(Best)
2 40 6 40 7 0.3596 3.5398
3 40 8 60 9 0.4846 4.2756
4 55 4 40 9 0.22515 3.7095
5 55 6 60 5 0.13655 3.8345
6 55 8 20 7 0.7409
(Best) 5.6845
7 80 4 60 7 0.0074
(Worst) 4.584
8 80 6 20 9 0.6136 6.434
9 80 8 40 5 0.5232 6.559
(Worst)
Fig. 6Residual Plot for MRR
1173 minimizing SR the best solution value is 2.420 (trial 9th) and
the worst solution value is 2.950 (trial 1st).
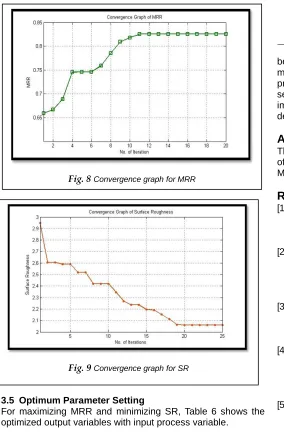
3.4 Convergence results for MRR and SR
Figure 8 and 9 shows the convergence graph for MRR and SR, which shows that implementation of Jaya optimization algorithm will help to the predict MRR and SR during EDM machining of NiTi alloy. It is observed from the fig.(6) the value of MRR goes on increasing from 0.651 to 0.758 mm3/min in just 10 numbers of iteration. After 10th iteration the plot seems to be straight line or the values of MRR remains constant. It is also observed from fig. (7), the value of F(SR) goes on reducing from 2.950 to 2.420μm in just10 numbers of iteration. After 10th iteration the plot seems to be further decline up to 20th number of iteration and beyond this the plot seems to be straight line or the values of SR remains constant.
3.5 Optimum Parameter Setting
For maximizing MRR and minimizing SR, Table 6 shows the optimized output variables with input process variable.
4
CONCLUSION
Use of Jaya algorithm proves to be effective and efficient optimization technique where improvements in MRR and SR were achieved in just 10 iterations. It is reported that increase in current leads to increase the MRR but hampers SR. So for SR less value of current is desirable during EDM machining of
NiTi60 alloy. The regression models generated for MRR and SR will be applicable for prediction of results for the given set of input variables. The objective function F(MRR) was improved from 0.7409 to 0.758 mm3/min, while SR seemed to
be improved from 2.804 to 2.420 µm. By increase in MRR machining time is reduced and by improving SR quality of product improves, hence it can also be concluded that selection of appropriate (optimum) process parameters for improving quality of product, time of machining largely depends upon the implementation of optimization techniques.
ACKNOWLEDGMENT
The authors would like to acknowledge Sathyabama Institute of Science and Technology, Chennai, India, for providing Matlab laboratory facility during this entire research work.
REFERENCES
[1] Beri N, Sachin M, Chitra S, Anil K., ―Technological Advancement in Electrical Discharge Machining with Powder Metallurgy Processed Electrodes: A Review‖, Materials and Manufacturing Processes, Vol.25, pp.1186–1197, 2010. [2] Anish, Kumar, Vinod, Kumar, Jatinder, ―Prediction of Surface
Roughness in Wire Electric Discharge Machining (WEDM) Process based on Response Surface Methodology‖, International Journal of Engineering & Technology,Vol 2(4), pp.708-719, 2012.
[3] Prajapati, S. B., Patel, N. S., ―Effect of Process Parameters on Performance Measures of Wire EDM for AISI A2 Tool Steel‖‖, International Journal of Computational Engineering Research Vol. 3(4), pp. 274-278, 2013.
[4] Majhi, Sanjay Kumar, Pradhan, M. K., Soni, Harigovind, ―Optimization of EDM Parameters using Integrated Approach of RSM, GRA and Entropy Method‖, International Journal of Applied Research in Mechanical Engineering Vol. 3(1) , pp.82-87, 2013.
[5] Kumar, K., Ravikumar, R., ―Modeling and Optimization of Wire EDM Process‖, International Journal of Modern Engineering Research, Vol.3 (3), pp.1645-1648, 2013.
[6] A.M. Takale, N.K. Chougule, P.H. Selmokar, M.G. Gawari, ― Multi-Response Optimization of Micro-WEDM Process Parameters of Ti49.4-Ni50.6 Shape Memory Alloy for orthopedic Implant Application‖, Advanced Materials Research, Vol. 1150, pp 1-21, 2018.
[7] Vikasa, Apurba Kumar Royb, Kaushik Kumar, Effect and Optimization of various Machine Process Parameters on the
TABLE6
OPTIMUM COMBINATION
Objective
EDM Parameters
Optimum results Voltage Current Pulse
on
Pulse off
Max. MRR (mm3/min)
72 7.1 51 5.5 0.758
Min. SR
(µm) 67 5.2 35 8.9 2.420
Fig. 8Convergence graph for MRR
Surface Roughness in EDM for an EN41 Material using Grey- Taguchi Procedia Materials Science 6 ,pp. 383 -390, 2014. [8] Rao, S., Ramji, K., Satyanarayana, B.,―Prediction of material
removal rate of Aluminum BIS- 24345 alloy‖, International Journal of Engineering Science and Technology 2, pp. 7729-7739, 2010.
[9] Subrahmanyam, S. V., Sarcar, M. M. M., 2013, ―Evaluation of Optimal Parameters for machining with Wire cut EDM Using Grey- Taguchi Method, International Journal of Scientific and Research Publications, Vol.3(3) pp.1-9, 2013. [10] K. P. Somashekhar, J. Mathew, N. Ramachandran, ―Multi-objective optimization of micro wire electric discharge machining parameters using grey relational analysis with Taguchi method‖, Proc. IMechE ,part C: J. Mechanical Engg Science, Vol. 225 , 2011.
[11] Manjaiah M, Narendranath S, Basavarajappa S, ―optimization of material removal rate and surface roughness in wed-machining of TiNi SMA using grey relation analysis‖, 5th International & 26th All India Manufacturing Technology, Design and Research Conference (AIMTDR), IIT Guwahati, Assam, India 351-1, December 2014.
[12] Jagadish A. Ray, ―Multi-Objective Optimization of Green EDM An Integrated Theory‖, J. Inst. Eng. India Ser. C Vol. 96(1), pp. 41–47, March 2015. DOI 10.1007/s40032-014-0142-0. [13] Himadri Majumder, Kalipada Maity, Application of GRNN and
multivariate hybrid approach to predict andoptimize WEDM responses for Ni-Ti shape memory alloy, Applied Soft Computing 70 (2018) 665–679.
[14] G. Ugrasen, H. V. Ravindra, G. V. Naveen Prakash, R. Keshavamurthy, ―Process optimization and estimation of machining performances using artificial neural network in wire EDM‖ , Procedia Materials Science 6, pp.1752 – 1760, 2014. [15] Sengottuvel. P, Satishkumar. S, Dinakaran. D, ―Optimization
Of Multiple Characteristics Of EDM Parameters Based On Desirability Approach And Fuzzy Modeling‖, Procedia Engineering 64 ,pp. 1069 -1078, 2013
[16] Atul Tiwari, M. K Pradhan, ―Applications of TLBO algorithm on various manufacturing processes: A Review‖, Materials Today: Proceedings 4, pp.1644–1652, 2017.
[17] V. Muthukumar, A. Suresh Babu , R. Venkatasamy, N. Senthil Kumars, ―An Accelerated Particle Swarm Optimization Algorithm on Parametric Optimization of WEDM of Die-Steel‖, J. Inst. Eng. India Ser. C 96(1), pp. 49–56, March 2015, DOI 10.1007/s40032-014-0143-z.
[18] Monalisa Das, Ramesh Rudrapati, Nabendu Ghosh and Lakhan Rathod, ―Input Parameters optimization in EDM Process using RSM and JAYA Algorithm‖, International Journal of Current Engineering and Technology, Special Issue-6, pp.109-112, Oct 2016.
[19] R. S. Pawade, A. S. Awale and P. K. Brahmankar, ―Application of Jaya Algorithm in Optimization of High Speed Turning of AISI S7 Tool Steel‖, Proceedings of 6th International & 27th All India Manufacturing Technology, Design and Research Conference (AIMTDR) , pp. 1764-1768, 2016.
[20] K. Lingaadurai, B. Nagasivamuni, ―Selection of wire electrical discharge machining process parameters on stainless steel ALSI grade-304 using design of experiments approach‖, Journal of Institute of Engineers: Series C, Vol.93(2), pp. 163-170, 2012.
[21] Theisen. W., A. Schuermann, ―Electro discharge machining of Nickel- Titanium shape memory alloys‖, Materials Science and Engineering, Vol. 378, (1-2), pp.200-204, 2004.
[22] Mahendra U Gaikwad, Krishnamoorthy A, and Vijaykumar S