Experiments in a combined up stream downstream slug flow
F. Sánchez-Silva1, I. Carvajal-Mariscal1, D. Libreros2, M. Toledo-Velázquez1, and H. Saidani-Scott3 1
LABINTHAP-SEPI-ESIME-IPN-COFAA, 07738 México, D.F., México 2
Electrical Engineering Department, SEPI-ESIME-IPN-COFAA, 07738 México, D.F., México 3
EDP Mechanical Engineering Department, University of Bristol, Bristol B581TR UK
Abstract. Slug flow induced by the combination of a downstream and an upstream two phase flow is very common in the oil industry, mainly when the pipelines are installed on hilly terrains. This phenomenon can be dangerous for the equipment operation because it induces vibrations due to the slugs intermittent movement into the separators. A loop, where it is possible to change the flow conditions and the loop geometrical parameters as the length and inclination angle of the pipe sections was built. Instruments for slug detection and for measuring their characteristic parameters as hold up, frequency, length, and velocity were installed. Three conductive probes were used for the hold-up measurement in different points; all of them were designed, constructed, tested and calibrated. Experimental runs for a set of four alternated sections upstream downstream W shaped pipe have been undertaken. The gas and liquid flow rates were selected in order to obtain stratified flow at the inlet, which is the condition to induce the severe slugging. The main conclusions of the experimental results analysis are presented in this paper. The Barnea’s criterion has been compared against our experimental results, three slugging regions have been found.
1 Introduction
Two-phase flow conduction systems are commonly found in the oil industry, especially when the wells production has to be conducted to the phase separation equipment. All piping networks are normally designed for the maximal production of the field. Unfortunately, oil fields reduce gradually their production. As the companies continue to use the same piping network designed for full production, pipes become eventually oversized, this circumstance produces a flow pattern change in the system and their operation becomes unstable. The problem is even worst when the pipes are installed on irregular fields so that piping is a combination of several uphill and downhill sections. This combination yields the slug flow pattern which is a source of vibrations and dangerous instabilities in the system [1].
For the above mentioned, it is fundamental to know the phenomena involved in two phase flow transport in pipes. The correct operation of a two-phase mixture transport system depends also on its correct design and installation; it is also necessary to know the time evolution of the fluid composition and the flow rates being conducted by the system in order to propose pertinent solutions when a transient appears in it.
When liquid and gas flow together in a set of interconnected horizontal, inclined upward and downward sections of pipe, the liquid could be stratified
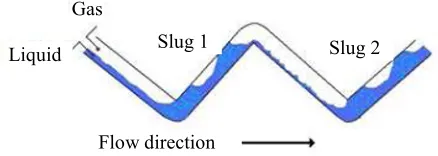
in the downwards sections and then induce the slug flow formation in the horizontal and upward inclined sections (figure 1). The generated slugs in the upward sections could go into the next downward section producing uncertainty in the flow behavior. Such a configuration due to the terrain irregularities could yield to the formation of larger slugs than those encountered in horizontal pipes [2]
Fig. 1. Slug flow induced by a hilly terrain. The liquid phase is
accumulated in the lower elbows, producing slug flow in the upward sections.
The slug formation can be induced by different mechanisms: hydrodynamic effects (superficial waves), wavy terrain effects (valleys and direction changes in the piping disposal path), and changes on the operational conditions; flow rates or pressure [3]. The slug flow induced by the liquid and gas flow rate fluctuation can reduce seriously the oil production, the time life of the
Flow direction
Slug 2 Slug 1
Gas
Liquid C
installation and in the worst case the equipment destruction [1].
The average slug length is a complex function of several parameters: the length and diameter of the pipe, the line topography, the liquid and gas superficial velocities, and the physical properties of both phases.
The inclination angle of the sections is a very important parameter because for low liquid superficial velocities, stratified flow appears in downward sections, due to the liquid acceleration produced by the gravity, meanwhile in the uphill sections the liquid is decelerated, so there is a high probability of slug formation in the direction change because in the lower part of the two sections union the liquid accumulates periodically [4].
The problem could be reduced if the system pressure is increased or the superficial velocity in both fluids is increased and also installing slug catchers or using a control with a throttling valve among others [5]. Unfortunately none of the mentioned solutions is optimal neither economical. So that, it is necessary to optimize the design and the process control as well, for this purpose the slug flow characteristics prediction when installed in hilly terrain is essential for a good performance and safe operation of these systems.
2 Nomenclature
g [m/s2] Gravity acceleration
H [-] Hold up (liquid volumetric fraction)
h [-] Dimensionless hydrostatic column
L [m] Section length
P [Pa] pressure
R [m2/s2K] Gas constant
T [K] Temperature
U [m/s] velocity
Special characters
α [-] Inclination angle, first section ρ [kg/m3] density
θ [deg] Half angle between the two first sections
ω [deg] Angle between different inclined sections
Subscripts
1 First section, bottom first section for pressure, between first and second section.
2 Second section, between second and third
sections
3 Third section, between third and fourth section
G Gas phase
L Liquid phase
M Mixture
SG Superficial of gas
SL Superficial of liquid
3 Experiment design
As we are interested in studying the influence of the hilly terrain on the two-phase flow stability, we have to divide the parameters describing the system: there are geometrical and operational parameters. Regarding the
geometrical there are four lengths (L0, L1, L2, L3), the angle between the first section and the horizontal α, and three more angles formed by the each pair of inclined sections (ω1, ω2, ω3), in addition to the pipe diameter. On the other hand, the operational parameters are; the fluids, the flow rates, the pressure and the temperature.
For experiments we took only water and air at 20 ºC and with a fixed inlet pressure of 2 bar for experiments in a 19.4 mm plexiglass internal diameter pipe. Anyway there is still a lot of parameters to be considered. For this reason we decided to maintain constant the inclination of the first section, and the lengths of the first and the last section, that means that the only parameters are L1 and L2, the three angles (ω1, ω2, ω3). For the flow parameters we found convenient to take three values for USL and six for USG only those conditions to have stratified flow in the first inclined section [6].
All three angles ω1, ω2, ω3, defining the experimental section were changed five times (60°, 75°, 90°,105° y 120°), keeping the alpha angle constant (α = 45º), the length L1 and L2 were also varied according to the lengths (1.25, 2.5, 3.75 and 5 meters), (figure 3).
3.1 Parameters to be measured
We need to know under which circumstances the severe slugging appears and its characteristics as the void fraction, slug lengths and the water carried by them. In order to verify the correctness of the measurements, it is necessary to contrast the information given by the pressure transducers and all the other instrumentation because the phenomenon is detected by the sensors, ring probes and transducers.
4 Experimental set up
The experimental set up (figure 2) was designed and built to study and visualize two-phase air-water flows in pipes with downwards and upwards inclined sections, at low pressure. The experimental rig is formed by sub-systems.
4.1 The experimental rig
4.1.1 Air supply
A 10 HP piston compressor, with an air storage tank that can be operated at 9 bar, provides the air flow for experiments; a pressure regulator controls the compressor operation. There is a pressure regulation valve installed on the exit pipe of the tank which is adjusted to 2 bar. The relationship between the pressure in this point and the pressure in the storage tank guaranties sonic flow, so that the flow in the measurement zone is stable. Afterwards the air flow is conducted to the measurement section by a 25 mm internal diameter pipe.
4.1.2 Water supply
measurement section using a 25 mm internal diameter hydraulic PVC pipe.
4.1.3 Flow measurement
There are two flow measurement systems, one for the water and the other for the air flow supply. The water system is formed by three valves, one gate valve to regulate the flow through the water flow meter and two quick closing globe valves for recirculation. On the other hand, the air measurement section has a quick closing globe valve and a pin valve to regulate the air flow. Additionally there are two other valves to bypass or connect both meters according to the gas flow rate needed in the experiment.
Fig. 2. Diagram of the experimental set up.
4.2 Experimental section
Once the flow rates are measured, both liquid and gas flows are mixed in a Y, 25 mm PVC connection. The two phase mixture formed goes through the experimental section, which is formed by four segments of 19.4 mm internal diameter Plexiglas pipes for visualization. The four pipe elements of the experimental section are two inclined downwards and two upwards, forming a W shape installation (figure 3).
The instruments installed in the experimental section were; four pressure transducers, three ring conductance probes and a couple of laser probes.
4.3 Phase separation section
The two-phase flow discharge is connected to a liquid phase separator. This device was used as an instrument to measure the recovered water carried by the slugs. The separator’s body was calibrated in order to know the liquid volume accumulated in a certain period of time.
The shape of the reservoir was rectangular with a squared 10x10 cm2 section and a height of 70 cm which gives a volume of 6.9 liters; it was constructed on acrylic so we can also visualize the liquid level.
Additionally a pressure transducer was installed at the bottom of the separator; it was used together with a servo-valve to control the liquid level. The liquid accumulated was discharged automatically by the servo-valve into the pump suction tank and the air was exhausted to the atmosphere.
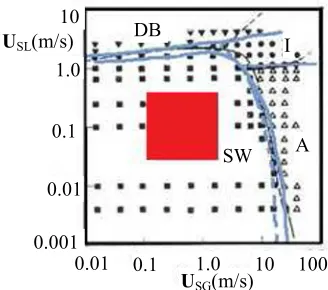
The mass flow rates, in the first downward section, was varied in convenient combinations, in order to fix a stratified flow pattern in this section. This condition was obtained with small values of USL and USG, which were selected according to a flow pattern map for downward inclined flows [4].
Fig. 3. Basic geometry of the experimental set-up
formed by four sections.
4.4 Instrumentation
The instrumentation installed in the system is formed by: a rotameter to measure the liquid flow rate (0-20 LPM), two turbine type flow meters for the gas (2-10 and 10-50 LPM), two optical sensors to detect the slug presence, three ring conductance probes to measure the liquid hold up, four pressure transducers, 2 of them of the range (0-15 psi), and the other of (0-5 psi) and finally one pressure transducer to measure the liquid level in the phase separator range (0-1 psi).
Fig. 4. Experimental stratified flow region for 50° downward
flow according to Barnea [7]. DB dispersed bubble, SW stratified wavy and A annular.
ω1
ω2
ω3 P1
P2 P3
Patm
α1=45=ct
L0=Cte
L1 L2
L3=Cte
PIN VALVE Compressor
Air PRV
Air to the Atmosphere
Phase Separator
Pump Tank
SYMBOLOGY
GATE VALVE GLOBE VALVE
SERVO VALVE LIQUID AND GAS
FLOW METER PRESSURE TRANSDUCER RING PROBE (PR) LASER PROBE (DS) Tank
PR PR
PR DS
USL(m/s)
USG(m/s) 1.0
0.1
0.01
0.001
0.01 0.1 10
10
1.0 100
DB
SW A
The experiments were run using the following order; the inlet flow conditions were divided in two series; for low USG (series B) and for high USG (series A), combining with three USLas shown in table 1.
5 Probes calibration
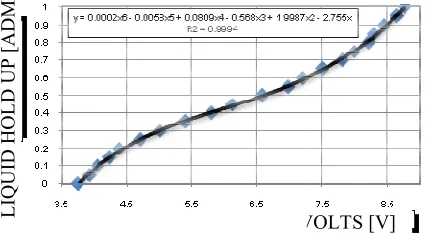
The two ring conductance probes
measurement were calibrated in a static way by simulating first a stratified flow and then a dispersed bubbly flow in a horizontal pipe.
Table 1. Experimental gas and liquid superficial velocities.
USL (m/s) 0.2029 0.3383
USG (m/s)
0.2029 B11 B31
0.3383 B13 B33
0.4736 B15 B35
1.014 A11 A31
1.3534 A13 A33
1.6915 A15 A35
For bubbly flow calibration, the bubbles were simulated using Pyrex particles (density 2.2284 g/ml). Adding a known quantity of particles, in a known volume control including a two-rings probe, the volume fraction occupied by the particles was the void fra
correlated with the output electric signal of the probe. For stratified flow it was not necessary to add Pyrex particles, a known liquid volume was just added into a horizontal volume control and then it was possible to know the liquid volume fraction (hold up) in the volume control.
Fig. 5. Calibration curve of the two-ring probe.
The other instruments were calibrated using standard methods.
6 Experimental runs
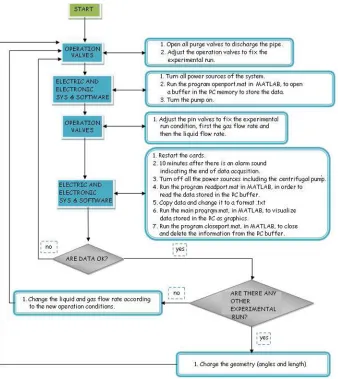
All experiments were run using the procedure shown in figure 6.
First of all the whole loop was emptied of water by using the drain valves. Then the sequence started by fixing a new experimental condition which was attained by opening or closing the pin valves to fix the required liquid and gas flow rates.
Once both flow rates were
acquisition started. Table 1 shows all the experimental VOLTS [V] L IQ U ID H O L D U P [ A D M ]
The experiments were run using the following order; the inlet flow conditions were divided in two series; for low (series A), combining
The two ring conductance probes for hold-up measurement were calibrated in a static way by simulating first a stratified flow and then a dispersed
. Experimental gas and liquid superficial velocities.
0.4736 B51 B53 B55 A51 A53 A55
For bubbly flow calibration, the bubbles were simulated using Pyrex particles (density 2.2284 g/ml). Adding a known quantity of particles, in a known volume control rings probe, the volume fraction occupied by the particles was the void fraction which was correlated with the output electric signal of the probe.
For stratified flow it was not necessary to add Pyrex particles, a known liquid volume was just added into a horizontal volume control and then it was possible ume fraction (hold up) in the
ring probe.
The other instruments were calibrated using standard
All experiments were run using the procedure shown in
First of all the whole loop was emptied of water by using the drain valves. Then the sequence started by fixing a new experimental condition which was attained alves to fix the required
fixed, the data acquisition started. Table 1 shows all the experimental
conditions tested, the same flow conditions were used in all three different geometrical arrangements (a
pipe lengths).
7 Results and discussion
The case 750-600-750 (ω1, ω2,
will be taken for analysis. This is the symmetrical case shown in figure 3.
The experimental runs were developed as suggested in table 1. The criterion for severe slugging existence in the experimental system w
proposed by Barnea [8].
hL,min = ( P2 – P0 ) / (
In this equation, the upward section is considered full of water, because is the condition in
heavier. Basically, equation 1 means that when the pressure difference between the bottom and the top of the riser is bigger that the hydrostatic pressure due to the liquid column, the riser is emptied violently.
According to Barnea’s c
followed immediately by a condition where
guaranties that severe slugging is taking place in the system. That is, the liquid column is cleared and replenished again, in an alternated pattern.
The results of runs B15,
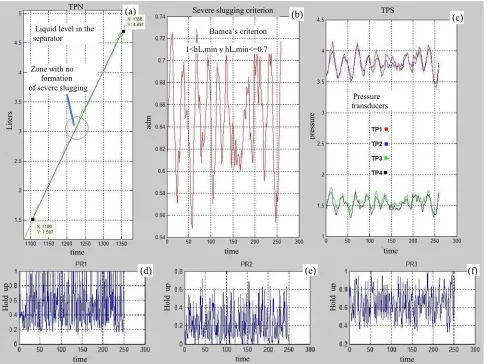
in figures 7, 8 and 9. Observing the graphs corresponding to the run B15 (figure 7) the phenomenon can be divided in two events; the first one (figure 7a) in which the liquid level in the separator increases suddenly due to the violent gas arriving into the liquid column, action that clears the liquid in the riser, and the second one in which the liquid level in the separator is constant, because the remaining liquid in the riser walls slips back due to the sudden pressure decrement in the lower part of the pipe and also due to the gravity action, it accumulates again in the bottom until the riser is again full of liquid.
These events are in agreement with Barnea’s criterion, when the liquid goes into the separator h 1, it means that the pressure in the bottom of the pipe is higher than the hydrostatic pressure of the liquid column, and this produces a violent movement of the slug into the separator (sudden increment in the separator liquid level figure 7a, and a sudden decrement
figure 7b). On the other hand, when h
stagnant period in which there is no more liquid going into the separator, this situation can be observed in the liquid level as a horizontal line (figure 7a), and is in agreement with the pressure increment in the lower part of the last section (figure 7c).
Additionally if we analyze the liquid hold up measured with the two rings probes, (figure 7e), we observe that the average liquid hold up in the fourth section is 0.87 this condition lightens the liquid column, because the mixture density in the column is reduced. This parameter can be computed using the following expression:
ρM = HL ρL + ( 1
VOLTS [V]
conditions tested, the same flow conditions were used in all three different geometrical arrangements (angles and
discussion
, ω3) with 5 m - 5 m (L1, L2)
will be taken for analysis. This is the symmetrical case
The experimental runs were developed as criterion for severe slugging existence in the experimental system was the one
) / ( ρL g L2sin θ ) (1)
In this equation, the upward section is considered full of water, because is the condition in which the column is heavier. Basically, equation 1 means that when the pressure difference between the bottom and the top of the riser is bigger that the hydrostatic pressure due to the liquid column, the riser is emptied violently.
According to Barnea’s criterion, when hL,min > 1
followed immediately by a condition where hL,min ≤ 0.7
guaranties that severe slugging is taking place in the system. That is, the liquid column is cleared and replenished again, in an alternated pattern.
The results of runs B15, B51 and A33 are shown in figures 7, 8 and 9. Observing the graphs corresponding to the run B15 (figure 7) the phenomenon can be divided in two events; the first one (figure 7a) in which the liquid level in the separator increases suddenly due to the nt gas arriving into the liquid column, action that clears the liquid in the riser, and the second one in which the liquid level in the separator is constant, because the remaining liquid in the riser walls slips back due to the n the lower part of the pipe and also due to the gravity action, it accumulates again in the bottom until the riser is again full of liquid.
These events are in agreement with Barnea’s criterion, when the liquid goes into the separator hL,min > that the pressure in the bottom of the pipe is higher than the hydrostatic pressure of the liquid column, and this produces a violent movement of the slug into the separator (sudden increment in the separator liquid level figure 7a, and a sudden decrement in the second graph, figure 7b). On the other hand, when hL,min≤ 0.7 there is a stagnant period in which there is no more liquid going into the separator, this situation can be observed in the liquid level as a horizontal line (figure 7a), and is in ement with the pressure increment in the lower part
Additionally if we analyze the liquid hold up measured with the two rings probes, (figure 7e), we observe that the average liquid hold up in the fourth is condition lightens the liquid column, because the mixture density in the column is reduced. This parameter can be computed using the following
Fig. 6. Sequence used in the experimental runs.
where ρM is the mixture density, which accounts the
liquid and gas quantity in the pipe, HL is the average
liquid volumetric fraction (hold up) and varies from 0 to 1.
HL = (
∫
T
0
HL ( t ) dt ) / T (3)
For the gas density the ideal gas model was taken
,
ρG= Pav / R T (4)
Under these circumstances the liquid column density would be 870 kg/m3.
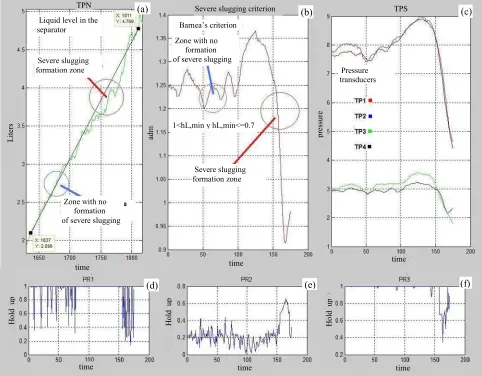
If we also compare the results obtained in the experiment A33, where the average hold up was 0.64 (the mixture density in the riser was 640 kg/m3), the system is still sending liquid into the separator even if the Barnea’s criterion doesn’t attain 1.0 ( not fulfilled). The liquid continues going into the separator because the pressure column in the bottom of the riser is slighted by the gas presence, and then some liquid flows continuously into the separator (figure 8a) where the liquid level presents an inclined line, which means is filling up with liquid. In this case the system response could be considered as stable respect the severe slugging phenomenon, because
the system is operating in slug flow foamy in its front as shown in figure 8f, the slug frequency is high and the gas void fraction is also high. All three slug hold up signals are similar in all the section showing a stable function.
Run B51 results are presented in figure 9, the flow pattern is considered “pseudo severe slugging” because it has both characteristics; steady state and severe slugging. This is observable in the graph of figure 9a at the top middle where there is the trend of a stable flow because the liquid flow into the separator keeps constant, but afterwards there is an instability with the characteristics of the severe slugging, this produces a situation where there are sporadic vibrations, but there is a difference with severe slugging where the frequency is higher and remains almost constant.
Respect the pressure signals (figures 7c, 8c and 9c), they are congruent with the Barnea’s criterion, that is they follow the same tendency and even the magnitude is consistent with the pressure tap position.
Fig. 7 Graphs corresponding to the experiment B15. (a) liquid level in the separator, (b) Barnea’s criterion, (c) pressure in different points, (d) hold up in the second section, (e) hold up in the third section, (f) hold up in the fourth section.
Fig. 8 Graphs corresponding to the experiment A33. (a) liquid level in the separator, (b) Barnea’s criterion, (c) pressure in different
points, (d) hold up in the second section, (e) hold up in the third section, (f) hold up in the fourth section.
time time time time time time H ol d up H ol d up H ol d up L it er s adm p re ss ur e
Liquid level in the separator Stagnancy Severe slugging formation zone Liquid level increment Barnea’s criterion
Severe slugging formation zone
1<hL,min y hL,min<=0.7
Pressure transducers
(a) (b) (c)
(d) (e) (f)
Severe slugging criterion
TPN TPS
time time time time time time H o ld u p H o ld u p H o ld u p L it er s ad m p re ss u re
Liquid level in the separator
Zone with no formation
of severe slugging
Barnea’s criterion
1<hL,min y hL,min<=0.7
Pressure transducers
(a) (b)
(c)
(d) (e) (f)
Severe slugging criterion
Fig. 9 Graphs corresponding to the experiment B51. (a) liquid level in the separator, (b) Barnea’s criterion, (c) pressure in different points, (d) hold up in the second section, (e) hold up in the third section, (f) hold up in the fourth section.
It is interesting to remark that this parameter influences both characteristic parameters. To show this influence the case B15 (USG = 0.4736 m/s and USL
= 0.2029 m/s) results are plotted. The slug frequency reduces with the L parameter increment, on the other hand, hold up in the last section is increased, (figure 11).
Fig. 10 Definition of the geometrical parameter L.
Fig. 11 Frequency and average hold-up at the fourth section for
the experimental run B15. time time
time
time time
time
H
o
ld
u
p
H
o
ld
u
p
H
o
ld
u
p
L
it
er
s
ad
m
p
re
ss
u
re
Liquid level in the
separator Barnea’s criterion
1<hL,min y hL,min<=0.7
Pressure transducers
(a) (b) (c)
(d) (e) (f)
Severe slugging criterion
TPN TPS
Zone with no formation
of severe slugging
Zone with no formation
of severe slugging Severe slugging formation zone
Severe slugging formation zone
Section 1
Section 2
Section 3 Section 4
Structure
HMAX1 HMAX2
H
o
ld
u
p
F
re
cu
en
cy
8 Conclusion
The Barnea’s criterion predicts acceptably the severe slugging existence for the experimental conditions we have tested, but for stable slug flow, it gives an incorrect idea of the phenomenon because the criterion doesn’t take into account the void fraction in the column, which produces a value hL,min < 1, but liquid is still flowing into the separator. On the other hand, the method doesn’t consider the existence of a pseudo slug regime in which there is a combination of stable slug flow and sporadic formation of severe slugging. Due to this situation, the flow pattern depends greatly on the amount of liquid draining back that increases the liquid accumulation and then when the liquid level is big enough a slug shut takes place. To improve the method proposed by Barnea, it should take into account the void fraction.
Regarding the experimental results, there is an important influence of the geometry, that is the length and inclination angles of the sections, in the values of the main slug flow parameters.
The combination of lengths and inclination angles are definitely important parameters for the system stability.
References
[1].E. Storkaas, S. Skogestad, J. Godhavn, ASA, R&D, Process control, Arkitekt Ebells vei 10, Rotvoll, N-7005Trondheim, Norway.
[2]. E. M. Al-safran, S. S. Jayawardena, J. P. Brill, H.Zhang, C. L. Redus, An Experimental Study Of Two-Phase Flow In A Hilly-Terrain Pipeline
(Proceedings of ETCE/OMAE 2000)
[3]. D. Barnea, O. Shoham, Y. Taitel, A. E. Dukler, Chemical Engineering Science, 40, 6 (1985)
[4]. M. McGuinness, R. McKibbin, Terrain-Induced Slugging (Mathematics-in-Industry Study Group 2002) [5].Y. Taitel, D. Barnea,. Int. J. Multiphase Flow, 23, 9
(1997)
[6].M.Pérez, Caracterización del flujo slug inducido por la combinación de tuberías descendentes y ascendentes (SEPI-ESIME Culhuacan 2009) [7].D. Barnea, O. Shoham, Y. Taitel, Chemical
Engineering Science, 37, 6 (1982)