The Application of Monte Carlo Simulation
to the Design of Collimators
for Single Photon Emission Computed Tomography
Ian Derek Cullum
Institute of Nuclear Medicine
University College School of Medicine
The University of London
A Thesis Submitted for the Degree of Doctor of Philosophy
of the University of London
ProQ uest Number: 10105616
All rights reserved
INFORMATION TO ALL U SE R S
The quality of this reproduction is d ep en d en t upon the quality of the copy subm itted.
In the unlikely even t that the author did not sen d a com plete manuscript
and there are m issing p a g e s, th e se will be noted. Also, if material had to be rem oved,
a note will indicate the deletion.
uest.
ProQ uest 10105616
Published by ProQ uest LLC(2016). Copyright of the Dissertation is held by the Author.
All rights reserved.
This work is protected against unauthorized copying under Title 17, United S ta tes C ode.
Microform Edition © ProQ uest LLC.
ProQ uest LLC
789 East E isenhow er Parkway
P.O. Box 1346
Abstract
Single photon emission computed tomography offers the potential for quantification of the uptake of radiopharmaceuticals in-vivo. This thesis investigates some of the factors which limit the accuracy of these methods for measurements in the human brain and investigates how the errors can be reduced. Modifications to data collection devices rather than image reconstruction techniques are studied.
To assess the impact of errors on images, a set of computer generated test objects were developed. These included standard Anger and Phelps phantoms and a series of slices of the human brain taken from an atlas of transmission tomography.
System design involves a balance between resolution and noise in the image. The optimal resolution depends on the data collection system, the uptake characteristics of the radiopharmaceutical and object size. A method to determine this resolution was developed and showed a single-slice system employing focused, probe detectors to offer greater potential for quantification in the brain than systems based on multiple Anger gamma cameras.
A collimation system must be designed to achieve the required resolution. Classical, geometric design is not satisfactory in the presence of scattering materials. For this reason a Monte Carlo simulation allowing flexible choice of collimator parameters and source distribution was developed. The simulation was fully tested and then used to predict the performance of collimators for probe and camera based systems. These assessments were carried out for the 'worst case source' which was a concept developed and validated to allow faster prediction of collimator performance. In essence the geometry of this source is such as to allow a resolution measurement to be made which represents the worst value expected from the system.
Table of Contents
Title
Page
Abstract 2
Contents 3
Chapter 1
Introduction to Single Photon Emission Computed Tomography
1.1 Basic Principles 11
1.1.1 Introduction 11
1.1.2 Radiopharmaceutical Production 11
1.1.3 Interaction of Photons with Matter 12
1.1.4 The Scintillation Detector 13
1.1.5 The Anger Gamma Camera 15
1.1.6 Planar Imaging 16
1.1.7 Tomographic Imaging 16
1.2 The Need for Tomographic Data 18
1.3 SPECT Systems 21
1.3.1 Limited Angle (Longitudinal) Systems 21
1.3.2 Full Angle (Transverse) Systems 25
1.4 System Characterisation and Limitations to Performance 33
1.4.1 Simple Performance Parameters 34
1.4.2 Overall Performance Parameters 36
1.5 Artefacts 38
1.6 Clinical Utility 41
1.7 Aim and Scope of the Thesis 45
Chapter 2
Methods for the Evaluation of System Performance
2.1 Introduction 48
2.2 The Skull Uptake Test 48
2.4 Test Objects and Evaluation Methods 53
2.5 Constraints Imposed by Imperfect Detection Systems 57
2.5.1 Resolution 57
2.5.2 Noise 61
2.5.3 Attenuation 65
2.6 Design Parameters for improved SPECT Systems 66
Chapter 3
The Prediction of System Response Functions
3.1 Factors Influencing Sensitivity and Resolution 72
3.2 The Classical Approach to Collimator Design 72
3.3 Introduction to Monte Carlo Techniques 75
3.4 The Monte Carlo Simulation 76
3.4.1 Sampling the Probability Functions 77
3.4.2 Random Number Generation 77
3.4.3 Position and Direction of Gamma Ray Emission 78
3.4.4 Determination of Interaction Position 80
3.4.5 Type of Interaction and Subsequent Photon Direction 81 3.4.6 Energy Discrimination in the Detection System 88
3.4.7 Gamma Camera Intrinsic Resolution 89
3.4.8 Overview of the Simulation Procedure 90
3.5 Verification of the Photon Transport Simulation 92
Chapter 4
Results from the Monte Carlo Simulation of Collimator Responses
4.1 The Aim of the Simulation Procedure 98
4.2 Collimator Septal Thickness 100
4.3 Gamma Camera Collimator Response Function 106
4.4 Focusing Collimator Response Functions 110
4.4.1 Point Source Response 111
4.4.2 Line Source Response 114
4.4.3 Plane Source Response 115
4.5 Possible Modifications to the Double Focusing
Collimator Concept 117
4.5.1 Blocking Sections of the Collimator 117
4.5.2 Single Focusing Collimators 120
4.7 Discussion of the Results of the Collimator Simulation 125
4.7.1 The Ideal Collimator for Gamma Camera
and Focused Detector Systems 125
4.7.2 Modifications to the Double Focusing Collimators 129
4.7.3 Effects of Scatter and Energy Window 131
Chapter 5
Prediction of Reconstructed Image Quality
5.1 Introduction 133
5.2 The Test Objects 134
5.3 Raw Data Formation 135
5.3.1 Noise Free Data 135
5.3.2 Simulation of Random Noise 138
5.3.3 The Collimators Simulated 139
5.4 Image Reconstruction 142
5.5 Predicted Results 148
5.6 Conclusion 154
Chapter 6
Discussion and Conclusion
6.1 Type of Tomographic System Required 156
6.2 Image Analysis 157
6.3 Design Criteria and Implementation 158
6.4 Collimator Modelling 160
6.5 Analysis of Collimator Response Functions 162
6.6 Image Prediction 163
6.7 Overall Conclusions 164
6.8 Future Work 165
References 167
List of Figures
C hapter 1
Figure 1.1: Orientation of the three main tomographic planes 18 Figure 1.2: Relative contrast produced by tomographic and planar imaging 20 Figure 1.3: Orientation of tomographic planes for longitudinal systems 22
Figure 1.4: Seven pinhole collimation system 23
Figure 1.5: Definition of a projection for full angle tomographic systems 25
Figure 1.6: Scanning pattern of the Strichman device 28
Figure 1.7: Data collection procedure for the rotating gamma camera 30 Figure 1.8: Methods of reducing radius of rotation for gamma cameras 32
Figure 1.9: Contrast resolution phantom 37
Figure 1.10: Geometrical definition of a rotating gamma camera projection 39
C hapter 2
Figure 2.1: Decay corrected skull uptake versus time after injection 49 Figure 2.2: Response of the Cleon 710 to increasing activity 49
Figure 2.3: In-vivo skull uptake of ^^Tc-MDP 50
Figure 2.4: Skull uptake with treatment 51
Figure 2.5: ^^Tc-HMPAO tomograms of a normal human brain 54
Figure 2.6: 99mTc_HMPAO tomograms in epilepsy and dementia 55 Figure 2.7: The three idealised brain slices and ROI's used for quantification 56 Figure 2.8: Accuracy of sizing hot and cold activity areas 58 Figure 2.9: The effect of system resolution on simulated brain slices 59 Figure 2.10: Uptake with varying thickness of ring phantom 60
Figure 2.11: Effect of noise level on the ring phantom 63
Figure 2.12: Effect of noise level on the brain phantom 63
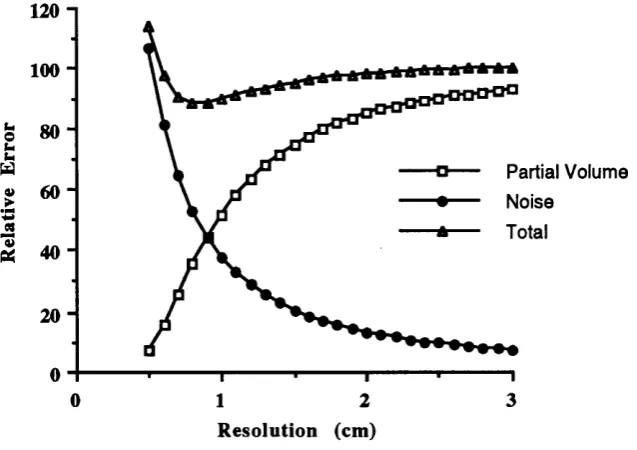
Figure 2.13: Errors due to partial volume and noise 67
C hapter 3
Figure 3.1: The classical approach to collimator design 73
Figure 3.5: Typical pulse height spectrum for ^ T c 89
Figure 3.6: Gamma camera geometrical response 90
Figure 3.7: The Monte Carlo simulation process 91
Figure 3.8: Measured and simulated pulse height spectra for ^ ^ T c 93 Figure 3.9: Measured and simulated gamma camera resolution 93 Figure 3.10: The scanning jig used to measure collimator response 95 Figure 3.11a: The 'in plane' response of the Cleon 710 collimator 95 Figure 3.1 lb: The 'between slice' response of the Cleon 710 96 Figure 3.1 Ic: The 'depth of focus' response of the Cleon 710 96
Chapter 4
Figure 4.1 : Focusing collimator responses with different septal thicknesses 103 Figure 4.2: Response of focusing collimator to various energy photons 103 Figure 4.3: Gamma camera line source response function 107 Figure 4.4: Gamma camera resolution as a function of collimator hole size 108 Figure 4.5: Resolution and sensitivity for gamma camera systems 109 Figure 4.6: Gamma camera response with collimators of different length 110
Figure 4.7 : Point source response of the Cleon 710 113
Figure 4.8: Sensitivity and resolution for focusing collimators 114
Figure 4.9: 'In plane' focusing collimator response 115
Figure 4.10: 'In plane' response for the 'worst case' sheet source 116
Figure 4.11: Double focusing collimator responses 117
Figure 4.12: Focusing collimator geometry and source position 118
Figure 4.13: Focusing collimator field of view 120
Chapter 5 Figure 5.1 Figure 5.2 Figure 5.3 Figure 5.4 Figure 5.5 Figure 5.6 Figure 5.7 Figure 5.8 Figure 5.9; Figure 5.10: Figure 5.11: Figure 5.12:
The Anger and Phelps phantoms
Scan geometry for the Strichman 810 brain scanner The 6mm collimator response functions
The Strichman 810 collimator response functions
135 136 141 141 The tomographic reconstruction procedure on the Strichman device 147
The Anger phantom images 148
The Phelps phantom images 149
Brain slice 1 images 149
Brain slice 2 images 150
Brain slice 3 images 150
Analysis of Phelps phantom simulations 152
Phelps phantom imaged on the Strichman 810 system 153
List of Tables
Chapter 2Table 2.1 : Uptake of MDP in the skull as a function of specific activity 52 Table 2.2: Grey to white matter flow ratios with different system resolutions 58 Table 2.3: Skull uptake values measured in-vivo by the Cleon 710 61 Table 2.4: Effect of varying levels of noise on skull uptake and flow values 62 Table 2.5: Effect of attenuation on skull uptake and flow values 66
Table 2.6: Errors due to noise and partial volume 68
Chapter 4
Table 4.1 : Parameters for simulated focusing collimators and detectors 101 Table 4.2: Percentage septal penetration for focusing collimators 102 Table 4.3: The effect of energy on focusing collimator resolution 102 Table 4.4: Parameters for gamma camera and collimators 104 Table 4.5a: Gamma camera resolution with different collimators 104 Table 4.5b: Percentage septal penetration and relative sensitivity for a
gamma camera collimator 105
Table 4.10: Effect on resolution & sensitivity of blocking collimator sections 119 Table 4.11: Fraction of detected photons which arise from the focal plane 121 Table 4.12: Parameters for simulated focusing collimators and detectors 124 Table 4.13: Parameters for simulated Anger gamma camera collimators 127
Chapter 5
Table 5.1 : Parameters for collimators and detectors 140
Table 5.2 Uptake ratios for the brain slices 151
CHAPTER 1
INTRODUCTION TO
1.1 Basic Principles.
1.1.1 Introduction.
Radionuclide techniques aim to trace a metabolic pathway in-vivo. To do this, the pharmaceutical which follows the required path is tagged (labelled) with a radionuclide which emits X or gamma photons during its decay. Assay and localisation of the radionuclide through these emissions allows data to be obtained regarding the pathway being studied. Absolute uptake, relative uptake in different parts of the body or the time course of uptake are generally studied.
1.1.2 Radiopharmaceutical Production.
This can be considered as a two-part process. Firstly the radionuclide must be obtained and subsequently it must be labelled to the pharmaceutical.
The physical properties of an ideal radionuclide are mainly determined by consideration of the absorbed radiation dose which the subject will receive. The radionuclide should emit no particulate radiation during its decay but should emit photons in the lOO's keV energy range (for adequate detection). For this reason the most popular radionuclides are those in a metastable state or those which decay by 100% electron capture. The physical half-life should be similar to the length of the investigation being carried out. The radionuclide should be obtained in a pure state, in particular it should not be contaminated with other unstable nuclides. The most popular method of production is from a radionuclide generator which contains the ’parent' of the required radionuclide attached to an ion exchange column. As the parent decays the amount of 'daughter' builds up, this is then eluted from the column by passing a liquid (such as saline) through it. The parent should remain trapped on the column during this process. A generator housing a long-lived parent (ie ^^Mo,
-67 hours) allows short-lived isotopes (ie T1 / 2 = 6 hours) to be available
at all times, the lifetime of the generator being determined by the parent rather than the daughter half-life. Other radionuclides are obtained from the bombardment of targets by high energy charged particles (from cyclotrons) or neutrons (from nuclear reactors). These radionuclides generally suffer from impurities and the emission of particulate radiation in their decay.
is important that the labelled and unlabelled materials are treated by the body in the same way.
1.1.3 Interaction of Photons with Matter.
Photons passing through matter interact with it, the extent and the processes by which this occurs depend on the photon energy and the material. The interactions which can occur are the photoelectric effect, Compton scatter, pair production, and a group of interactions which can be described collectively as coherent scattering.
A brief description of the interactions is given below, they are described in more detail in chapter 3 along with details of the methods used to simulate them.
a) Photoelectric Effect.
In this interaction the gamma ray is totally absorbed and an electron ejected from the atom with which the interaction occurs. The process most often involves an electron from one of the inner shells. Subsequently characteristic X-rays are emitted as the atom returns to the non-excited state. The mass attenuation coefficient for this interaction is highly dependent on the atomic number (Z) of the material and the photon energy, and is approximately proportional to z3or4/E3 [g the most important interaction in the collimator for the photon
energies used in most radionuclide studies.
The photoelectric effect reduces the number of photons reaching the detector, but for most studies does not add unwanted photons, the characteristic X-rays produced being well below the lower window level used for most isotopes (201t i is an important exception).
b) Compton Scattering.
interaction in soft tissue at the energies normally used in radionuclide imaging. It results in decreased image quality as the scattered photons (which approach the detector from a direction inconsistent with the location of the radionuclide and the assumption of straight line paths) are detected. This results in mispositioning of the radionuclide source in the image and reduced image contrast.
c) Pair Production.
In this interaction the gamma ray energy is used to form an electron-positron pair. At least 1.022MeV (the rest mass of the two particles) is required for the interaction to be possible, any residual energy appears as kinetic energy of the two particles. The mass attenuation coefficient for this interaction is proportional to the square of the atomic number (Z), and pair production is the only interaction whose probability increases with increasing photon energy (approximately as the logarithm of the energy). The interaction is of little importance in conventional nuclear medicine as the photon energies are below the 1.022 MeV threshold.
d) Coherent Scattering.
This term is used to describe a range of interactions which have the same overall effect on the incident photon, which is to alter its direction but leave its energy unchanged. It is thus impossible to distinguish scattered from unscattered photons on the basis of energy, and coherently scattered photons therefore degrade an image in the same way as Compton scattered photons. However, the interaction probability for coherent scatter is low, and the most probable scattering angles are small (the true to measured displacements in the image are therefore also small).
1.1.4 The Scintillation Detector.
containing a trace amount of thallium impurity (NaI(TI)) has a high fluorescence yield which is approximately proportional to the energy absorbed from the photon. These two properties, along with reasonably high atomic number and density (leading to good absorption of the incident photons) are responsible for NaI(Tl) becoming the most widely used scintillator in radionuclide studies. For any scintillator it is necessary to exclude ambient light (which is of far greater intensity than that produced by the scintillator itself) and, in the case of Nal(Tl), it is also necessary to exclude air as the crystal is hygroscopic. Absorption of water vapour causes the crystal to turn yellow and hence absorb most of the light produced - an unwanted characteristic. Nal(Tl) crystals are therefore generally encased in thin aluminium (so as to affect the passage of incident photons into the detector as little as possible) on all sides but one. On this last face, from which the light emerges, the crystal is covered with a quartz or glass 'window*. This window is hermetically sealed to the aluminium casing.
The low light level emerging from the crystal is detected, converted and amplified by a photomultiplier tube (PMT). The functioning of the tube can be considered a two-stage process. The incident light photons liberate electrons from a photosensitive material coated on the inside of the front surface of the tube. The number of electrons liberated is proportional to the amount of incident light and hence to the energy absorbed from the photon by the crystal. A very small number of electrons (a few hundred) are liberated, this number is linearly amplified by the rest of the PMT. Amplification is produced by successively accelerating the electrons between metal plates (dynodes), during each step the electrons gain sufficient kinetic energy to liberate further electrons from the dynode to which they travel. In all there are typically 12 or 14 dynodes and large amplification factors can be achieved. The mean free path of the electrons in the PMT must be large enough to allow them to gain sufficient kinetic energy to produce amplification, this is achieved by evacuating the PMT of air. Acceleration is produced by the dynodes being held at successively more positive potential. The potential difference between the point of initial liberation of the electrons (the photocathode) and the final collection point (the anode) is generally between 700 and 2CKX) volts. The amplification factor of the tube (and hence the size of the output signal for a given input) is critically dependent on the high voltage, significant changes being produced by a change of a few volt to the accelerating potential.
the energy absorbed by the crystal. The electron pulse is processed by a charge sensitive amplifier attached to the anode, producing a voltage pulse whose magnitude is proportional to the amount of light irradiating the photocathode. Energy analysis requires the size of the voltage pulses to be determined, this process is termed pulse height analysis. Generally, rather than determine the actual pulse height, it is compared to two set levels. The pulses are accepted if they lie between these two levels, which correspond to the maximum and minimum photon energies required for detection. This process is carried out in a single channel analyser, the acceptable range of photon energies is generally referred to as the energy window.
The single channel analyser produces an output pulse for each photon falling within the energy window, these pulses can then be counted over a fixed period of time and the system calibrated such that count rate can be used to infer the activity present in the sample under analysis.
1.1.5 The Anger Gamma Camera.
This device, introduced by Anger in the 1960's (Anger, 1964), has become the standard instrument used for radionuclide imaging. It has been substantially improved and modified since its introduction, but still relies on the same basic principle. The Anger camera is constructed of a single crystal of Nal(Tl), typically 50cm in diameter and 1cm thick. These dimensions depend on the object to be investigated and the energy of the photons to be imaged. The crystal is viewed by an array of close-packed (normally hexagonal) photomultiplier tubes. This array of tubes provides information regarding the photon energy (as for a conventional scintillation detector) and also position, using a 'centre of mass' calculation where the masses are replaced in the calculation by the output of the photomultiplier tubes. This calculation is performed in two dimensions to obtain an estimate of the interaction position in the crystal. Until recently the energy and position signals were obtained by analogue electronics, however there has been a move towards the situation where the signals from each photomultiplier tube will be digitised independently and all subsequent processing performed digitally.
number material (usually lead) in which there is an array of holes through which the photons may pass. Collimators can be made by drilling holes in a solid sheet, casting the collimator complete or producing it from thin sheet bent to form the hole pattern. The latter two are the normal methods of production. The most commonly used collimator has parallel holes which limit the accepted photons to (ideally) those travelling perpendicular to the camera face. In practice, to detect a sufficient number of photons, the collimator is designed to allow a small range of directions around this ideal value. The performance of a gamma camera system can be modified to suit a range of different applications by changing the collimator attached to it.
The intrinsic performance of an Anger gamma camera is generally quite poor, resulting from non-uniformity of response over its surface. There are non uniformities in energy response (ie a given energy photon 'appears' to change in energy as a function of the position at which it is incident on the camera face) and in sensitivity. These effects result in the image of a straight line of activity appearing bent and the image of a uniform source of activity appearing non- uniform. The recent, significant, improvement in gamma camera performance has largely resulted from correction of these two errors. This has become possible due to the minification of electronic components and an increase in computing power. In modern gamma camera systems the 'raw' energy and position signals are corrected 'on-line' to eliminate effects of energy and positional distortions. These are generally referred to as energy and linearity corrections.
1.1.6 Planar Imaging.
This is the standard technique used in radionuclide imaging and involves the formation of a two dimensional representation of a three dimensional source of activity. The image represents a planar projection of the object, all information regarding the depth of the source in the object is lost. In addition, the contrast in the image is generally degraded due to the superposition of over- and under lying tissues.
1.1.7 Tomographic Imaging.
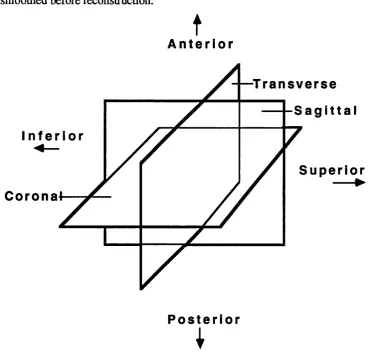
equivalent radioisotope technique first described by Kuhl in 1963 (Kuhl and Edwards , 1963). With tomographic techniques a true three dimensional image of the source distribution is obtained, although, due to difficulty in developing a suitable viewing system, this data is normally visualised as a series of abutting two dimensional 'slices' through the distribution.These planes can be taken at any angle through the distribution. Figure 1.1 shows the orientations of the three standard tomographic planes, namely transverse, sagittal and coronal (frontal).
Tomographic techniques require data to be obtained from a series of different angles around the object under investigation, this raw data then being manipulated in a reconstruction process to form tomographic images through the source distribution.
For accurate image reconstruction data must be collected from at least 180 degrees around the object (instruments achieving this sampling are termed 'full angle' devices), although to attempt to limit the effects of photon attenuation within the source, views are usually obtained from a full 360 degree arc, data from opposing views being combined (either as arithmetic or geometric means) to form the projection data for the reconstruction process. It is, however, possible to produce images from systems, termed limited angle' devices, which do not satisfy the criterion of data collection from a 180 degree arc. Reconstruction of images from projections was first investigated by Radon , who developed a general method, called the Radon transform, for image reconstruction. Single photon emission computed tomography (SPECT) systems generally employ a modification of simple back projection (called filtered back projection) for image reconstruction although iterative techniques are also used.
resolution and noise in the final image. Alternatively the projection data can be smoothed before reconstruction.
t
A n t e r i o r
— T r a n s v e r s e
S a g i t t a l
S u p e r i o r
C o r o n a l
P o s t e r i o r
I
Figure 1.1: Orientation of the three main tomographic planes.
1.2 The Need for Tomographic Data.
The main reason for the lack of development of techniques utilising true quantification of tracer uptake has been the inability to produce reliable methods to measure the activity present in a human independent of its location in, and the size and shape of, the body. Only by comparison of a detector's response to a 'phantom' (containing a known activity of tracer), accurately mimicking the source distribution under investigation, to that obtained from the patient, has it been possible to measure uptake values in-vivo. Such phantoms can only be easily produced for a very limited number of source distributions and hence investigations. The major problem preventing the development of a generalised technique is the fact that gamma rays interact with the body tissues on their way to the radiation detector and hence its response is dependent on the depth of the source in the body. Further complications arise in that the body is an inhomogeneous medium and that the gamma ray energy is reduced due to inelastic scattering, these phenomena result in varying interaction cross sections being encountered as the gamma ray travels through the body. Planar imaging with a gamma camera yields no information about the depth of a source, without this it is impossible to make a correction to the response to account for photon attenuation and scattering. Attempts have been made to overcome this problem by taking a lateral image to measure the depth of body organs (Hawkins et al, 1980), or by collecting two opposing images and producing a composite image by taking their geometric mean, this image being less sensitive to depth changes (Jasczak et al, 1977). Another possibility may be the use of two different radioisotopes (emitting gamma rays of different energy) labelled to tracers following the same physiological pathway and determining the depth of the source from the relative response at the two energies. Although these techniques have been successful in certain special circumstances they do not represent a general solution to the problem.
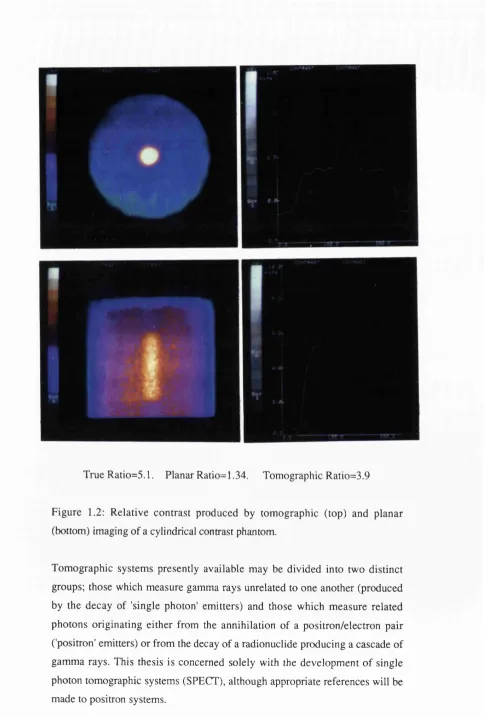
True Ratio=5.1. Planar Ratio= 1.34. Tomographic Ratio=3.9
Figure 1.2: Relative contrast produced by tomographic (top) and planar (bottom) imaging of a cylindrical contrast phantom.
Tomographic systems presently available may be divided into two distinct groups; those which measure gamma rays unrelated to one another (produced by the decay of 'single photon' emitters) and those which measure related photons originating either from the annihilation of a positron/electron pair ('positron' emitters) or from the decay of a radionuclide producing a cascade of gamma rays. This thesis is concerned solely with the development of single photon tomographic systems (SPECT), although appropriate references will be made to positron systems.
1.3 SPECT Systems.
Over the last decade, despite the many superior qualities of positron systems (Budinger et al, 1977; Phelps , 1977), a large number of SPECT machines have been developed, this is almost entirely due to the difficulty and expense of obtaining suitable pharmaceuticals labelled with positron emitting radionuclides. This section describes the systems which have been developed to acquire tomographic data.
1.3.1 Limited Angle (Longitudinal) Systems.
These systems obtain data from an angle limited to that subtended at the object by, at most, a large field of view (LFOV) gamma camera. This reduced sampling imposes serious limitations on these systems, the most important being the inability to obtain constant sensitivity and resolution throughout the images, preventing accurate quantification of the activity distribution in the object. The development of more sophisticated reconstruction algorithms has, and most likely will continue, to reduce these limitations, but it is most unlikely that they will ever be fully overcome. Other problems include a limited field of view (which may alter with distance from the detector) and difficulty in positioning the object within it. However, the attraction of these systems lies in their ability to produce tomographic data at low cost, most requiring only a special collimator and reconstruction software as an ’add on’ to an existing gamma camera/computer system.
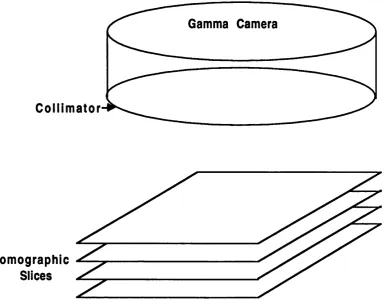
These instruments are often described as longitudinal tomographic devices due to the fact that their tomographic planes are parallel to the face of the gamma camera (Fig 1.3). In many ways these methods are analogous to conventional X-ray tomography, simply blurring out unwanted planes, the difference being that views are normally obtained with the object and detector static rather than with a moving tube and film. Likewise, the comparison of results from limited and full angle emission tomographic systems is much the same as that between conventional and X-ray computed tomography.
C o l l i m a t o r
Gamma Camera
T o m o g r a p h i c Slices
Figure 1.3: Orientation of tomographic planes from longitudinal systems.
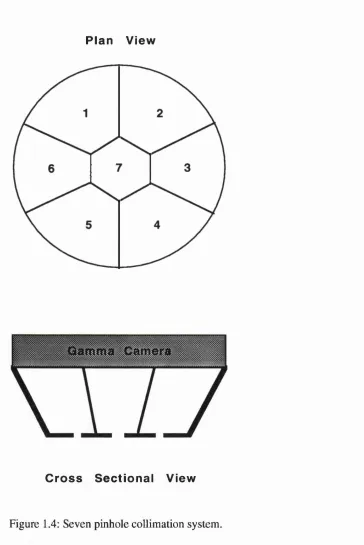
a) Seven Pinhole Collimation.
Plan View
Cross Sectional View
Figure 1.4: Seven pinhole collimation system.
b) Slant Hole Collimation.
Historically this instrument predates the seven pinhole device, having first been introduced by Muehllehner in 1971 (Muehllehner 1971). In many ways it is similar to the pinhole system, consisting of a collimator with parallel, but slanted, holes (typically inclined at 25 or 30 degrees to the vertical) fitted to a standard gamma camera. Data are obtained from different angles by rotating the
collimator on the camera either continuously or in steps. Depth information is again obtained by offsetting the views with respect to each other. As the angle of inclination of the holes is increased so the depth resolution improves (and hence inter slice crosstalk is reduced) but the field of view decreases, and so a compromise between these effects must be reached. Modifications to the system have been proposed, for instance by forming the collimator in four quarters (Goodwin, 1980) with the slope of the holes in each quarter pointing in different directions, hence limiting the number of times the collimator must be rotated to obtain the required number of views. Such a change does not effectively alter the system's intrinsic properties, only the way and ease with which it can be used. Due to conceptual similarities, the rotating slant hole collimator suffers from many of the same disadvantages as the seven pinhole device, although the magnification and field of view problems are, to a large extent, eliminated, and resolution is more constant with depth (although there is still some degradation as the distance from the coUimator increases).
c) Coded Aperture Systems.
These systems, first described by Barrett (Barrett, 1972) again involve the use of a special collimator (or collimators) in conjunction with a standard gamma camera. Barrett's system involved the use of a Fresnel zone plate forming a coded image which was interpreted by shining laser light through the image film, hence avoiding the complicated reconstruction techniques which would have been lengthy with the computer technology available at the time. Other coding plates have been proposed, as has the use of a series of plates (Renaud et al, 1979), and twin plates , one with randomly spaced pinholes which is moved with respect to the second plate containing a regular pattern of pinholes, an image being taken at each position (Koral et al, 1975, 1979). This latter system is an example of the method known as time coded aperture.
1.3.2 Full Angle (Transverse) Systems.
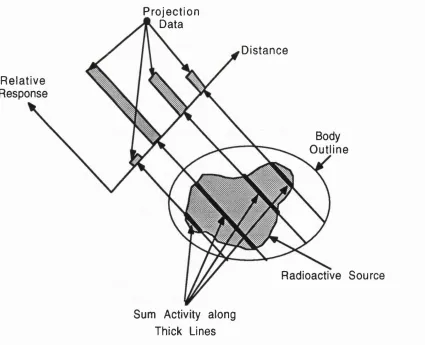
These systems collect data from an arc of at least 180 degrees around the object and subsequently reconstruct images in a plane perpendicular to the detector(s). Within the arc, data are collected at a series of angles, the information at each angle consisting of a number of line integrals of activity weighted by attenuation and detector sensitivity, each integral being taken at a different tangential position, there being a sufficient number to enclose the object. The series of line integrals at one angle is termed a projection (Fig 1.5).
The various systems available can be divided into those which can only provide tomographic data (special purpose instruments) and those which can additionally perform conventional planar imaging (general purpose instruments). The special purpose instruments may be further subdivided into those which are based on Anger gamma cameras and those which are not.
P r o je c tio n D ata
D is ta n c e
R e la tiv e R e sp o n se
Body O u tlin e
R a d ioactive S o u r c e
Sum Activity along
Thick Lines
Figure 1.5: Definition of a projection for full angle tomographic systems.
a) Non Anger Camera Based Special Purpose Instruments.
This group of instruments consist of a gantry housing a number of scintillation probes fitted with lead collimators which move around the object in a set pattern, the gamma ray trajectory being determined from the position of the probe at the time of detection and the properties of the collimation system employed. No information is generally obtained regarding the position within the probe that the event occurs, although there is one instrument (Lassen et al,
1978) which localises the event in one dimension to allow several transverse sections to be obtained simultaneously.
The performance of these systems is determined mainly by the number and size of the probes, the distance of the probes from the object and the collimation employed. A further distinction between machines can be made from the type of collimator used, most using parallel or very slightly focusing geometry, whilst one (Stoddart and Stoddart, 1979) uses sharply focusing collimators to obtain some depth information in the raw projection data.
Another common feature amongst the majority of these systems is that they collect data from only one plane (slice) of the object at a time, subsequent slices being recorded by mechanically moving the object before repeating the scanning procedure. This feature has lead to the generic term 'single-slice machine' being used by some authors to describe these systems.
A brief review of special purpose instrumentation is given below.
i) The 'Mark' Systems.
The first of these SPECT systems was developed by Kuhl in 1963 (Kuhl and Edwards, 1963), and further development led to the Mark IV device (Kuhl et al, 1976), which consists of four banks each of eight detectors fitted with long focusing collimators. To collect a full set of projections, the machine is rotated through 360 degrees (in approximately 50 seconds) during data collection, linear sampling being improved by the detectors in each bank being offset by one quarter of the detector size from those in the adjacent bank, resulting in projections being sampled at 32 linear positions.
ii) The Tomogscanner.
two, opposed, detectors. The projection data were obtained by transverse scanning of the detectors across the object (mimicking a bank of detectors), followed by rotation of the detectors in 30 steps, each of 6 degrees, to obtain full angular sampling. A second system was developed using the same principle but housing six detectors, leading to increased sensitivity over the original device.
iii) The Aberdeen Section Scanner.
The early version of this instrument (Bowley et al, 1973), developed at Aberdeen University, was essentially the same as the tomogscanner, later, improved, versions were similar in operating principle to the Mark IV system of Kuhl.
iv) The Dynamic Computer Assisted Tomograph (DCAT).
Developed by Lassen and co-workers (Lassen et al, 1978), this device consists of a gantry housing four banks of sixteen detectors which are able to rotate at high speed, allowing full angular sampling to be achieved in 5 seconds. The device has extremely high sensitivity and was developed primarily to study regional cerebral blood flow via the washout of ^^^Xe from the brain. The size of the gantry aperture limits its use to brain and skull studies in human adults. Another noteworthy property of the instrument is the ability, through the use of special collimation and three photomultiplier tubes viewing each detector crystal, to obtain three transverse slices through the object simultaneously. A derivative of the DCAT is marketed by Medimatic A/S in Denmark.
v) The Cleon Scanners.
collimators produced, within a single projection, information about the depth of sources within the object, this property is unique amongst SPECT systems. In the literature, idefitical systems are referred to as Harvard section scanners and recently introduced systems called '810' brain scanners marketed by Novo Diagnostic, Scan Detectronic and Strichman Medical are, in concept, identical. The system is currently marketed by Strichman medical under the name Neuro 900. These devices are studied in detail in this thesis, for clarity they are always referred to as the Strichman 810 or Strichman system except for simulations of the Cleon 710 collimators or where practical measurements were obtained on the Cleon 710 when it is referred to as such.
vi) ASPECT/CeraspecL
This instrument, originally introduced as the ASPECT (Genna, 1988) is noteworthy in that it involves no motion of the scintillation detector assembly. It consists of an annular scintillation crystal viewed by an array of photomultiplier tubes, positioning being achieved as in a conventional Anger gamma camera. The system is thus capable of acquiring data from all angles around the object simultaneously, and hence theoretically no detector motion is required. High sensitivity is also achieved due to the high geometrical efficiency. In fact the circular aperture of the camera is fitted with an array of parallel hole collimators (Zimmerman et al, 1992), which rotate during acquisition to allow full angular sampling of the detector to be obtained. In 1991 the system was renamed the Ceraspect due to legal complications.
b) General Purpose Instruments.
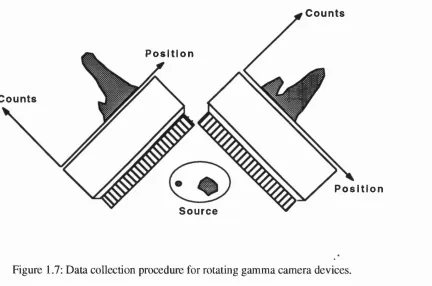
C o u n t s
C o u n t s
P o s i t i o n
P o s i t i o n
S o u r c e
Figure 1.7: Data collection procedure for rotating gamma camera devices.
The devices date from the 1970s when, due to the unavailability of rotating gantries, the detector was held stationary and the object rotated in front of it (Muehllehner, 1971). The first rotating systems were produced in house' at specialist centres (Keyes et al, 1977) and it was not until the introduction of the International General Electric 400T gamma camera in 1980 that systems became commercially available. Since that date all of the main gamma camera manufacturers have produced tomographic systems, normally as an 'add on extra' to planar devices. The only conceptual differences between the various systems lie in the movement of the camera during data collection and the number of heads employed. The standard acquisition procedure is to move the camera stepwise in a circular motion, collecting data only with the detector stationary (the so called 'step and shoot' technique), modifications to this basic motion include continuous data collection, elliptical orbits of the camera or moving the source perpendicular to the camera face at each position in the step and shoot mode to improve resolution. Most systems employ a single head, although dual-head systems, first produced in specialist centres (Jasczak et al,
1979) are now available from most manufacturers.
camera from being placed as close to them as would be ideal, resulting in a loss of resolution in the planar, and hence reconstructed, data. Two solutions to this problem were initially proposed, firstly the use of a 'cutoff head' (a camera with a flat rather than round end) (Larsson et al, 1984) and secondly the use of a slant hole collimator allowing the camera head to be tipped to avoid the shoulders whilst still keeping the collimator bores parallel to the rotation plane (Esser et al, 1984), these concepts are illustrated in Figure 1.8. Of the two, the cutoff head has gained most popularity due mainly to easier patient/camera positioning and the added difficulty in producing slant hole collimators to a high degree of accuracy. The development of rectangular head cameras has eliminated the need for the cutoff head, the camera being effectively cutoff by default due to its design. Recently fan beam and cone beam collimators have been used to alleviate this problem. These collimators preserve resolution at larger distances from the collimator surface and hence allow a larger radius of rotation to be used. The same problems are, however, encountered as for the slant hole collimator.
Since their introduction, image quality from gamma camera based systems has improved dramatically, mainly due to the introduction of microprocessor based linearity, uniformity and energy corrections to the raw data supplied by the camera head and better understanding of the quality control procedures necessary to ensure that the systems are performing optimally (Jarritt & Ell,
1984).
c) Anger Camera Based Special Purpose Instruments.
Figure 1.8 Methods of reducing radius of rotation (r) for gamma cameras: Top Standard camera and collimator
1984,1986). One four-headed system (Kimura, 1990) is currently available. The currently available devices can be divided into those which employ small field of view cameras and are dedicated to brain imaging and those using large field of view cameras for whole body studies. The small field cameras have the advantage of being able to be positioned close to the patient with a concomitant increase in spatial resolution. The larger field of view systems (which allow SPECT of the body to be performed) are unable to perform these small radius of rotation acquisitions due to geometrical restraints (the cameras come into contact with each other). Fan or cone beam collimators are then required to perform high resolution studies of the brain.
Despite the many technical complications regarding accurate alignment of the heads and their quality assurance, such systems are now in use in many centres. The ability to perform fast imaging (10 minute acquisition time) allows baseline and task data to be obtained from a patient without the need for repositioning between acquisitions (George et al, 1991).
1.4 System Characterisation and Limitations to Performance.
A SPECT system involves interaction between the data collection device and image reconstruction process. Tomograms obtained from identical raw projection data can be significantly altered by changes in reconstruction technique or the filters used in the process; conversely, small changes in the raw data (i.e by changing the energy window used during acquisition) can alter the results obtained with an identical reconstruction technique (Jarritt et al, 1980). Great care must therefore be exercised in analysing results quoted in the literature and meaningful comparison between systems can only be made when all the acquisition and data reconstruction parameters are known.
1.4.1 Simple Performance Parameters,
a) Spatial Resolution.
Two measurements of spatial resolution are required, the value within a reconstructed slice (called 'in slice' resolution or often simply just image resolution) and the value perpendicular to this plane (normally called slice thickness). Both can be measured using a line source of activity (20cm long and 1mm or less in diameter), placed at the centre of a 20cm diameter water filled perspex cylinder and orientated such that the line source is parallel to the imaging plane. The 'in slice' resolution is measured by reconstructing an image when the line source is coincident with the imaging plane and taking count profiles across the line source at different radial positions. If a single resolution value is quoted then it is normally the Full Width at Half Maximum (FWHM) of this response function, however, it is preferable to also look at the tail of the distribution, i.e by use of the Full Width at Tenth Maximum (FWTM), as the curve does not accurately follow any analytical shape and these tails can have a significant effect on image quality. Values are measured at various radial positions to determine any 'in slice' variation in image quality. Slice thickness is defined in the same manner except that the profile is formed by the count at equivalent positions on the line source in a series of abutting slices, taken either simultaneously for multi-slice machines or, with single-slice machines, sequentially as the object is incremented through the imaging plane. More normally in slice resolution is measured from the count profile across the image of a line source placed perpendicular to the imaging plane.
b) Energy Resolution.
Energy resolution of the detection system is defined, and measured, in the same way as for conventional, planar, devices (Elliott et al, 1982) and has a significant effect on the ratio of scattered to unscattered photons detected by the system for a given source. This ratio is also changed by the energy discrimination settings used, and small changes in this parameter can have a large effect on image quality (Jarritt et al, 1980), much more dramatic than in planar imaging.
c) Sensitivity.
This parameter is again routinely measured using a 20cm long, 20cm diameter cylinder, in this case filled with a known specific activity of radionuclide. The object is then scanned as for a clinical investigation and the sensitivity calculated using the formula:
Sensitivity = (Counts Recorded)/(Scan Time * Specific Activity)
In the above equation the counts recorded can be that from a single slice, all the slices obtained or, more correctly, per linear centimetre of the object.
Although it is generally preferable to obtain a high sensitivity to reduce noise levels in the image, it is important to realise that this may be achieved by allowing more scattered radiation to be detected (via changes in energy resolution or energy window), reducing collimator septal thickness or resolution, or by insufficient shielding around the photomultiplier tubes, none of which would be expected to improve image quality. Hence sensitivity values are only really meaningful when the photopeak to non photopeak ratio of detected photons is known.
The sensitivity of a system effects the number of events which will be detected from a given investigation and hence the statistical accuracy of the results obtained. It is well known in conventional imaging that the 67% confidence limit lies N„ counts either side of a pixel count N^, where:
quoted by Budinger (Budinger and Gullberg, 1974b). In this case the fractional standard deviation is given by the formula:
N„ = k*p3/4*N-l/2
Where: k is a constant (typically between 1 and 3) depending on the reconstruction algorithm.
p is the number of resolution elements covering the object. N is the number of counts in the object.
It has been stated (Todd-Pokropek and Jarritt, 1982) that k is almost independent of the reconstruction technique employed, perhaps varying at most by a factor of 2 or 3. However, the effect of such a change is equivalent to that produced by a nine fold increase in pixel count, and when viewed in terms of the cost involved in doubling the sensitivity of a gamma camera system by the addition of a second head, the reduction of k by use of a different reconstruction technique such as maximum entropy (Gull and Daniel, 1978; Kemp, 1980) should be considered.
1.4.2 Overall Performance Parameters, a) Contrast resolution.
enhancement in their images. The more important test which evaluates a systems ability to achieve absolute quantification is to compare the contrast in the object with that in the reconstructed image. The contrast of a given area is defmed in the literature in many ways, the most usual being:
Contrast = MOD {(Area Cnt - Background Cnt)/(Area Cnt + Background Cnt)}
the same number of pixels being used to define the area of interest and the background.
2 0 0
Figure 1.9: Contrast resolution phantom, sizes shown in mm.
b) Uniformity.
uniformity obtained will depend both on the compensation technique employed to account for scattered and attenuated photons and also the peak to scatter ratio in the raw data. Hence it may well occur that although a uniform image can be obtained from the source described above, a series of identical lines placed at different positions within the field of view will be reconstructed with greatly differing intensities (Flower et al, 1979). For a full evaluation of system uniformity a series of sources with differing activity distribution and scatter fractions is therefore required.
These images can be analysed in a similar manner to those obtained from a planar device. Integral uniformity is defined in terms of the maximum and minimum pixels values in the field of view by the equation:
100 X (Max Pixel - Min Pixel) / (Max Pixel + Min Pixel) %
Differential uniformity is a measure of local changes and is measured by searching the image for the maximum difference in neighbouring pixels. Differential uniformity is quoted as this maximum difference divided by the average of the two pixels and expressed as a percentage.
c) Sizing ability.
Given a knowledge of the image pixel size, the apparent reconstructed size of any region in the image can be calculated providing that its edge can be defined in some way (preferably automatically). If this process is repeated for all the slices on which an object appears then its volume can be measured. This process was first reported by Kan (Kan and Hopkins, 1979) to measure liver volume in vivo.
1.5 Artefacts.
a) Mechanical stability.
Accurate tomograms can only be reconstructed if the geometrical relationship between projections is known. In all full angle tomographic devices, the projections are taken tangentially to a circle (or set of concentric circles) and it is the centre of this circle (called the centre of rotation) together with the angular position and centre point of the projection (the position on the camera face from which the normal to the projection passes through the centre of rotation) which determines this relationship (Figure 1.10).
Zero Angle Line
Angle of Projection
Centre of Rotation Centre of
Projection
Figure 1.10: Geometrical definition of a rotating gamma camera projection.
b) Planar Sensitivity.
Variations in the sensitivity of a tomographic device will lead to inaccuracies in the projection data and hence to errors in the reconstructed image. In the case of rotating gamma cameras these errors are correlated and give rise to circular artefacts in the tomograms. They are more important the larger the object, the nearer the non uniformity to the centre point of the projection, the sharper the area of non uniformity (i.e poorer differential uniformity) and the greater the magnitude of the non uniformity. In the case of multi-detector systems the artefact is less correlated, and hence less visible, but no less important. Indeed, in clinical use it may be argued that artefacts which can be recognised as such can be ignored whilst unrecognised ones may be wrongly interpreted as clinical abnormalities. Additional errors arise if different projections have different sensitivities, either as a result of differences between detectors in a multi detector system or because of changes of response with position in an area detector device (Rogers et al, 1982). Also decay or metabolism of the radiopharmaceutical will mean that different projections are viewing different true source distributions, again leading to data inconsistency.
c) Incomplete Sampling.
The need to sample data from at least 180 degrees around an object was discussed earlier. There are, however, further requirements of the projection data which must be met. Firstly, the whole of the object must be contained within every projection and within the projection sampling should take place at a minimum of twice the highest spatial frequency required in the reconstructed image, consistent with the Nyquist sampling theory. This theory may be used to determine an approximate expression for the angle (0) between projections:
SIN(0) = D/2R where: D is the resolution in the image. R is the radius of the object.
d) Inconsistent Data.
the movement involved. It is sometimes possible to eliminate the effects of non- random motion (ie due to respiration or heart beat) by the use of physiological gating.
e) Gamma Ray Attenuation.
This causes sources of activity near the centre of an object to be detected with a lower sensitivity than those near the edge, producing tomograms with a dish shaped count profile. The magnitude of this effect will depend on the size, shape and constituents of the object, and whilst it may be possible to interpret clinical results without correction for attenuation, it presents a major problem if count density in the image is to be used to infer the specific activity at the corresponding point in the object
1.6 Clinical Utility.
measurements have been shown to be possible in the liver (Kan and Hopkins, 1979), lung (Macey and Marshall, 1982), brain (Kuhl et al, 1978), heart (Keyes et al, 1978) and thyroid (Shapiro et al, 1980) although with little clinical impact
The lack of sensitivity and the time required to move the detector(s) to obtain full angular sampling precludes the use of most SPECT machines for fast dynamic studies, exceptions being the Tomomatic and ASPECT systems described in section 1.3. A brief review of areas where SPECT has been utilised is given below.
a) The Heart.
Most work has involved the study of myocardial perfusion and metabolism through the use of ^Oljj and labelled fatty acids. Recently ECO gating has become available to enable gated blood pool data to be obtained and ^^™Tc- MIBI (Mittal et al, 1990), a thallium analogue, has been introduced. Limited angle tomographic systems have been particularly popular for cardiac studies due to the smallness and proximity of the heart to the anterior surface of the body. In the case of rotating gamma camera systems data collection is usually carried out only through a 180 degree arc, again due to the proximity of the heart to the anterior surface of the body (Coleman et al, 1982). The transverse image data is generally reorientated to form tomograms parallel and perpendicular to the long axis of the heart, making clinical interpretation easier (Pennell et al, 1991).
b) The Liver.
Full angle SPECT has been applied to the visualisation of space occupying disease in the liver with good results compared to planar radionuclide imaging and transmission CT (Khan et al, 1981a). Uptake measurements in patients with chronic liver disease have indicated the possibility, even with only crude attenuation correction, of differential diagnosis unavailable with conventional imaging (Grime et al, 1983).
c) The Lungs.
ventilation (with 81mj^ or gas) with perfusion images (obtained using 9901^0 labelled macroaggregates). Consideration of radiation dose to the patient precludes the use of ^^^Xe for SPECT ventilation studies, limiting the applicability of the technique. In comparison of SPECT and planar perfusion imaging, little gain has been shown with the tomographic technique, although slightly better visualisation and localisation has been reported (Khan & Ell, 1981b). 99mjç labelled aerosols and technegas (99mxc attached to small carbon particles) have been used in planar lung imaging but have not been utilised to obtain SPECT data. Improved diagnostic accuracy has been reported from a study utilising *^“ Kr ventilation and ^°^Tc perfusion tomograms along with the inclusion of a novel attenuation correction procedure allowing accurate quantification of a ventilation/perfusion ratio (Macey and Marshall, 1982; Tsui et al, 1989 ; Bailey et al, 1987).
d) The Skeleton.
The low sensitivity of SPECT instruments prevents their use for whole body skeletal imaging. However, the greater positional accuracy obtainable from tomograms can be helpful when planar images are unclear, for instance in helping to decide whether a lesion lies inside or outside the skull. A technique for the quantification of uptake of ^ ^ T c labelled MDP has been reported with interesting clinical results (Ell et al, 1980), this method is described in more detail in chapter 2. SPECT has been used with success in the study of lower back pain (Buscombe et al, 1990,1991).
e) The Brain.
Space occupying disease has been studied by many groups with both rotating gamma camera and multi-detector systems. For these investigations a non lipophilic 99mjç labelled radiopharmaceutical (pertechnetate, gluconate, glucoheptonate) is used to study the breakdown of the blood-brain barrier. Many results indicate improved diagnostic accuracy with SPECT, sensitivity being increased by up to 15% (Ell et al, 1980), there are, however, also conflicting reports to be found in the literature (Watson et al, 1980).
(Hill et al,1981; EU et al, 1983).The distribution in rats has been reported to be identical to that obtained from an injection of microspheres, indicating that the radiopharmaceutical distributes in the brain in proportion to regional blood flow (Kuhl et al, 1982). However, in man, although clearly related to blood flow the uptake appears to be effected by other factors (i.e lung function) and so it is unlikely that rCBF measurement in absolute terms (ml/min/lOOg) will be possible. In 1984, ^ ^ T c hexa methyl propylene amine oxime (HMPAO) was introduced as a similar marker of regional cerebral blood flow. Its reduced cost and avaUability make it more attractive than the ^^^I labeUed compounds, its use is described more fully in chapter 2. The relatively large signal which can be obtained from the brain utilising this agent has lead to the introduction of task studies (Ring et al, 1991). In these studies the patient is first studied at rest, after which a task is performed (for example reading, listening or finger movement) and a second injection of ^^*”Tc-HMPAO is administered. The activation of the brain is determined by the differences between the baseUne and task data.
Regional cerebral blood flow has also been studied tomographically by the analysis of ^^^Xe washout from the brain using a multi-detector system (Tomomatic), promising results having been reported (Lassen et al, 1981). The study of receptor sites in the brain has recently become feasible with the introduction of several labelled tracers. Amongst others, the Dopamine D2 receptors can be studied with IBZM (Verhoeff et al, 1991a), benzodiazepine receptors with flumazenil (Verhoeff et al, 1991b), serotonin S2 receptors with ketanserin and the opiate receptors with dipemorphine. A detailed review of the current state of receptor studies has recently been given by Verhoeff (Verhoeff,
1991c).
1.7 Aim and Scope of the Thesis.
A tomographic system consists of a data collection device, software or hardware to correct for known, measurable, errors in the data and a reconstruction algorithm, often incorporating a method for attenuation correction. This thesis is concerned with evaluating the constraints imposed by non perfect data collection hardware on the ability to accurately quantify radiopharmaceutical distributions in-vivo and to investigate methods of reducing the errors involved. It is impossible to fully evaluate the improvements which such modifications may make without development of reconstruction techniques tailored to the data collection system. Development of such reconstruction techniques is beyond the scope of this work, however, conclusions are made in terms of the improvement in the raw data and results obtained utilising existing reconstruction techniques. Problems which arise in data collection are:
Limited resolution. Limited sensitivity.
Attenuation and scatter of photons. Patient movement.
Non stationary detector response. Positional inaccuracies in the detector.
Movement artefacts are greatly reduced in the case of head scanning due to the lack of internal motion and the clinical acceptability of strapping the head in position. Attenuation effects are reduced by the relatively small size of the head, and correction for scatter and attenuation is further simplified by the source geometry and composition being largely known and patient independent. For these reasons, and the great interest currently being shown in the measurement of regional cerebral blood flow (rCBF) and receptor uptake, this thesis concentrates on the development of systems for brain and skull imaging.
The effect that limited resolution and noise (due to finite system sensitivity) have on the accuracy of uptake quantification and how the errors may by reduced via changes in detector collimation are studied.
distribution encountered in rCBF measurement. These investigations are described more fully in chapter 2 together with the way in which a non perfect data collection system degrades the results obtained.
To accurately determine the response functions of the various detector configurations, a Monte Carlo photon transport simulation is developed and tested in chapter 3.
The simulation is utilised in chapter 4 to predict the response of a series of different collimators attached to both gamma camera and multi-detector based tomographic systems and to assess the merits of each. A method of predicting image quality from a reduced collimator response is developed and tested in chapter 5. An 'ideal' collimator (i.e one for which there is the lowest error due to the combination of resolution and statistical inaccuracies) is designed for the Strichman multi-detector system. This system was chosen for further study as it is shown in chapter 4 to possess far greater potential than the gamma camera for accurate quantification of uptake in the head.
CHAPTER 2
METHODS FOR THE
2.1 Introduction.
The performance of the systems described later in this thesis will be assessed in terms of the fundamental parameters of image resolution and sensitivity, but it is also important for their effect on clinical data to be evaluated. Two clinical studies have been chosen for this work, representing the limits of uptake pattern found in brain and skull imaging. The first (the skull uptake test) deals with a relatively discrete uptake pattern containing regions of sharply varying activity, whilst the second (the measurement of cerebral blood flow) involves a more uniform distribution of activity throughout the brain. In this chapter the two tests are briefly described, and the effect of non perfect detection systems on both the quality of images obtained and the accuracy of quantitative information which may be derived are discussed.
2.2 The Skull Uptake Test.
This test was developed at the Middlesex Hospital in 1979 as an addition to routine bone scanning utilising 550MBq ^^°^Tc labelled phosphonates. Three tomographic slices of the skull are obtained using the Cleon 710 at 1.25cm intervals, the lowest being positioned 2.5cm above a line joining the outer canthus and external auditory meatus. Scanning commences two hours after injection of the radiopharmaceutical. This time was chosen following investigation of the uptake in a single skull slice throughout a period of six hours after injection. The result of this study is shown in Figure 2.1, and demonstrates that scanning two hours after injection will eliminate any effect of uptake dynamics on the uptake value obtained.
The uptake in the skull slice is calculated from a simple ratio of the pixel counts in the slice compared to that obtained from a ring phantom containing a known concentration of ^^“^Tc. For a simple proportion calculation to produce an accurate value, the instrument must respond linearly to increasing amounts of activity, this property has been verified for the Cleon device as shown in Figure 2.2 (Ell et al, 1980).
0.451
E 0.35 - O
3
□ □ □ □ □
<S
□□
0.25-3
(/>
0.15
0 6 0 1 2 0 1 80 2 4 0 3 0 0 3 6 0
Time P.l (mine)
Figure 2.1: Decay corrected skull uptake versus time after injection.
0.6-1
1 0.5
-o
3
g 0.4 -o a g 0.3-u c o
O ideal Response
0.2 -T3
£
3
to to o S 0.1
-0.0
0 . 0 0 . 1 0 . 2 0 . 3 0 . 4 0 . 5
True Concentration (uCi/mi)