A Link-Based Cluster Ensemble Approach For
Improved Gene Expression Data Analysis
P.Balaji, Dr. A.P.Siva Kumar
Abstract: It is difficult from possibilities to select a most suitable effective way of clustering algorithm and its dataset, for a defined set of gene expression data, because we have a huge number of ways and huge number of gene expressions. At present many researchers are preferring to use hierarchical clustering in different forms, this is no more totally optimal. Cluster ensemble research can solve this type of problem by automatically merging multiple data partitions from a wide range of different clusterings of any dimensions to improve both the quality and robustness of the clustering result. But we have many existing ensemble approaches using an association matrix to condense sample-cluster and co-occurrence statistics, and relations within the ensemble are encapsulated only at raw level, while the existing among clusters are totally discriminated. Finding these missing associations can greatly expand the capability of those ensemble methodologies for microarray data clustering. We propose general K-means cluster ensemble approach for the clustering of general categorical data into required number of partitions.
Index Terms: Clustering, Categorical data, Gene data, DNA, Ensemble Approach.
————————————————————
1 INTRODUCTION
The usage of clustering is crucial both for extracting and visualizing useful information from the micro-array data.
1.1 Different Algorithms
We use different algorithms (or even a same algorithm with different framework) which often provide us distinct clusterings. As the result, it is purely difficult for normal users to decide which type of algorithm and framework will be optimal for the given set of data this is because no single- simple/ pass clustering algorithm can achieve the best for all datasets (A.L.N. Fred and A.K. Jain 2005), and mining all types of cluster structures and shapes presented in data is impossible for any existing clustering algorithm (T. Boongoen, Q. Shen, and C. Price, 2010).
1.2 K-means clustering for gene analysis
Clinical researchers extremely use simple clustering methods, such as k-means and agglomerative hierarchical(P.J. Rousseeuw and L. Kaufman, 1990) to cluster cancer microarray samples, in spite of the arrival of such several new techniques those capitalize on inherent characteristics of a gene expression data (high dimensionality and noise) to improve clustering quality (e.g. D. Cristofor and D. Simovici, 2002; A. Strehl and J. Ghosh, 2002; S. Guha, R. Rastogi, and K. Shim, 2000) says that, this is because the use of those methods is difficult for non-expert users.
1.2 Recent Development
In recent days, consensus clusteringsor cluster ensembleshave emerged as effective, simple, one-stop methods for improving the quality and robustness of the clustering results. Those Cluster ensembles combine the multiple clustering principles (referred to as ‗ensemble members‘ or ‗base clusterings‘) where the base clusterings contain diversity in their picking of clusters by: (i) employing multiple clustering algorithms D. Gibson, J. Kleinberg, and P. Raghavan, 2000); (ii) using a single clustering algorithm with random parameter initializations (M.J. Zaki and M. Peters, 2005,D. Liben-Nowell and J. Kleinberg, 2007); (iii) using different subsets of gene (A.K. Jain and R.C. Dubes, 1998, T. Boongoen, Q. Shen, and C. Price, 2010);(iv) selecting a random number of clusters (Fred and Jain, 2005; C. Domeniconi and M. Al-Razgan, 2009); or (v) using data sampling techniques. The Most existing methods will compare cluster associations between each of the N samples in the dataset to produce an N × N pairwise similarity matrix [i.e. consensus (C. Domeniconi and M. Al-Razgan, 2009), agreement and co-association (Fred and Jain,2005) matrices], to which a consensus function (e.g. agglomerative hierarchical clustering) is applied to acquire the final data partition. Which will produce the data clusters as in the k-means algorithm.
___________________________
P.Balaji, Dr. A.P.Siva Kumar
Department Of Computer Science & Engineering
Jawaharlal Nehru Technological University Anantapur
With the ensemble of the two base clusterings Π = {π1, π2}
and the five samples (x1 …x5) those are given in figure 1,
we produce the end clusters.
1.4 Modified Approach
An alternative approach (Brodley and Fern, 2004; Ghosh and Strehl, 2002) to the pairwise similarity methods which makes use of N×P binary cluster-association matrix (BM) (in whichP denotes the total number of clusters in the ensemble). Figure 1 depicts an example of such procedure that has been generated from those ensembles of the data.Despite reported efficiency and success, these methods generate the optimal clustering results based on the incomplete information of the cluster ensemble. The underlying association matrix gives sample–cluster relations between them at t raw level and totally ignores the relations among clusters. As the result, performance of such approaches may subsequently be degraded as many as matrix entries are left unknown, each referred with zero. In response to it, we prefer a new method—the LCE—for the clustering ofdata. It significantly extends that of the hybrid bipartite graph formulationtechnique (HBGF) (Brodley and Fern,2004), by applying the graphbasedconsensus function to the improved cluster association matrix, instead of conventional BM. This article extends its application to the problem of clustering cancer microarray samples, and will beshown to refine cluster-association matrix, as well as minimizingthe number of such unknown entries and, hence, we can increase accuracy; moreover for it, it can easily augment or replace a researcher‘s existing clustering tools. And also we can reduce the clustering time so that we can get quick results as compared to normal approach.
2.
MODEL
OF
MODIFIED
K-MEANS
CLUSTERING FOR GENE ANALYSIS
The proposing LCE methodology can be illustrated in Figure 2. This includes three major steps in process: (i) creating M base groupings or clusters to form a cluster ensemble;
Figure 2: gene cluster model
(ii) Creating the refined cluster-association matrix (RM) by using the link-based similarity algorithm procedure (Weighted Connected-Triplets, WCT); and (iii) by generating the destined data partition by utilizing the modified k-means clustering partitioning technique as the consensus function. This framework is similar to HBGF technique (Fern and Brodley, 2004), and except the second step which is introduced for developing a refined information matrix.
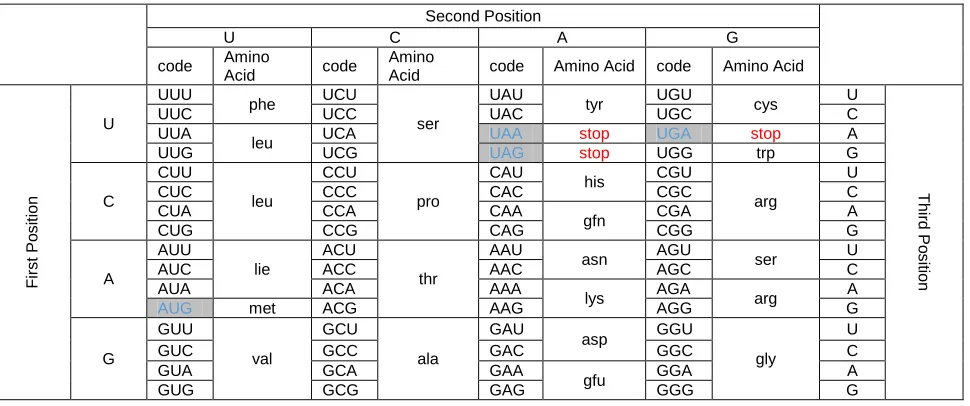
2.1 Gene data Acquisition
The single 'gene' is the most similar that to a single 'word' inEnglish language. Nucleotides (molecules) those make up the genes can be seen as 'letters' in English language. The single gene can have a small numbers of nucleotides or the large number of nucleotides, in same way that the word can be large or small (e.g. 'electrophysiology' vs 'cell'). The single gene often interacts with the neighboring genes to
Π*
Consensus
Function ΠN
Π1
Π2 Dataset
S Clustering 2
Clustering 11
Clustering N
ψ
Figure 1: Ensemble Approach
Acquisition
Categorical to Numerical Interchange
Treatment of Missing Values by Imputation
by
Radix N to decimal Conversion
Acquisition
Modified k-means algorithm
Cluster Set
produce the cellular function and can even be ineffectual without the neighboring genes. It can be seen in same way that the 'word' can have meaning only in the context of a 'sentence.' The series of the nucleotides can be put to together without forming the gene, like a string of letters can be put together without forming the word in the code. Eg:ujkgipm
Figure 3: Genetic Structure in DNA
2.2 Categorical to numerical exchange
Gene data consists of n*3 table like structure and while representing it row represents nucleotides and column for
each gene. As there are only n nucleotides replace every nucleotide to respective numbers by using the replacement techniques. We can represent the model frame work as Π{A,C,I,T}={C11
,C12,C13……C1N} Π{1,2,3,4}={C21
,C22,C23……C2N}
GENE CODON 1 CODON 2 CODON 3
I A C I
II I T A
III A C T
IV I I T
GENE CODON 1 CODON 2 CODON 3
I 1 2 3
II 3 4 1
III 1 2 4
IV 3 3 4
Figure 4: State change
2.3 Treatment of Missing Values (Imputation)
At some places in the datasets there may occur missing values which will decrease the quality of the data partitioning. So we go for data treatment by calculating the means for individual columns and replacing the data with the mean. Hence we can bring some more quality into the algorithm.
X{n} ={Σi=1 to n (X i,n)}/n
S{X1,X2,Ø,….,Ø,...XN}↔S1{X1,X2,Xn,…,Xn,..,XN}
Here we use Expectation-Maximization algorithm for replacing the imputed values or we can say that the data set will be put to preprocess before we apply the clustering algorithm. Hence first we will apply the Expectation-Maximization algorithm to the dataset before the original clustering algorithm to get more accuracy.
Second Position
U C A G
code Amino
Acid code
Amino
Acid code Amino Acid code Amino Acid
Firs
t
P
o
s
it
ion
U
UUU
phe UCU
ser
UAU
tyr UGU cys U
Thir
d
P
o
s
it
ion
UUC UCC UAC UGC C
UUA
leu UCA UAA stop UGA stop A
UUG UCG UAG stop UGG trp G
C
CUU
leu
CCU
pro
CAU
his CGU
arg
U
CUC CCC CAC CGC C
CUA CCA CAA
gfn CGA A
CUG CCG CAG CGG G
A
AUU
lie
ACU
thr
AAU
asn AGU ser U
AUC ACC AAC AGC C
AUA ACA AAA
lys AGA arg A
AUG met ACG AAG AGG G
G
GUU
val
GCU
ala
GAU
asp GGU
gly
U
GUC GCC GAC GGC C
GUA GCA GAA
gfu GGA A
GUG GCG GAG GGG G
Fig 6: Replacing missing values with mean
2.4 Radix N-Conversion
As we have the values only up to the total number of codons in the gene data, We have to convert it into Base 10 variable set. Let S{ X1,X2,Xn,…,Xn,..,XN } be a variable gene data where Xi be a particular gene of n codons then it will be having up to values n from 1. It will emerge with 2 cases.
Case 1: If n=10
There need not need of conversion
Case 2: If n≠10
Convert the total dataset into base 10.
1. Let n be the number of digits in the number. For example, 104 has 3 digits, so n=3.
2. Let b be the base of the number. For example, 104 is decimal so b = 10.
3. Let s be a running total, initially 0.
4. For each digit in the number, working left to right do: Subtract 1 from n. multiply the digit times bn and add it to s.
5. When your done with all the digits in the number, its decimal value will be s
S{ X1,X2,X3,…,,..,XN } S1{Y1,Y2,Y3,…..,YN }
2.5 K-means algorithm
The k-means algorithm is the most globally used clustering algorithm and it can be applied to many fields in science and technology. But one of the problems of this k-means algorithm is it may produce null clusters depending on the initial center vectors. For static dataset execution of k-means algorithm, this is considered as insignificant and also can be solved by the execution of the algorithm for many number of times. In those situations, where k-means can be used as the integral part of higher level applications, this null cluster problem can produce anomalous behavior of that system and it may lead to the significant performance degradation. Hence we propose modified K-means Algorithm.
3. MODIFIED K-MEANS ALGORITHM
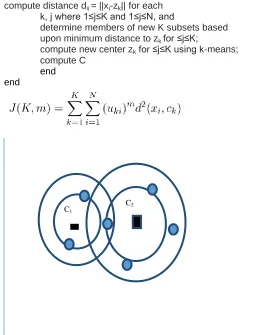
The execution steps of the m_k-means algorithm to form clusters are essentially similar to those of the original k-means algorithm. The processor maintains the cluster structures in its own local memory and iterates through the steps of the m_k-means algorithm to evaluate a final set of cluster centers Z. The execution steps to be followed are summarized below.
Input: a set D of d-dimensional data and an integer K.
Output: K clusters
Algorithm:
begin randomly pick K points ∈D to be initial means; while measureM is not stable do
begin
compute distance dij = ||xj-zk|| for each k, j where 1≤j≤K and 1≤j≤N, and
determine members of new K subsets based upon minimum distance to zk for ≤j≤K;
compute new center zk for ≤j≤K using k-means; compute C
end end
Clustering in gene expression data sets is a challenging problem. Different algorithms for clustering ofgenes have been proposed. However due to the largenumber of genes only a few algorithms can be appliedfor the clustering of samples. k-means algorithm andits different variations are among those algorithms.But these algorithms in general can converge onlyto local minima and these local minima are significantlydifferent from global solutions as the numberof clusters increases
4. RESULTS
Experimental Work: Experimental work was designed tocompare the performance of proposed K-mean algorithm.Number of data elements selected was 1000. And forthe sake of experiment, 8 numbers of clusters (k) wereentered at run time. The process was repeated 10 times fordifferent data sets generated by MATLAB. The
0 1 2 3 4 5
0 5 10 15
C2 C1
proposedK-mean algorithm is efficient because of less number ofiterations and improved cluster quality, as well as reducedelapsed time.In Figure 2, Basic and proposed K-mean clusteringalgorithms are compared in terms of different data sets.For each run different data sets are generated byMATLAB and entered, to observe the number ofiterations.In Figure 3, Basic and proposed K-mean clusteringalgorithms are compared in terms of same data set. Foreach run same data set is entered, to observe that at eachtime numbers of iterations are different in basic K-meanclustering algorithm. The numbers of iterations are fixedin proposed K-mean clustering algorithm because initialcentroids are not selected randomly.Basic K-mean clustering algorithm gives differentclusters, as well as clusters size differs in different runs.Table 1 shows different results for same data set as wellas elapsed time
Table 1: For different data set
We can represent the abovetable in graphical interface bar chart as in figure 7.
Fig. 8: For different data set
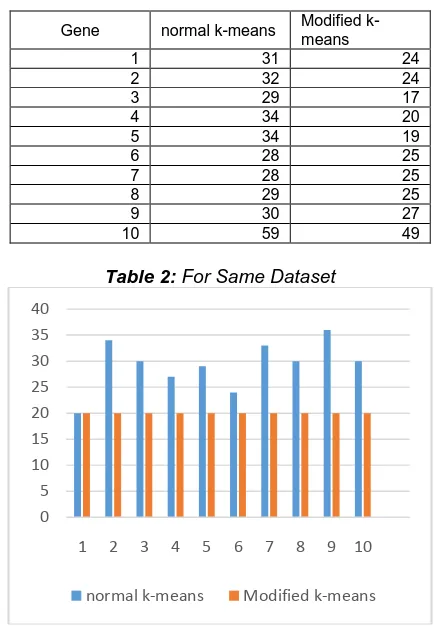
Proposed K-mean clustering algorithm gives sameclusters, as well as clusters size is same in different runs.Table 2 shows same number of iterations and cluster size. In this as the size of data becomes high the value of the iterations becomes much higher and the time complexity will be high. Hence by considering it for the genetic data as the total number of genes will be in the order of merely thousands we can go through the modified k-means approach which
will produce the more efficient results in less number of iterations. As the same mean will be there for cluster there won‘t be change in any of the iteration to other.
Gene normal k-means Modified k-means
1 31 24
2 32 24
3 29 17
4 34 20
5 34 19
6 28 25
7 28 25
8 29 25
9 30 27
10 59 49
Table 2: For Same Dataset
Fig. 9: For same data set
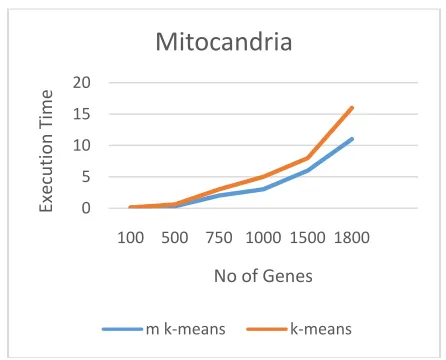
As a result, many categorical data clustering algorithms have been introduced in recent years, withapplications to interesting domains such as protein interaction data . The initial method was developed in by making use of Gower‘s similarity coefficient. Following that, the k-modes algorithm in extended the Conventional k-means with a simple matching dissimilaritymeasure and a frequency-based method to updatecentroids (i.e., clusters‘ representative). For the more values in the case of gene data the normal k-means and modified k-means algorithm will show the following results in the case of yeast gene and mitocandria. Here we can neatly observe that the number of iterations will be reduced as compared to that of normal k-means algorithm to modified k-means algorithm. Hence even though it have more executing steps due to this the execution time becomes low in the case of the modified approach.
normal k-means
Modified k-means
1 31 24
2 32 24
3 29 17
4 34 20
5 34 19
6 28 25
7 28 25
8 29 25
9 30 27
10 59 49
0 10 20 30 40 50 60 70
1 2 3 4 5 6 7 8 9 10
normal k-means Modified k-means
0 5 10 15 20 25 30 35 40
1 2 3 4 5 6 7 8 9 10
Figure 10: Representation of Graph between Execution Time and Genes in Yeast Gene
Figure 10: Representation of Graph between Execution Time and Genes in Yeast Gene
Conclusion:
This paper presents a novel, highly effective link-basedcluster ensemble approach to categorical data clustering. The empirical study, with different ensembletypes, validity measures, and data sets, suggests that theproposed link-based method usually achieves superiorclustering results compared to those of the traditionalcategorical data algorithms and benchmark cluster ensemble techniques. The prominent future work includes anextensive study regarding the behavior of other link-basedsimilarity measures within this problem context. Also, thenew method will be applied to specific domains, includingtourism and medical data set.
References:
[1] P.J. Rousseeuw and L. Kaufman, Finding Groups in Data: Introduction to Cluster Analysis. Wiley Publishers, 1990.
[2] J. Kittler, M. Hatef, R. Duin, and J. Matas, ―On Combining Classifiers,‖ IEEE Trans. Pattern Analysis and Machine Intelligence, vol. 20, no. 3, pp. 226-239, Mar. 1998.
[3] J.C. Gower, ―A General Coefficient of Similarity and Some of ItsProperties,‖ Biometrics, vol. 27, pp. 857-871, 1971.
[4] D. Cristofor and D. Simovici, ―Finding Median Partitions UsingInformation-Theoretical-Based Genetic Algorithms,‖ J. UniversalComputer Science, vol. 8, no. 2, pp. 153-172, 2002.
[5] A. Strehl and J. Ghosh, ―Cluster Ensembles: A Knowledge Reuse Framework for Combining Multiple Partitions,‖ J. Machine Learning Research, vol. 3, pp. 583-617, 2002.
[6] S. Guha, R. Rastogi, and K. Shim, ―ROCK: A Robust ClusteringAlgorithm for Categorical Attributes,‖ Information Systems, vol. 25, no. 5, pp. 345-366, 2000.
[7] G. Karypis and V. Kumar, ―Multilevel K-Way Partitioning Scheme for Irregular Graphs,‖ J. Parallel Distributed Computing, vol. 48, no. 1, pp. 96-129, 1998.
[8] C. Domeniconi and M. Al-Razgan, ―Weighted Cluster Ensembles: Methods and Analysis,‖ ACM Trans. Knowledge Discovery from Data, vol. 2, no. 4, pp. 1-40, 2009.
[9] X.Z. Fern and C.E. Brodley, ―Solving Cluster Ensemble Problems by Bipartite Graph Partitioning,‖ Proc. Int‘l Conf. Machine Learning (ICML), pp. 36-43, 2004.
[10] D. Gibson, J. Kleinberg, and P. Raghavan, ―Clustering Catego-rical Data: An Approach Based on Dynamical Systems,‖ VLDB J.,vol. 8, nos. 3-4, pp. 222-236, 2000.
[11] A.L.N. Fred and A.K. Jain, ―Combining Multiple ClusteringsUsing Evidence Accumulation,‖ IEEE Trans. Pattern Analysis and Machine Intelligence, vol. 27, no. 6, pp. 835-850, June 2005.
[12] M.J. Zaki and M. Peters, ―Clicks: Mining Subspace Clusters inCategorical Data via Kpartite Maximal Cliques,‖ Proc. Int‘l Conf.Data Eng. (ICDE), pp. 355-356, 2005.
[13] D. Liben-Nowell and J. Kleinberg, ―The Link-Prediction Problem for Social Networks,‖ J. Am. Soc. for Information Science and Technology, vol. 58, no. 7, pp. 1019-1031, 2007.
[14] A.K. Jain and R.C. Dubes, Algorithms for Clustering. Prentice-Hall, 1998.
[15] T. Boongoen, Q. Shen, and C. Price, ―Disclosing False Identity through Hybrid Link Analysis,‖ artificial Intelligence and Law, vol. 18, no. 1, pp. 77-102, 2010.
0 50 100 150
Exe
cu
tio
n
T
im
e
No of Genes
Yeast Gene
m k-means k-means
0 5 10 15 20
100 500 750 1000 1500 1800
Exe
cut
ion
T
im
e
No of Genes