kOH.\U.
2 8 C 7 7 1 3 5 1 XSTUDIES INTO THE ROLE OF GLUCOSE
TRANSPORTER FUNCTION IN INSULIN
RESISTANCE
A Ph.D. dissertation subm itted
by Lee George Daniel Fryer
B.Sc.(Hons), Bath
D epartm ent o f Medicine
The Royal Free Hospital
ProQuest Number: 10106675
All rights reserved
INFORMATION TO ALL USERS
The quality of this reproduction is dependent upon the quality of the copy submitted.
In the unlikely event that the author did not send a complete manuscript
and there are missing pages, these will be noted. Also, if material had to be removed, a note will indicate the deletion.
uest.
ProQuest 10106675
Published by ProQuest LLC(2016). Copyright of the Dissertation is held by the Author.
All rights reserved.
This work is protected against unauthorized copying under Title 17, United States Code. Microform Edition © ProQuest LLC.
ProQuest LLC
789 East Eisenhower Parkway P.O. Box 1346
ABSTRACT
Peripheral tissue insulin resistance is a key factor in the pathogenesis of type
II diabetes mellitus and a risk factor for hypertension and cardiovascular disease.
The mechanisms underlying this resistance remain unclear. Studies have shown
defects in many biochemical pathways, indicating that an early step in insulin
action is involved. Glucose transport in muscle and adipose tissue is the earliest
and rate limiting step in glucose metabolism, and is decreased in several insulin
resistant states. The aim of this project was to investigate the role of glucose
transporter expression and function in insulin resistance.
I raised and purified antibodies specific to different transporter isoforms in
order to assess tissue glucose transporter levels.
Neonatal streptozotocin-injected rats showed marked glucose intolerance, but
were not insulin resistant, indicating that hypoinsulinaemia pe r se does not lead
to insulin resistance.
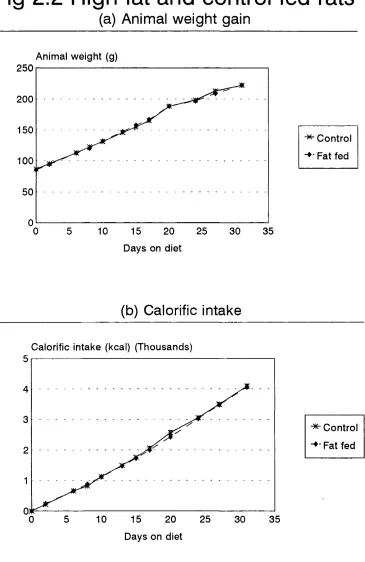
High-fat fed rats became mildly glucose intolerant, and showed a 3 7 %
decrease in insulin sensitivity. Adipocyte glucose transport was decreased,
although not significantly, by 2 0 % . Adipocytes showed a 3 0 % reduction in
GLUT4 levels and 3 4 % decrease in insulin induced translocation. GLUT1 levels
were unchanged. In skeletal muscle, diaphragm and heart, GLUT4 and GLUT1
explain insulin insensitivity in fat, it cannot explain it in the tissues which are
the major site for whole body disposal.
The proportion of saturated and mono-unsaturated fatty acids were increased
in membrane phospholipids of skeletal muscle, heart and diaphragm in fat fed
rats, with a concomitant decrease in linoleic acid. There was also a reduction
in cholesterol [phospholipid ratio. Membrane lipid fluidity was unchanged,
suggesting that the reduction in cholesterol [phospholipid ratio compensates for
the increase in saturated fatty acids, thus maintaining normal fluidity.
Preliminary studies on cirrhotic subjects indicated no changes in glucose
uptake, GLUT4 levels or translocation in adipocytes, or in skeletal muscle
GLUT4.
Thus, these studies indicate that in insulin resistant states changes in glucose
transporter levels are not found in the major tissues for insulin stimulated
glucose disposal, although they are sometimes found in adipose tissue. Changes
ACKNOWLEDGEMENTS
The work described in this thesis was carried out in the Department of
Medicine at the Royal Free Hospital. I am grateful to Professor N. McIntyre and
Dr. Y. Kruszynska for the laboratory facilities and their supervision of the
project. I would like to thank the British Diabetic Association and the
Department of Medicine at the Royal Free Hospital for financial support.
I am also grateful to Dr. S. Baldwin for his help in raising the anti-glucose
transporter antibodies, and to Dr. D. Harry for assistance in measuring
membrane lipid composition.
In particular, I am thankful to my parents and family, and to Dr. Emma Hern,
CONTENTS
Abstract 2
Acknowledgem ents 4
Contents 5
List of figures 13
List of tables 17
Abbreviations 18
Publications 21
Chapter 1. INTRODUCTION
1.1 Insulin 22
1.1.1 Actions of insulin 25
1 .1 .1 .1 The insulin receptor 28
1 .1 .1 .2 The insulin signal 3 0
1 .1 .1 .3 Effects of insulin 3 6
1 .2 Diabetes mellitus and insulin resistance 38
1.2.1 Type I diabetes mellitus 39
1 .2 .2 Type II diabetes mellitus 39
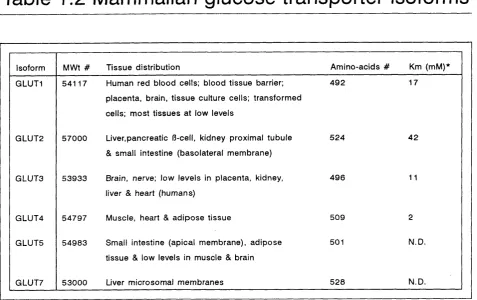
1 .3 Mamm alian glucose transport 47
1 .3 .2 GLUT2 (Liver-type glucose transporter) 56
1 .3 .3 GLUT3 (Foetal muscle/brain-type glucose transporter) 60
1 .3 .4 GLUT4 (M uscle/adipocyte-type glucose transporter) 61
1 .3 .5 GLUT5 (Small intestine-type glucose transporter) and the pseudogene
GLUT6 69
1 .3 .6 GLUT? (Hepatic endoplasmic-reticulum glucose transporter) 7 0
Chapter 2. ESTABLISHMENT OF A N IM A L MODELS OF INSULIN RESISTANCE
2.1 Introduction
2.1.1 Models 72
2 .1 .1 .1 Neonatal streptozotocin injected rats 72
2 .1 .1 .2 High-fat fed rat 75
2 .1 .2 Oral glucose tolerance test 77
2 .1 .3 Euglycaemic-hyperinsulinaemic glucose clamp 78
2 .1 .4 Glucose turnover 8 0
2 .2 Methods
2.2.1 Animals 81
2 .2 .1 .1 Neonatal streptozotocin injected rats 81
2 .2 .1 .2 High-fat fed rat 81
2 .2 .2 Oral glucose tolerance test 83
2 .3 Results
2.3.1 Neonatal streptozotocin injected rat 88
2 .3 .1 .1 Oral glucose tolerance test 88
2 .3 .1 .2 Euglycaemic-hyperinsulinaemic glucose clamp 90
2 .3 .2 High-fat fed rats 91
2 .3 .2 .1 Oral glucose tolerance test 91
2 .3 .2 .2 Euglycaemic-hyperinsulinaemic glucose clamp 93
2 .4 Discussion
2.4.1 Neonatal streptozotocin injected rat 95
2 .4 .2 High-fat fed rat 97
Chapter 3. MATERIALS AND METHODS
3.1 Isolation of adipocytes 100
3 .2 SDS/polyacrylamide gel electrophoresis (SDS/PAGE) 102
3 .3 W estern blotting and immunodetection of proteins 103
3 .3.1 Quantitative Western blotting 105
3 .4 Protein assays 109
3 .4.1 Bradford protein assay 109
3 .4 .2 Lowry protein assay 110
3 .5 Thiol assay 110
3 .6 Insulin assay 111
3 .8 Marker enzyme assays 115
3.8.1 5 ' nucleotidase 115
3 .8 .2 Uridine diphosphate (UDP)-galactose: N-acetylglucosamine galactosyl
transferase 116
3 .8 .3 Citrate synthase assay 117
3 .9 Statistical analysis 117
Chapter 4. PREPARATION AND PURIFICATION OF ANTI-PEPTIDE ANTIBODIES
4.1 Introduction
118
4.2 Methods
4 .2 .1 Peptide synthesis 119
4 .2 .2 Conjugation of peptides to keyhole limpet haemocyanin (KLH) 124
4 .2 .3 High performance liquid chromatography (HPLC) 125
4 .2 .4 Amino acid analysis 126
4 .2 .5 Immunisation of rabbits 127
4 .2 .6 Preparation of antisera 127
4 .2 .7 Enzyme-linked immunosorbent assay (ELISA) 128
4 .2 .8 Affinity purification of anti-peptide antibodies 129
4 .2 .9 Antibody biotinylation 134
4 .2 .1 0 Sandwich ELISA 136
4 .3 Results
4 .3 .1 Peptide synthesis 137
4 .3 .1 .1 C-terminal peptide of GLUT2 137
4 .3 .1 .2 C-terminal peptide of GLUT4 139
4 .3 .1 .3 N-terminal peptide of GLUT4 141
4 .3 .2 Preparation and purification of antipeptide antibodies 143
4 .3 .2 .1 A nti-G L U T I antibodies 143
4 .3 .2 .2 Anti-GLUT2 antibodies 147
4 .3 .2 .3 Anti-G LUT4 C-terminal peptide antibodies 1 50
4 .3 .2 .4 Anti-G LUT4 N-terminal peptide antibodies 1 54
4 .3 .3 Specificity of antibodies 157
4 .3 .3 .1 Specificity of antibodies-ELISA 157
4 .3 .3 .2 Specificity of antibodies-Western blotting 161
4 .3 .4 Sandwich ELISA of GLUT4 166
4 .4 Discussion 168
Chapter 5. GLUCOSE TRANSPORT AND GLUCOSE TRANSPORTER
TRANSLOCATION IN RAT ADIPOSE CELLS
5.1 Introduction 170
5 .2 Methods
5 .2.1 U-[^"^C]-D-glucose transport assay 172
5 .2 .2 3-0-m ethylglucose uptake assay 173
5 .2 .3 .1 Set up and establishment of procedures 176
5 .3 Results
5.3.1 Adipocyte glucose uptake 181
5 .3 .2 Adipocyte subcellular fractionation and glucose transporter
localisation 185
5 .4 Discussion 190
Chapter 6. TISSUE GLUCOSE TRANSPORTER LEVELS
6.1 Introduction 194
6 .2 Methods
6.2.1 Tissue membrane preparation 195
6 .3 Results
6.3.1 High-fat fed rat tissue glucose transporter levels 197
6 .3 .2 GLUT2 glucose transporter levels in liver from high-fat fed rats 197
6 .4 Discussion 2 0 4
Chapter 7. MEMBRANE LIPID PROFILE AND TISSUE GLYCOGEN AND
TRIGLYCERIDE STORES
7.1 Introduction 2 1 0
7 .2 Methods
7.2.1 Membrane fluidity measurements 2 1 2
7 .2 .2 Lipid extraction 2 1 3
7 .2 .3 Cholesterol measurements 2 1 3
7 .2 .4 Phospholipid measurements 2 1 4
7 .2 .5 Fatty acid separation and identification 2 1 4
7 .2 .6 Tissue triglyceride levels 2 1 5
7 .2 .7 Tissue glycogen levels 2 1 6
7.3 Results
7.3.1 Cholesterol/phospholipid ratio 2 1 7
7 .3 .2 Membrane lipid fluidity 2 1 7
7 .3 .3 Fatty acid composition 2 1 9
7 .3 .4 Tissue glycogen and triglyceride stores 2 1 9
7.4 Discussion
7.4.1 Membrane lipid composition 2 2 2
7 .4 .2 Tissue glycogen and triglyceride stores 2 2 5
Chapter 8. STUDIES IN HUMAN TISSUE
8.1 Introduction
229
8.2 Methods
8.2.1 Tissue collection 2 3 2
8 .2 .2 Adipocyte glucose uptake 2 3 2
8 .2 .3 Tissue glucose transporter level 2 3 3
8 .2 .4 Adipocyte GLUT4 translocation 2 3 3
8.3 Results
8.3.1 Glucose uptake assays 2 3 4
8 .3 .3 Adipocyte subcellular distribution of GLUT4 2 3 6
8 .4 Discussion 241
Chapter 9. GENERAL DISCUSSION 2 4 6
REFERENCES 2 5 5
LIST OF FIGURES
Fig 1.1 Potential insulin signalling pathways and glucose transporter
translocation 32
Fig 2.1 Neonatal streptozotocin injected rats-growth curve 82
Fig 2 .2 High-fat and control fed rats (a) Animal weight gain (b) Calorific
intake 85
Fig 2 .3 Neonatal streptozotocin injected rat oral glucose tolerance test
(a) Blood glucose levels (b) Plasma insulin levels 89
Fig 2 .4 High-fat fed rat oral glucose tolerance test (a) Blood glucose levels
(b) Plasma insulin levels 92
Fig 3.1 Quantitative Western blotting of GLUT1 (a) Autoradiography
(b) Radioactivity 107
Fig 3 .2 Quantitative Western blotting of GLUT4 (a) Autoradiography
(b) Radioactivity 108
Fig 4.1 Purification of GLUT1 antibody-Affinity column elution 145
Fig 4 .2 SDS/Polyacrylamide gel electrophoresis of affinity purification of
various anti-glucose transporter antibodies 146
Fig 4 .3 Purification of GLUT2 antibody (a) IgG separation (b) Affinity column
Fig 4 .4 Screening ELISA of antibody purification (a) GLUT1 anti-C-terminal
peptide antibody (b) GLUT2 anti C-terminal peptide antibody 150
Fig 4 .5 Purification of GLUT4 antibody (a) C-terminal protein A sepharose
column (b) C-terminal peptide affinity column 152
Fig 4 .6 Purification of GLUT4 antibody (a) N-terminal peptide IgG separation
(b) N-terminal peptide affinity column 155
Fig 4 .7 Screening ELISA of antibody purification (a) GLUT4 anti-C-terminal
antibody (b) GLUT4 anti-N-terminal antibody 156
Fig 4 .8 Cross-reactivity of antibodies: ELISA (a) GLUT1 C-terminal peptide
coated ELISA plate (b) GLUT2 C-terminal peptide coated ELISA
plate 159
Fig 4 .9 Cross-reactivity of antibodies: ELISA (a) GLUT4 C-terminal peptide
coated ELISA plate (b) GLUT4 N-terminal peptide coated ELISA
plate 160
Fig 4 .1 0 Western blot of various tissue membranes against the anti-GLUTI
Ç-terminal antibody 163
Fig 4.11 W estern blot of various tissue membranes against the anti-GLUT2
Ç-terminal antibody 164
Fig 4 .1 2 Western blot of various tissue membranes against the anti-GLUT4
Ç-terminal antibody 165
Fig 4 .1 3 GLUT4 antibody sandwich ELISA 167
Fig 5.1 W estern blot of the subcellular distribution of adipocyte GLUT4 in the
absence or presence of insulin (a) Autoradiograph (b) Densitometric
quantification 178
Fig 5 .2 Adipocyte subcellular distribution and translocation of cytochalasin B
binding sites 180
Fig 5 .3 Adipocyte glucose uptake from control and fat fed rats 182
Fig 5 .4 Adipocyte glucose uptake-concentration curve (EC50) 184
Fig 5 .5 W estern blot of the subcellular distribution of adipocyte GLUT4 from
control or high-fat fed rats 186
Fig 5 .6 Densitometric quantification of the subcellular distribution of
adipocyte GLUT4 from control or high-fat fed rats 187
Fig 6.1 Western blot of GLUT4 content in tissue membranes from control or
high-fat fed rats (a) Skeletal muscle (b) Adipose tissue 198
Fig 6 .2 Western blot of GLUT1 content in tissue membranes from control or
high-fat fed rats (a) Heart (b) Diaphragm 199
Fig 6 .3 Western blot of liver membranes from control and high-fat fed rats
against anti-GLUT2 antibody 2 0 2
Fig 6 .4 Densitometric quantification of GLUT2 content in liver membranes
from control and high-fat fed rats 2 0 3
Fig 8.1 Human adipocyte ^"^C-glucose uptake 2 3 5
Fig 8 .2 Western blot of human tissue membranes against anti-GLUT4
Fig 8 .3 W estern blot of the subcellular distribution of adipocyte GLUT4 from
control and cirrhotic subjects 2 3 9
Fig 8 .4 Densitometric quantification of the subcellular distribution of adipocyte
GLUT4 from control and cirrhotic subjects 2 4 0
LIST OF TABLES
Table 1.1 Examples of enzymes phosphorylated in response to insulin 35
Table 1.2 Mammalian glucose transporter isoforms 50
Table 2.1 Composition of high-fat and control diets 8 4
Table 2 .2 Euglycaemic-hyperinsulinaemic clamp data 9 4
Table 4.1 C-terminal peptide of GLUT2 138
Table 4 .2 C-terminal peptide of GLUT4 140
Table 4 .3 N-terminal peptide of GLUT4 142
Table 5.1 Distribution of marker enzymes in adipocyte subcellular
membranes 177
Table 6.1 Tissue glucose transporter levels 2 0 0
Table 7.1 Membrane lipid composition and fluidity 2 1 8
Table 7 .2 Membrane fatty acid composition 2 2 0
Table 7 .3 Tissue glycogen and triglyceride concentrations in ad libitum fed or
20hr fasted rats 221
LIST OF ABBREVIATIONS
AM P Adenosine monophoshate
BSA Bovine serum albumin
cAM P Adenosine 3 ':5 ' cyclic monophosphate
DMF Dimethylformamide
DMSG Dimethylsulphoxide
DTT Dithiothreitol
dpm Disintegrations per minute
EDTA Ethylenediaminetetraacetic acid
EGTA Ethyleneglycol-bis(R-aminoethyl ether) N ,N ,N ',N ',-te tra a c etic acid
ELISA Enzyme linked immunosorbent assay
IgG Immunoglobulin G
IRS-1 Insulin receptor substrate 1
GDP Guanosine diphosphate
GLUT Glucose transporter isoform
GS Glycogen synthase
GSK Glycogen synthase kinase
GTP Guanosine triphosphate
HCI Hydrochloric acid
HDM High density microsome
HEPES N-2-Hydroxyethylpiperazine-N'-2-ethanesulfonic acid
HGO Hepatic glucose output
HMG CoA 3-hydroxy-3-m ethylglutaryl coenzyme A
HgO W ater
KCN Potassium cyanide
KLH Keyhole limpet haemacyanin
LDM Low density microsome
MAPK Mitogen activated protein kinase
MEK MAPK kinase
MES 2-(N-Morpholino)ethanesulphonic acid
MgClg Magnesium chloride
MnClg Mangenese chloride
NaCI Sodium chloride
NADP Nicotinamide adenine dinucleotide phosphate
NaOH Sodium hydroxide
NEFA Non esterified fatty acid
NSF N-ethylmaleiimide sensitive factor
NSIgG Non-specific immunoglobulin G
PAGE Polyacrylamide gel electrophoresis
PBS Phosphate buffered saline
PEPCK Phosphoenolpyruvate carboxykinase
PI3K Phosphotidylinositol 3-kinase
PKB Protein kinase B
PKC Protein kinase C
PLAz
Phospholipase AgPM Plasma membrane
PMSF Phenylmethylsulfonyl fluoride
^2^5
Phosphorous pentoxidePP1 Protein phosphatase 1
SDS Sodium dodecyl sulphate
SEM Standard error of the mean
SNAP Soluble NSF accessory protein
SNARE Soluble NSF accessory protein receptor
STZ Streptozotocin
TEMED Tetramethylethylenediamine
TEA Trifluoroacetic acid
TNF a Tumour necrosis factor a
Tris Tris(hydroxymethyl)aminomethane
TTBS Tris buffered saline with Tw een-20
Tween 2 0 Polyoxyethylenesorbitan monolaurate
PUBLICATIONS
Some of the material presented in this thesis is contained in the following
publications:
Fryer, L.G., Wollen, N. & Kruszynska, Y .T. (1992) Insulin resistance and
glucose transporter function in the high fat fed rat. Diabetic Med. 9 P29
Fryer, L.G., Wollen, N. & Kruszynska, Y .T . (1992) Glucose transporter function
and membrane lipids in the insulin resistant high fat fed rat. Diabetologia 35
A 3 0
Fryer, L.G., Baldwin, S.A. & Kruszynska, Y .T . (1993) Depletion of adipocyte
glucose transporters (GLUT4) but normal skeletal muscle GLUT4 expression in
the insulin resistant high fat fed rat. Diab.Nutr.M etab. 6 2 4 1 -2 5 0
Fryer, L.G. & Kruszynska, Y .T. (1 9 93 ) Insulin resistance in high fat fed rats:
role of glucose transporters, membrane lipids and triglyceride stores.
A nn.N Y.A cad.S ci.U SA 9 1 -9 7
Kruszynska, Y .T . & Fryer, L.G. (1 9 9 3 ) Expression of the insulin regulated
glucose transporter (GLUT4) in skeletal muscle of cirrhotics. J.Hepatol. 18 8 1 2
CHAPTER 1
INTRODUCTION
1.1 Insulin
Insulin is a key hormone in the regulation of fuel homeostasis in mammals. In
response to a meal it controls blood glucose levels, promotes the storage of
energy as glycogen and triglycerides, and increases protein synthesis.
Insulin is produced and secreted from the R-cells in the Islets of Langerhans
of the pancreas. The Islets of Langerhans were identified in the 1860s. In 1 8 89
von Mering & Minkowski demonstrated that pancreatectomy caused diabetes
mellitus, but it was not until 1909 that de Meyer and in 1 9 1 7 Sharpey-Schafer
suggested a link between the islets and diabetes. This link was finally proven
by the work of Banting & Best with their co-workers in 1921 who used
acid-ethanol to extract from dog pancreas an islet cell factor with a potent
hypoglycaemic activity. Within a year, insulin from porcine and bovine islets
was in use for the treatm ent of diabetes mellitus.
Insulin is a polypeptide consisting of 2 chains, A and B, linked by 2 interchain
disulphide bridges. There is also an intrachain disulphide bridge on the A chain
and the position of all three disulphide bridges is invariant. Insulin is synthesised
as a preprohormone (M W t. 1 1 50 0 ); a hydrophobic 23 amino acid leader
sequence directs the molecule into the cisternae of the endoplasmic reticulum,
where the leader sequence is removed, producing proinsulin (M W t. 9 0 0 0 ).
Proinsulin is transported to the Golgi apparatus, where proteolysis and
packaging into secretory granules begins. It undergoes a series of enzymatic
cleavages to produce equimolar amounts of insulin, consisting of the A and B
chain, and the excised connecting C peptide. Approximately 9 5 % of the
proinsulin is converted to insulin in normal conditions. Secretory granules are
budded off from the Golgi and continue to mature as they traverse the
cytoplasm. Both proinsulin and insulin combine with zinc to form hexamers in
the granules. Upon stimulation of the R-cell with a suitable agonist, the granules
fuse with the plasma membrane and discharge their contents into the
extracellular fluid by exocytosis. Insulin secretion is an energy dependent
process involving the microtubule-microfilament system of the R-cell. SNARE
protein interactions appear to be involved in the fusion of insulin granules with
the R-cell plasma membrane (Wheeler e ta L , 1 9 96 ). Proinsulin has less than 5%
of the bioactivity of insulin, although due to its longer half-life in plasma and its
cross-reactivity with 'insulin' antisera, it may sometimes cause overestimation
of the insulin concentration in serum. C peptide appears to have no biological
activity.
Plasma glucose levels are the most important physiological regulator of insulin
release, with a threshold level for secretion around 80-1 OOmg/dl (fasting plasma
clear how glucose regulates insulin release. A glucose receptor protein on the
R-cell membrane has been postulated. However, a more likely signal is through
the generation of intracellular metabolites and the flux of these metabolites.
Several other metabolic substrates, including glyceraldehyde, leucine and
ketoisocaproate, and drugs such as the sulphonylureas (eg. tolbutamide) and
quinine can also initiate insulin release. Sulphonylureas are often used in the
treatm ent of type II diabetes mellitus, stimulating insulin release by a
mechanism different from glucose.
A number of hormones and neurotransmitters also potentiate or inhibit insulin
release. Several polypeptide hormones released by the gastrointestinal tract
(such as cholecystokinin, vasoactive intestinal peptide and gastric inhibitory
peptide) are important in potentiating release. Hence, glucose taken orally has
a more potent effect on secretion than intravenously injected glucose. Arginine,
glucagon, R-adrenergic agonists, vasopressin, bombesin and acetylcholine
(released from parasympathetic nerves terminating within the islets) also
potentiate release. High levels of growth hormone, cortisol, placental lactogen,
oestrogens and progestins stimulate insulin secretion. Inhibitors of insulin
secretion include somatostatin, a-adrenergic agonists (eg. adrenaline), galanin,
substance P, opioids, CGRP and pancreastatin.
There are a number of coupling factors and signalling pathways involved in the
stimulation and potentiation of insulin release by the different signals, including
depolarisation of the R-cell membrane, phosphotidyl inositol turnover releasing
diacylglycerol and PIP3, intracellular Ca^* mobilisation, cAM P production, and
protein phosphorylation by stimulation of protein kinases (see Ashcroft &
Ashcroft, 1 9 9 2 ).
In plasma, insulin has no carrier protein and under normal conditions has a half
life of 3-5 minutes, with the liver, kidney and placenta being the major tissues
responsible for insulin metabolism, as well as insulin responsive peripheral
tissues, through receptor-ligand internalisation and processing. Approximately
5 0 % of insulin is removed in a single pass through the liver, and since it is
secreted into the portal circulation, the liver removes much of it before it
reaches the systemic circulation, and the liver is exposed to a far higher
concentration than peripheral tissues.
1.1.1 Actions of insulin
The binding of insulin to its receptor on target cells starts a number of
intracellular events, leading to the translocation of several proteins, eg. glucose
transporters, insulin receptors, IGF II receptor, and several changes in transport
systems, metabolism, and cell growth and replication. The main target tissues
for insulin are skeletal muscle, adipose tissue and liver, in which it has a
primarily anabolic effect, signalling the fed state; promoting the synthesis of
carbohydrate, fat and protein, and reducing the rate of fuel degradation. The net
action of insulin is to prevent an excessive rise in blood glucose levels and to
return them to basal, following a meal; an action in which it acts alone against
a number of other hormones. The effects of insulin can occur within seconds
several hours (protein and DNA synthesis, and cell grow th). Insulin affects the
activity or amount of at least 50 proteins in several tissues.
One of the initial, and rate limiting, steps in glucose metabolism in muscle and
adipose tissue is the rate of glucose transport across the plasma membrane
(Yki-Jarvinen e ta L , 1987; Fink e ta /., 1992; Ren e ta !., 1 9 9 3 ). In both of these
tissues, insulin increases glucose uptake by recruitment of glucose transporters
to the plasma membrane from intracellular stores, increasing the Vmax for
transport. Some reports have also suggested that insulin induces an increase in
transporter intrinsic activity (Section 1 .3 .4 ). In liver, insulin does not directly
affect glucose transport, but does influence uptake by its effects on
glucokinase, and the flux of glucose to glucose-6-phosphate, thus keeping the
intracellular concentration of free glucose low, and favouring entry of glucose
into hepatocytes by diffusion down a concentration gradient.
The control and integration of cell metabolism, and utilisation or storage of
different fuel types and the effects of insulin on these actions is a complex and
varied process. As mentioned, insulin generally has an anabolic effect, serving
to remove glucose from the blood for oxidation or storage, while inhibiting
production of glucose from other sources.
The direct effects of insulin on carbohydrate metabolism are to; (a) increase
glycolysis in muscle and adipose tissue, (b) increase glycogen synthesis in
muscle, adipose tissue and liver, (c) increase glucose oxidation by the pentose
phosphate pathw ay, (d) decrease glycogenolysis in muscle and liver, and
gluconeogenesis in liver. Insulin also influences glucose utilisation in tissues
indirectly by its effects on the mobilisation of fuels from other stores,
particularly adipose tissue.
Insulin has several effects on lipid and protein metabolism in different tissues.
Insulin (a) increases triacylglycerol uptake and inhibits lipolysis in adipose tissue,
(b) increases fatty acid and triacylglycerol synthesis in adipose tissue and liver,
(c) increases the rate of VLDL formation, and may decrease the rate of fatty
acid oxidation, in liver.
On protein metabolism; insulin (a) increases the transport of some amino acids
and the rate of protein synthesis in muscle, adipose tissue, liver and other
tissues, (b) decreases protein degradation in muscle (and possibly other tissues),
(c) decreases the rate of urea formation. Thus, it produces a positive nitrogen
balance, and thereby can be considered an anabolic hormone.
Insulin also stimulates the proliferation of cell cultures, and supports and
regulates the growth and replication of many cell types. It is a critical ingredient
in all 'defined' tissue culture media. It is possible that some of these effects
may be mediated through insulins actions on insulin like growth factor (IGF)
receptors. The effects of insulin on the uptake of glucose, type A neutral amino
acids, phosphate and cations, and on the phosphorylation or dephosphorylation
1.1.1.1 The insulin receptor
The insulin receptor is a disulphide-linked R-o-o-R heterotetram er (Fig 1.1). The
tw o extracellular a-subunits bind insulin via cysteine rich domains, while the
R-subunits are transmembrane proteins involved in signal transduction, with the
intracellular portion containing a tyrosine-specific protein kinase that is activated
by insulin. Both subunits are glycosylated. The insulin receptor is found in many
mammalian tissues, including some that are not insulin target tissues, the
receptor number varies from around 10® on hepatocytes and adipocytes, to 10^
on fibroblasts. It is highly conserved and belongs to a family of similar tyrosine
kinase receptors (Yarden & Ullrich, 19 88 ). Under basal conditions, the insulin
receptor is predominantly in the plasma membrane and has a half-life of around
7 -1 2 hours. Binding of insulin induces rapid endocytosis of the receptor/ligand
complex, down regulating the surface receptors and serving as an important
mechanism in insulin degradation (Sonne, 1 9 88 ). Receptor internalisation may
also play a role in insulin signalling (Frost & Risch, 1991 ), since the internalised
receptor remains catalytically active while insulin is bound. A fter prolonged
insulin stimulation, the receptor also gets degraded causing down regulation,
and thus, attenuation of the signal (Backer et a!., 1 9 9 0 ).
The initial stage of signal generation following the binding of insulin involves
the transduction of the signal across the cell membrane by the receptor (for
review, see Olefsky, 1 9 9 0 ). Binding of a molecule of insulin to one of the tw o
insulin binding sites on the receptor causes a number of conformational changes
in the receptor, which induce a decrease in affinity for insulin at the second
binding site (negative co-operativity). The signal is propagated across the
membrane by conformational changes in the R subunits. The intracellular portion
of the Q> subunit contains a tyrosine kinase activity, which plays an essential
role in insulin signalling (Czech e t al., 1985; Rosen, 1 9 8 7 ). Binding of insulin
causes activation of this kinase activity, initiating autophosphorylation of the
receptor, at potentially one or more of 5 sites arranged in 2 clusters. The
autophosphorylation of 3 residues in the tyrosine kinase domain appears to
result in the activation of this enzyme towards exogenous substrates, although
the importance of the overall level and individual sites of autophosphorylation
remain to be elucidated. This autophosphorylation plays a key role in regulating
the tyrosine kinase activity, and is essential for maximum activation.
The unoccupied a subunit exerts an inhibitory constraint on R-chain
autophosphorylation which is relieved by the binding of insulin. The (oRjg
heterotetramer assembly is required for autophosphorylation and it appears that
there is transphosphorylation between the tw o subunits. There are also
suggestions that intermolecular phosphorylation may occur.
The insulin receptor is also phosphorylated on serine and threonine residues
in the basal state and in response to phorbol esters, cAM P and insulin. This can
cause an inhibition of insulin stimulated tyrosine autophosphorylation and,
consequently, of tyrosine kinase activity tow ards other substrates. This
mechanism may therefore exert a feedback control on the receptor tyrosine
kinase, particularly through the insulin-stimulated receptor serine kinase (Czech
specific phosphatases, when insulin is no longer bound, may also provide an
important mechanism for controlling the activation of receptors.
1,1.1.2 The insulin signal
Binding of insulin to around 10^ insulin receptors on a target cell will elicit a
full response in the cell, involving the activity of millions of proteins. The
systems involved in insulin signalling must therefore involve amplification of the
initial signal. The mechanism of signal transduction from the insulin receptor to
the target system appears to involve several processes; (a) a cascade of protein
kinases and phosphatases, (b) generation of small M W t. intracellular mediators,
(c) a decrease in cellular cAM P levels. These mechanisms appear to act in
combination, with much interplay between them.
The insulin receptor tyrosine kinase, essential for the action of insulin,
phosphorylates several proteins in vitro) however, the physiological significance
of many of these substrates is unclear. Insulin receptor substrate-1 (IRS-1),
originally termed p p 185, is the principle cytosolic protein to be phosphorylated
by the insulin receptor tyrosine kinase (Sun eta!., 1 9 9 1 ), and much interest has
focused on its role in signal transduction (see W hite & Kahn, 1 9 9 4 ). Potentially
there are 21 tyrosine phosphorylation sites on IRS-1, at least 8 of which are
phosphorylated by the insulin receptor tyrosine kinase. IRS-1 serves as a
docking site for several intracellular molecules that contain specific src
homology 2 recognition domains (SH2). These bind through the IRS-1
phosphotyrosine sites, with the amino acid sequence motif surrounding the
phosphotyrosine determining binding specificity (Eck et a!., 1 9 9 3 ). A t least 20
SH2 domain containing proteins have been identified to date (Kahn, 1 994).
Phosphatidylinositol-3-kinase (PI3K), JAK (a tyrosine kinase), c-fyn (a tyrosine
kinase), and SHPTPg (syp, a tyrosine phosphatase), are examples of some of the
intracellular enzymes that are activated by their binding to IRS-1 (Fig 1.1;
Backer at a!., 1992; Lamphere e t al., 1 9 9 4 ), through association of SH2
domains with phosphotyrosines on IRS-1. PI3K is activated through association
of its p85 subunit and IRS-1, with occupation of tw o SH2 domains by
phosphotyrosines on IRS-1 in a Y X X M motif. Protein kinase B (PKB) is, in turn,
activated through PI3K. It is not yet clear whether the phosphatidylinositol
3,4,5-triphosphate (PIP3) generated by PI3K activity acts as a signal to PKB,
possibly via a PKB kinase, or if PI3K has a direct effect on the phosphorylation
of PKB or PKB kinase (Bos, 1 9 95 ). PKB causes a decrease in glycogen synthase
kinase activity through phosphorylation, and thus increases the amount of
active glycogen synthase. PI3K activation has also been demonstrated to be
required for the antilipolytic effects of insulin (Okada et a!., 1 9 9 4 ), membrane
ruffling, activation of the MAP kinase cascade, activation of p70S 6 kinase,
activation of the GTP-binding protein Rac (see Nave et a!., 1996) and the
stimulation of glucose transport and transporter translocation (Clarke et a!.,
1994; Yang e ta !., 1 996). Furthermore, PI3K has been localised to intracellular
microsomes, although those containing PI3K appear distinct from the GLUT4
containing microsomes (Kelly & Ruderman, 1 9 9 3 ). However, it is possible that
w
m su lin
In su lin rec e p to r
P la s m a
IR S -2 m e m b ra n e
^ - ► N c k
RS-1
p 8 5 p 1 iO
c - t y n P I 3 K
PKB k inase
LD M
R a s G T P H e te ro trlm e r I G -p ro te in s ^ j , Raf-1
L ip o ly s is
M EK K
P K B > F R A P
i
p 7 0 S 6 k in a s e
M EK
M APK
p 9 0 R s k
i
^ G S K 3
. PP1
P rotein s y n th e s is
M A P PLA2 P r o te in s y n th e s is T ra n s c rip tio n
facto rs
+
Fig 1.1 Potential insulin signalling pathways and glucose transporter translocation. (1) Insulin binding (2) Generation of a
variety of intracellular signals (3) Glucose transporter translocation to the plasma membrane (4) Fusion of LDM w ith the
to vesicle translocation (Yang et a!., 1 9 96 ). The direct interactions of PI3K or
PIP3 with effector systems remains to be elucidated.
In addition to direct activation of enzyme activities, IRS-1 also binds to
'adaptor molecules', such as GRB2 and Nek, through SH2 domains (Fig 1.1).
GRB-2 links to a guanine nucleotide exchange factor for ras, termed 8 0 S , which
promotes exchange of GTP for GDP, and thereby activates ras. Thus, the
binding of G R B -2/S 0S to IRS-1 mediates the stimulation of ras. Activated ras
binds to Raf, a serine/threonine kinase which in turn activates MAP kinase
(MAPK) through phosphorylation via a MAP kinase kinase (MEK). In turn MAPK
phosphorylates several factors including mitogen activated protein, PLAg,
transcription factors and p90 Rsk, several of which control protein synthesis,
glycogen synthase activity and cell growth (Fig 1.1). Thus, IRS-1 is an
important intracellular mediator of insulin action (Chuang at a!., 1 9 93 ), and is
essential for some actions, such as insulin stimulated mitogenesis (Wang eta!.,
1 9 93 ). However, IRS-1 deleted mice are still partially responsive to insulin,
suggesting that other mechanisms of insulin action exist (Tamemoto at a!.,
1994; Araki at aL, 1 9 9 4 ). Indeed, an IRS-2 molecule has also been identified
and suggested as a signalling protein in insulin action (Sun at a!., 1995).
Another intracellular protein directly phosphorylated by the insulin receptor
tyrosine kinase is the 'adaptor molecule' She. In turn She associates through its
phosphotyrosine sites with the SH2 domains on GRB2, and thus in turn to SOS,
and leads to the activation of the ras cascade (Fig 1.1). Indeed, this appears to
Many of the effects of insulin involve the phosphorylation or
dephosphorylation of serine/threonine residues on target proteins (Table 1.1;
Lawrence, 1 9 9 2 ), probably through a cascade of kinase or phosphatase
activities. Indeed, many protein kinases and phosphatases are activated or
inactivated by insulin through phosphorylation or dephosphorylation (eg. see
Denton, 1 9 9 0 ). In 1 9 9 0 , Dent et a!. demonstrated the reciprocal activation of
glycogen synthase and inhibition of phosphorylase kinase, both through
dephosphorylation by protein phosphatase 1 (PP1). This first indicated
mechanisms by which insulin action causes opposing events through a
kinase/phosphatase cascade, one effector enzyme acting on more than one
target and feeding into more than one pathw ay, allowing branching of the
signal, causing stimulation of glycogen synthesis and inhibition of
glycogenolysis.
It has also been proposed that insulin may act through the generation of low
M W t. messengers (insulin mediators) that could allosterically regulate protein
kinases and other proteins. Indeed, the possible generation of PIP3 by PI3K, as
described above, is one such example. Other mediators have also been
proposed, although the characterisation of these mediators has been difficult.
Initially, it was thought that peptides or peptide conjugates were involved
(Lamer, 1 9 8 8 ). More recently, phosphoinositol glycans and diacylglycerol
(which causes activation of protein kinase C) have been implicated; they are
released from membrane associated glycolipids by the action of phospholipase
C (Saltiel, 1 9 90 ).
Table 1.1 Examples of enzymes phosphorylated
in response to insulin
CO (J1
Enzym e C hange in phosphorylation C h an g e in activity Pyruvate d eh yd ro genase D e crease In c re a s e
P yruvate kinase D e crease In c re a s e 6 -P h o s p h o fru c to -2 -k in a s e D ecrease In c re a s e F ru cto se-2 ,6-b is p h o s p h a tase D ecrease D e c re a s e
G lycogen synthase D ecrease In c re a s e Phosphorylase kinase D ecrease D e c re a s e
Phosphorylase D ecrease D e c re a s e A cetyl-C o A carboxylase In crease In c re a s e
H M G -C o A red u ctase D ecrease In c re a s e T riacylglycerol lipase D ecrease D e c re a s e PP1G In c re ase In c re a s e cAMP phosphorylase In c re ase In c re a s e Insulin receptor In crease D e c re a s e ATP citrate lyase In crease No ch a n g e P h en ylalan ine hydroxylase D e crease
A number of the actions of insulin in liver and adipose tissue appear to be
mediated through decreases in cellular cAM P levels, when the cAM P level has
previously been raised by the actions of other hormones. The decrease seems
to be caused by both an activation of cAM P phosphodiesterase and the
inhibition of adenyl cyclase. GTP binding proteins (G-proteins), distinct from the
well characterised Gg and Gj, may be involved in these actions of insulin on
adenyl cyclase and cAM P phosphodiesterase. It is also possible that G-proteins
are involved with other effector systems, eg. phospholipase C and the
translocation of glucose transporters. It is of particular interest that a number
of G-proteins are phosphorylated on tyrosine by the insulin receptor (Zick e ta L ,
1 9 8 6 ). Indeed, small molecular weight G-proteins have been co-localised with
GLUT4 on intracellular membranes (Etgen at sL, 1993) and, as discussed in
Section 1 .3 .4 ., it is possible that G-proteins are involved in GLUT4
translocation. Cyclic GMP concentrations are also raised in response to insulin,
although the significance of this is unknown.
1.1.1.3 Effects of insulin
In addition to the short term effects caused by covalent modifications, eg.
phosphorylation, insulin also has longer term effects on gene transcription and
translation, and on cell replication, some of which are mediated through
phosphorylation of nuclear proteins and transcription factors, eg. through
MAPK. Examples of enzymes controlled by insulin by changes in
phosphorylation/dephosphorylation are summarised in Table 1.1. In addition to
increasing the overall rate of protein synthesis in many tissues, insulin has
specific effects on certain proteins, and can regulate the mRNA for a number
of enzymes (Table 1.2 ). Some of these effects of insulin have been
demonstrated to be due to increased gene transcription, how ever, regulation of
mRNA stability or efflux of mRNA from the cell nucleus may also play a part.
The effects of insulin on gene transcription appear, at least in part, to be
regulated through the binding of insulin mediated elements to insulin responsive
sequences, upstream from the initiation site, eg. for PEPCK, c-fos, and
glyceraldehyde 3-phosphate dehydrogenase.
Insulin also appears to stimulate peptide-chain initiation, increasing ribosomal
binding to mRNA. A number of components of the translational machinery
undergo reversible phosphorylation in response to insulin, indicating possible
mechanisms for control of translation. In particular, the ribosomal protein S6
(see above) and the initiation factor 2 (IF2) appear to be involved in this
regulation. Insulin phosphorylates the S6 protein (a component of the 40S
subunit of the ribosome) via the S6 protein kinases; however, a direct
relationship between this and increased protein synthesis has proved difficult
to confirm.
Insulin may also dephosphorylate IF2. Phosphorylation of IF2 leads to an
inhibition of its recycling, which is essential for its continued participation in
peptide-chain initiation, hence, insulin will cause increased recycling and
increased protein synthesis. PHAS-1 and eukaryotic translation initiation factor
synthesis. This phosphorylation has been demonstrated to be through a
pathw ay of IRS-1 stimulation of PI3K and p 70S 6 kinase (Mendez e ta L , 1 996).
1 .2 Diabetes mellitus and insulin resistance
Diabetes mellitus is a clinical syndrome characterised by an increase in fasting
blood glucose levels. In Western countries it affects up to 5% of the population.
It can occur from many secondary causes such as pancreatectomy, iron
overload of the R-cells in haemochromatosis, excess cortisol production
(Cushing's syndrome), excess growth hormone (acromegaly), liver disease and
insulin receptor defects (eg. leprechaunism). However, most patients do not
have any of these defects, and are said to have 'idiopathic' diabetes, that may
arise from abnormalities at one or several sites. Diabetes mellitus has been
classified into tw o distinct forms; type I (insulin-dependent or juvenile onset)
and type II (non-insulin-dependent or maturity onset) diabetes. However, there
is overlap between the tw o types and simple classification covering all patients
is very difficult. Both forms have a genetic component, although the genes
involved remain elusive. Type I and type II diabetes mellitus are both associated
with long term secondary complications, including micro- and macrovascular
disease, nephropathy, neuropathy and retinopathy, which reduce the quality of
life and the life expectancy of those affected.
1.2.1 Type I diabetes
Type I diabetes mellitus is an autoimmune disease, an aberrant immune
reaction against the R-cells of the pancreas causing their destruction. Thus
insulin is not released in response to increased blood glucose levels, and
glucose homeostasis is impaired.
There is a clear genetic component to the disease, but with a concordance
rate of only 3 0 -5 0 % in identical tw ins, environmental factors must also play a
part.
1.2.2 Type II diabetes mellitus
Type II diabetes mellitus is by far the more frequent form of the disease in all
populations, accounting for 8 0 -9 0 % of cases of diabetes in developed
countries, and almost 1 0 0 % in many developing populations (Dowse & Zimmet,
1 9 89 ). In the US it affects 6 -7 % of 2 0 -7 4 year olds (Harris et a!., 1 9 8 7 ), but
can affect up to 5 0 % of the elderly population in some groups, with a higher
incidence in some ethnic races, eg. Pima Indians. The incidence of type II
diabetes increases between 3 0 and 6 0 years, but then tends to plateau. The
prevalence of the disease is increasing worldwide. It is a heterogenous disorder
with many aetiologies; therefore it is difficult to define the disease precisely,
and to categorise patients appropriately. The disorder appears to result from
both a defect in the actions of insulin and from a R-cell defect; however, the
site of the primary defect and the role of these mechanisms in the initiation and
Type II diabetes has a major genetic component, with a stronger inheritance
than type I, and a concordance rate in identical twins of 5 6 -1 0 0 % . However,
environmental factors may also be involved. It has often been described 'a
geneticist's nightmare' (eg. Neel, 1965; Turner et a!., 1 9 9 5 ), and it remains
unclear w hether the inheritance is monogenic, or, as seems more probable,
polygenic.
In only a small proportion of cases have specific gene mutations or linkages
to candidate genes been identified (see Turner et sL, 1995; Polonsky, 1 995).
In M aturity Onset Diabetes of the Young (M ODY), a distinct form of diabetes,
mutations in the glucokinase gene has been identified in approximately 5 0 % of
affected families. It is thought that these mutations affect insulin secretion
because the enzyme acts in the glucose sensing mechanism of the R-cell.
Unrelated to this defect in the glucokinase gene, the M O D Y form of diabetes
can result from a mutation in chromosome 20, in the M 0 D Y 1 gene; shown
through linkage to the adenosine deaminase gene. The mechanism by which it
causes diabetes is unknown. Insulin receptor mutations in patients with insulin
resistance, insulin gene mutations in patients with high proinsulin levels, and
mitochondrial DNA mutations associated with deafness, maternal inheritance
and diabetes, have all been reported (see Turner et a!., 1 9 9 5 ). However, the
genetic defect(s) in the vast majority of cases of type II diabetes remain to be
identified.
In 1 9 85 , the World Health Organisation Committee suggested the involvement
of a single gene defect. However, the complexity of the pathophysiology, the
involvement of several factors, and the results of recent studies would suggest
that it is actually a polygenic inheritance (see Polonsky, 1 9 9 5 ). The possibility
that separate genetic determinants of insulin sensitivity, 13-cell function and
appetite contribute to type II diabetes has been postulated (Turner eta!., 19 95 ).
Kahn (1 9 9 4 ) has indicated that insulin sensitivity is inherited, and that the
resulting insulin resistance precedes and predicts the development of type II
diabetes. Primary genetic defects that may initiate the disease have been termed
'diabetogenes' (DeM eyts, 19 93 ).
In addition, environmental factors appear to be important in the expression of
the disease. Obesity, in particular abdominal obesity, is a major influence in the
expression of type II diabetes; approximately 7 0 -8 0 % of affected individuals in
Western countries are overweight. Obesity is closely associated with insulin
resistance, which is a major determinant for diabetes in these patients.
However, diabetes does not normally develop in these subjects until a 13-cell
dysfunction also occurs. Diabetes incidence is highest in those countries with
the greatest prevalence of obesity, and is related to the duration of obesity in
the individual. Pregnancy is characterised by increased insulin resistance due to
secretion of placental lactogen; diabetes is more common in women who have
had several pregnancies, suggesting that the disorder can be triggered by
placental lactogen. Other environmental factors that can influence the
development of diabetes include the amount of physical activity (with a
sedentary lifestyle frequent in affected subjects), the use of drugs such as
Alcohol also appears to increase the risk of diabetes, how ever, this could be
through its effects on other factors such as increased cortisol production,
increased obesity, or through hepatic or R-cell damage. Diet seems to play a role
in the development of type II diabetes, with the prevalence of the disease
increasing in many populations as their diet becomes more 'W esternised' and
the content of saturated fat is increased. Again, association with obesity may
play a role. Often onset of type II diabetes is exacerbated by an infection.
The development of hyperglycaemia and type II diabetes mellitus appears to
need both an impaired cellular insulin response and an impaired R-cell function.
However, since a defect in one of these criteria will lead to the impairment of
the other (DeFronzo, 1 9 8 8 ), the relative roles of either as the primary lesion
remains uncertain, with evidence suggesting that both may play a part. While
insulin resistance in skeletal muscle is a very early event in the development of
diabetes (see Haring & M ehnert, 1993; Kahn, 1 9 9 4 ), others have shown that
defects in insulin secretion can also be demonstrated very early (Porte Jr.,
1991; Polonsky, 1 9 9 5 ). However, Kahn (1 9 9 4 ) has suggested that insulin
resistance precedes and predicts the development of type II diabetes and that
the insulin secretory response is not predictive, and not decreased in
prediabetes. It seems possible that either defect may occur primarily, and may
be active in different sub-populations of patients (DeFronzo, 1 9 88 ; Turner eta!.,
1 9 9 5 ). Tw o possible mechanisms for the development of diabetes are
postulated depending on the primary defect.
Insulin resistance at the level of hepatic glucose output or uptake cannot
account for the insulin resistance found in early diabetes (DeFronzo, 1988).
Thus, peripheral uptake is the primary site of insulin resistance.
The cellular defect leading to this resistance is not clear, although several
candidates exist (Haring & Mehnert, 1 9 93 ). The defect affects both membrane
associated events, eg. glucose transport, and intracellular steps, eg. glycogen
synthase. Possible defects include faults in the insulin receptor, including
decreases in the receptor tyrosine kinase activity, which have been found in
type II diabetic patients (Kahn, 1 9 94 ), although it is not clear if this is a primary
or secondary event. However, mutations in the insulin receptor gene are present
in only 1 -1 0% of type II diabetics (Taylor, 1 9 92 ). Other post-receptor activities
have been demonstrated to be changed in insulin resistant states, and are thus
possible sites for the defect in insulin resistance; they include increased PLC and
tyrosine phosphatase activities, and decreased glycogen phosphatase and
type-1 phosphorylase phosphatase activities. The ability of insulin to stimulate
pyruvate dehydrogenase activity in type II diabetic patients has also been
reported to be impaired.
Glycogen synthesis is reduced in diabetic muscle; this is thought to have a
dominant role in the insulin resistance of type II diabetes (Shulman eta!., 1990).
While glycogen synthase activity has been shown to be reduced in some studies
(Bogardus et a/., 1 9 8 4 ), NMR studies have shown a decrease in glucose
transport/phosphorylation, not only in the diabetic state, but also in prediabetes,
indicating possible early/initiating events in insulin resistance (Rothman e t a /.,
in adipose tissue and (in some studies) skeletal muscle, has been found in some
insulin resistant states; thus a defect in glucose transport may be an important
factor in the decrease in non-oxidative glucose disposal.
Further results have suggested that it may be the signal transduction pathway
to glycogen synthase that is impaired. The G-protein rad, a member of the ras
family is expressed at vastly increased levels in type II diabetic patient muscle
(Reynet & Kahn, 1 9 9 3 ). Thus, the genes encoding rad and other IRS-1 coupled
proteins may be involved in the predisposition to, and development of, type II
diabetes mellitus. Decreases in insulin receptor phosphorylation, IRS-1
phosphorylation and PI3K activity have all been reported in models of diabetes,
and are potential sites for the development of insulin resistance (see Kahn,
1 9 9 4 ).
Following a defect in insulin responsiveness, there is a compensatory increase
in insulin secretion, hence normoglycaemia is initially maintained. Hepatic
glucose output remains in the normal range due to the hyperinsulinaemia,
however, as the insulin resistance increases, eventually fasting glucose will
increase. In turn, the hyperinsulinaemia produced will cause downregulation of
insulin receptors and intracellular activities, thereby increasing insulin resistance.
Eventually, R-cell function will become impaired, through overstimulation and
exhaustion, and possibly through 'glucose toxicity', causing desensitisation of
the R-cell. Furthermore, the hyperglycaemia will affect insulin target cells,
through 'glucose toxicity', thus exacerbating the insulin resistance. 'Glucose
toxicity' is the concept that glucose p e rs e may act as a cellular toxin, and that