DOI: 10.5958/2321-5771.2017.00018.7
©2017 New Delhi Publishers. All rights reserved
Probability of Success of a Batsman for Scoring at Least
Fifty Runs in any One-Day International Cricket Match
Ratan Ch Chakraborty
Directorate of Commercial Taxes, Kolkata, West Bengal, India
Corresponding author: rcratan@gmail.com
ABSTRACT
This paper develops a method for assessing the probability of consistent batting performance of the batsmen in the ODI cricket by using the Competency Levels of the batsmen. The Competency Levels of seven contemporary batsmen of Team India are computed on the basis of the ratings of 52 cricket fans on the skill and attitude components of the batsmen. Thereby the Probability of Success of each batsman for scoring at least fifty runs in any ODI match is computed against the numerical value of his Competency Level. The Rate of Success of the batsmen for scoring at least fifty runs per ‘effective opportunity’ in ODI cricket matches is calculated from statistical data of past performances of the batsmen. There is a strong positive linear relationship between the Probability of Success and the Rate of Success having Correlation Coefficient r=0.8709. This paper has a capacity to encourage the selectors of cricket teams for using the concept of the Probability of Success instead of the statistical records of performances in selecting batsmen for their teams.
Keywords: batsman, batting consistency, cricket, competency level, probability of success
The game of cricket was begun to be played in rural southern England in the sixteenth century. It travelled with the British Empire, being played by the soldiers and the officers in reaches of the empire ranged from Australia to Caribbean. Now it has become a mass sport with a global following (Mustafa, 2013). In the pre One-Day International (ODI) era, the batting average i.e. the average runs scored before getting out was the primary indicator of the batting performance of any batsman. The ODI matches have been introduced in the international cricket to reduce the number of draw matches and to increase excitement in cricket through more aggressive batting (Swartz et al., 2006). With the advent of growing importance of the ODI or limited over cricket, the strike rate, runs scored per ball faced has also become the key indicator along with the average score of batting for statistical analysis of batting performance of any batsman
(Barr and Kantor, 2004). The researchers have also tried to find out the consistency of batting performance(Barr and van den Honert, 1998) but all the approaches are based on statistical records of past performances. In spite of the existence of strike rate and batting average concept, selectors of the ODI cricket teams are often confused over two issues e.g. (i) Criteria for selecting a new batsman, (ii) Number of opportunities to be given
to an under performing batsman before dropping him
used as a criteria for retaining him in the ODI squad. However, any batsman can perform or fail to perform in few innings because cricket is a game of glorious
uncertainties(Boora, 2006). That is why the selectors with these existing selection tools sometimes select less
competent batsmen ignoring more competent batsmen
out of the squad. It often creates controversy among the cricket fans regarding integrity of the selectors. An effort
has been made here in this paper to develop another
tool for the ODI selectors with which they can assess Competency Levels and the Probability of Success of all prospective batsmen before final selection of the batsmen for their ODI teams.
METHODOLOGY
Theoretical Background
Performances of any Batsman in ODI matches depend on the individual attributes as well as the other factors
of the rest of the Universe including uncertainties of
bowling and fielding performances of the oppositions, pitch and weather conditions, run rate pressures, bio-psychological factors of the batsmen, etc. Thus like other activities, success or failure of a batsman for scoring at least fifty runs in any ODI match is also probable. The Probability of Success of a batsman for scoring at least fifty runs in any ODI match is,
(
1 1)
s P e τ µ − Ψ = + …(1)
Here Ps is the Probability of Success; Ψis theCompetency
Level; µ and τ are constants(Chakraborty, 2012). A batsman’s Competency Level of batting is a product of Knowledge Level (ΦK), Skill Level (ΦS) and Attitude Level (ΦA) of batting of the batsman (Chakraborty, 2013). Mathematically,
K S A
Ψ = Φ Φ Φ …(2)
Here Knowledge Level (ΦK) is the ratio of the score obtained (K) by a batsman in a scale for assessing relevant knowledge to maximum possible score obtainable (Ko) in the same; Similarly, Skill Level (ΦS) is the ratio of the
score obtained (S) by a batsman in a scale for assessing relevant skills to maximum possible score obtainable (So) in the same scale; and Attitude Level (ΦA) is the ratio of the score obtained (A) by a batsman in a scale for assessing relevant Attitudes to maximum possible score obtainable (Ao) in the same scale(Chakraborty, 2013). Mathematically,
0 K
K K
Φ = …(3)
S o S S
Φ = …(4)
A o A A
Φ = …(5)
If (PS1, Ψ1) and (PS2, Ψ2) be the two sets of the Probability of Success and Competency Level of two batsmen the equation (1) can be transformed to,
(
)
(
1)
22 1 2 1
1 1 1 1 s s s s P P n P P τ= −
Ψ − Ψ − …(6)
(
2)
2(
1)
12 1
1 s 1 s
s s
P P
e e
P P
τ τ
µ= − Ψ = − Ψ …(7)
The Probability of Success for scoring at least fifty runs in any ODI match is a concept and predicts forthcoming performances of the batsmen but cannot be verified with empirical data. If Competency Level of any batsman changes, his Probability of Success for doing the same will also change. Whereas the Rate of Success for scoring at least fifty runs per effective opportunity in ODI
match can be calculated from the statistical data of past
performances of the batsmen. and the Rate of Success of a batsman played sufficient number of effective innings is closed to his Probability of Success i.e. Rs~Ps . Hence, the equation (6) and (7) are can be rewritten as,
(
2 1)
(
(
12)
)
21 1 1 1 1 s s s s R R n R R τ= −(
2)
2(
1)
12 1
1 s 1 s
s s
R R
e e
R R
τ τ
µ= − Ψ = − Ψ …(9)
The Rate of Success calculated after performances and the Probability of Success assessed before performances are not the same. There may or may not have any correlation between these two variables. The strength of correlation between the Rate of Success and the Probability of Success should be investigated by finding Correlation Coefficient (r) between the two variables. The Pearson’s Correlation Coefficient (r) between the Rate of Success and the Probability of Success is given
by:
(
)
( )
2( )
22 2
s s s s
s s s s
n R P R P
r
n R R n P P
Σ − Σ
=
Σ − Σ Σ − Σ
…(10)
If r < -0.7, there will be strong negative linear relation between Rate of Success and the Probability of Success; if r ~ 0, there will be no relation between Rate of Success and the Probability of Success; and if r > +0.7, there will be strong positive linear relation between Rate of Success and the Probability of Success(Rumsey, 2011).
Subjects
Seven contemporary batsmen of Team India namely
(i) Virat Kohli, (ii) MS Dhoni, (iii) Lokesh Rahul, (iv) Rohit Sharma, (v) Ajinkya Rahane, (vi) Manish Pandey and (vii) Suresh Raina are selected for the purpose of
studying their probability of success for scoring at least
fifty runs in any ODI match whenever they will get an effective opportunity to do so.
Basic Assumption
It has been assumed here that all batsmen playing
ODI matches must have all the relevant knowledge for batting. Therefore, K=Ko i.e. ΦK= 1
Hence, the equation (2) will transform to,
s A
Ψ = Φ Φ …(11)
Procedure
The responses of cricket fans are used for assessing Skill
Levels and Attitude Levels of the selected batsmen. A survey questionnaire is designed with 12 (twelve) items for collecting the responses from the cricket fans. Eight items of equal weightage out of the twelve items are for describing skills and rest four items of equal weightage are for describing attitudes of the batsmen. Every item could be responded with either one option of excellent, very good, good, average, or poor. The survey responses are collected from 52 (fifty two) randomly selected cricket fans from Kolkata, North 24 Parganas and South 24 Parganas districts of West Bengal, India. The survey
outcomes are converted to numerical data by assigning
4 for excellent option; 3 for very good option; 2 for good option; 1 for average option; and 0 for poor option in each of the item of the questionnaire.
RESULTS
The computations of the Competency Levels of the
seven batsmen by using equations (4), (5), (11) and the obtained average scores of the survey outcome on ‘Skill’ and ‘Attitude’ components of the batsmen are reported in Table 1. The Competency Levels of Virat Kohli (Ψ=0.872) is > Lokesh Rahul (Ψ=0.714) > MS Dhoni (Ψ=0.692) > Ajinkya Rahane (Ψ=0.557) > Rohit Sharma (Ψ=0.536) > Suresh Raina (Ψ=0.469) > Manish Pandey (Ψ=0.405) (Table 1). The Competency Levels indicate the quality of the batsmen but cannot predict the Probability of the batsmen for scoring at least fifty runs in any ODI match. The calculation of the Rate of Success of each of
the seven batsmen from the ratio of number of times
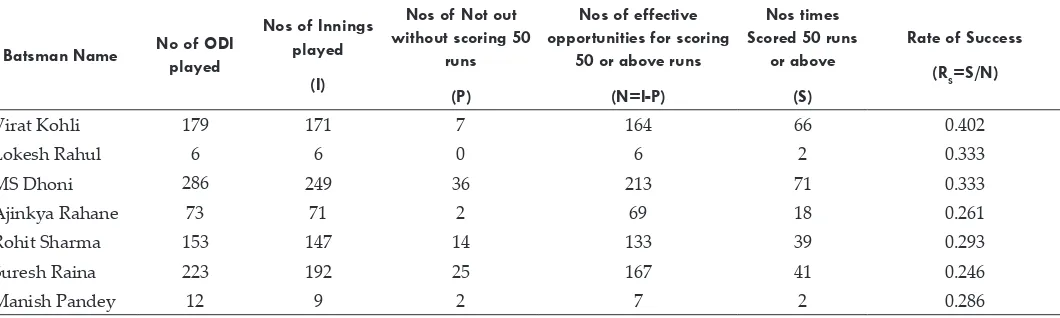
he scored fifty runs or more to the numbers of effective opportunities he had for scoring fifty runs is reported in Table 2. Numbers of not out innings of a batsman without scoring fifty runs are deducted from his total number of innings to determine number of effective opportunities he had for scoring fifty runs or more. The Rate of Success of Virat Kohli (RS=0.402) is > Lokesh Rahul and MS Dhoni (RS =0.333) > Rohit Sharma (RS =0.293) > Manish Pandey (RS =0.286) > Ajinkya Rahane (RS =0.261) > Suresh Raina (RS =0.246) (Table 2). The Rate of Success
of the batsmen is calculated from the statistical data of
seven batsmen for scoring at least fifty runs in ODI matches (Table 2). Thus, their RS are considered to be
approximately equal to their PS and used for calculating
the value of the constants µ and τ. The calculation of the constants µ and τ from the equations (8) and (9) is presented in Table 3. The computation of the Probability
of Success of each of the seven batsmen for scoring
fifty runs or more in ODI matches by using equation (1) for the value of his Competency Level (Table 1), for µ=7.499 and τ=1.908 (Table 3) is reported in Table 4. The Probability of Success of Virat Kohli (PS=0.413) is > Lokesh Rahul (PS =0.343) > MS Dhoni (PS =0.333) > Ajinkya Rahane (PS =0.292) > Rohit Sharma (PS =0.271) > Suresh Raina (PS =0.246) > Manish Pandey (PS =0.224) (Table 4). The comparison between RS and PS of the
seven batsmen is presented in Fig. 1. The calculations
of the Pearson’s Correlation Coefficient between the
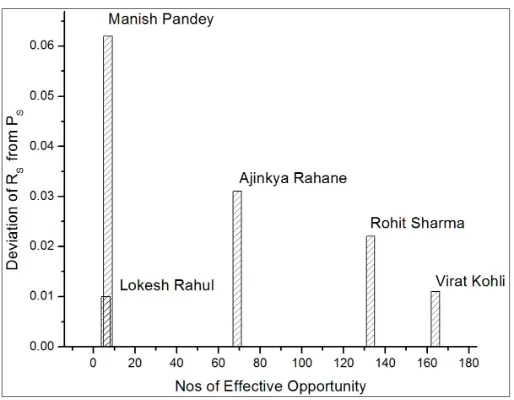
RS and the PS and the deviations of the RS from the PS of the rest five batsmen i.e. Virat Kohli, Rohit Sharma, Ajinkya Rahane, Lokesh Rahul, and Manish Pandey are reported in Table 5. The Pearson’s correlation coefficient between the RS and the PS of Virat Kohli, Rohit Sharma, Ajinkya Rahane, Lokesh Rahul, and Manish Pandey is 0.8709 (Table 5). The variation of the magnitude of the
deviation of the RS from the corresponding PS with the number of effective opportunities reported in Fig. 2.
DISCUSSION
The ranks of all the seven batsmen in respect of the PS
are not the same as that of the batsmen in respect of the RS but the figure showing the data of the RS and the PS plotted against the Competency Levels of the batsmen Table 1: Competency Levels of the seven batsmen on the basis of the survey responses
Batsman Name
Average Scores of Skills in the
scale (S)
Maximum possible Scores of
Skills in the scale (So)
Skill Level
(Φs=S/So)
Average Scores of Attitudes in the scale (A)
Maximum possible Scores of Attitudes in the
scale (Ao)
Attitude Level
(ΦA=A/Ao)
Competency Level in the scale
(Ψ=ΦSΦA)
Virat Kohli 29.692 32 0.928 15.039 16 0.940 0.872
MS Dhoni 24.673 32 0.771 14.365 16 0.898 0.692
Rohit Sharma 23.788 32 0.743 11.538 16 0.721 0.536
Lokesh Rahul 26.538 32 0.829 13.769 16 0.861 0.714
Ajinkya Rahane 25.038 32 0.783 12.115 16 0.757 0.593
Manish Pandey 21.904 32 0.685 9.462 16 0.591 0.405
Suresh Raina 23.135 32 0.723 10.385 16 0.649 0.469
Table 2: Rate of Success of the seven batsmen
Batsman Name No of ODI
played
Nos of Innings played
(I)
Nos of Not out without scoring 50
runs
(P)
Nos of effective opportunities for scoring
50 or above runs
(N=I-P)
Nos times Scored 50 runs
or above
(S)
Rate of Success (RS=S/N)
Virat Kohli 179 171 7 164 66 0.402
Lokesh Rahul 6 6 0 6 2 0.333
MS Dhoni 286 249 36 213 71 0.333
Ajinkya Rahane 73 71 2 69 18 0.261
Rohit Sharma 153 147 14 133 39 0.293
Suresh Raina 223 192 25 167 41 0.246
Manish Pandey 12 9 2 7 2 0.286
(Fig. 1) indicates that there is a correlation between the
RS and the PS of the batsmen for scoring at least fifty runs in any ODI cricket match. It is mention worthy that the
RS and the PS of MS Dhoni and Suresh Raina are exactly
the same because they are considered as the reference
batsmen for calculating values of the constants µ and τ. There is a strong positive linear relationship between
the RS and the PS because the Correlation Coefficient (0.8709) between the RS and the PS is greater than +0.7 (Table 5). The magnitude of the deviation of the RS from the corresponding PS decreases with the increases of number of effective opportunities (Fig. 2). Thus the
RS has a tendency to become closer to the PS after an
adequate number of effective opportunities. The RS of
Lokesh Rahul is already much closer to his PS though he
played only six innings of ODI matches. Lokesh Rahul is in a very initial stage of his ODI batting carrier and his
RS may be deviated further from PS in the next few ODI matches. It’s noteworthy that there will be no deviation here for MS Dhoni and Suresh Raina because they are
considered as reference batsmen for computing value of
the constants µ and τ.
LIMITATIONS AND FUTURE RESEARCH
There are some limitations in this study which mayinclude some errors in the results and can be minimised
Table 3: Constants μ and τ
Rate of Success of MS Dhoni
(RS1)
Rate of Success of Suresh Raina
(RS2)
Competency Level of MS Dhoni as per the survey
(Ψ1)
Competency Level of Suresh Raina as per the
survey (Ψ2)
Value of in the scale
Value of in the scale
0.333 0.246 0.692 0.469 1.908 7.499
Table 4: Probability of Success of the seven batsmen
Batsman Name Competency Level
(Ψ)
Probability of Success (PS)
Virat Kohli 0.872 0.413
Lokesh Rahul 0.714 0.343
MS Dhoni 0.692 0.333
Ajinkya Rahane 0.593 0.292
Rohit Sharma 0.536 0.271
Suresh Raina 0.469 0.246
Manish Pandey 0.405 0.224
Table 5: Deviation Rates of Success from Probability of Success and Correlation Coefficient between the two
Sl. No
(n) Batsman’s Name
Nos of effective opportunity (N)
Rate of Success
(RS)
Probability of Success (PS)
Deviation
δ=|RS-PS|
Pearson’s Correlation
Coefficient
(r)
1 Lokesh Rahul 6 0.333 0.343 0.010
0.8709
2 Manish Pandey 7 0.286 0.224 0.062
3 Ajinkya Rahane 69 0.261 0.292 0.031
4 Rohit Sharma 133 0.293 0.271 0.022
in future research. Firstly, the survey outcome does not contain the opinions of any recognised cricket expert.
Fig. 1: Showing the Comparisons between Rates of Success and Probability of Success
Fig. 2: Showing the Variation of the Deviation of Rates of Success from Probability of Success with the number of
effective opportunities
If survey responses were collected from the cricket experts instead of the cricket fans the computation of Competency Levels would have been more valid and reliable. Secondly, the Rate of Success and the Probability of Success of the two reference batsmen are
considered equal for calculating the constants µ and τ.
This also includes some errors in the computation of
Probability of Success because the Rate of Success and the Probability of Success are not the same. However, the two batsmen, who played the most number of innings out of the seven batsmen, have been selected here in this paper for minimising this error while calculating the constants µ and τ.
ACKNOWLEDGEMENTS
The author of this paper wishes to express his thanks with gratitude to all the participants for their valuable responses to the survey questionnaire.
CONCLUSION
The Probability of Success a batman for scoring some specific runs or above in any One-Day International cricket match is assessable with his Competency Level of batting. There is a strong positive linear relationship between the Probability of Success of any batsman while the Probability of Success is assessable before his actual performances and his Rate of Success in the ODI cricket
matches and the Rate of Success of any batsman has
tendency to become closer to his Probability of Success after adequate number of effective opportunities. Thus
this paper has a capacity to encourage the selectors of
cricket teams for using the concept of the Probability of
Success instead of the statistical records of performances
in selecting batsmen for their teams.
REFERENCES
Barr, G.D.I. and Kantor, B.S. 2004. A criterion for comparing and selecting batsman in limited over cricket, Journal of Operation Research Society, 55: 1266-1274.
Barr, G.D.I. and van den Honert, R. 1998. Evaluating batsmen’s scores in test cricket. South African Statistical Journal, 32: 169-183.
Boora, R. 2016. Neuroticism of cricket players in relation to their sports achievement, International Journal of Physical Education, Sports and Health, 3(1): 179-182.
Chakraborty, R.C. 2013. A Model for Assessing Competency Level, International Journal of Human Resource Management and Research, 3(4): 33-40.
Howstat. Player Records and Statistics. Retrieved on March, 11, 2017 from http://www.howstat.com/cricket/Statistics/Players/ PlayerMenu.asp
Mustafa, F. 2013. Cricket and globalization: global process and imperial game, Journal of Global History, 8(2): 318-341.
Rumsey, D.J. 2011. Statistics for Dummies, 2nd Ed. Indianapolis, IN:
Wiley Publishing Inc.