ISSN: 2231-5381 http://www.ijettjournal.org
Page 791
Steel Fibre Reinforced Concrete
Abdul Ghaffar1
Assistant Professor,Jawaharlal Darda institute of Engineering and Technology, Yavatmal,
Amit S. Chavhan2
Assistant Professor,Jawaharlal Darda institute of Engineering and Technology, Yavatmal,
Dr.R.S.Tatwawadi3
Professor,Jawaharlal Darda institute of Engineering and Technology, Yavatmal,
Abstract
The purpose of this research is based on the investigation of the use of steel fibres in structural concrete to enhance the mechanical properties of concrete. The objective of the study was to determine and compare the differences in properties of concrete containing without fibres and concrete with fibres. This investigation was carried out using several tests, compressive test and flexural test. A total of eleven mix batches of concrete containing 0% to 5% with an interval of 0.5% by wt. of cement. ‘Hooked’ steel fibres were tested to determine the enhancement of mechanical properties of concrete. The workability of concrete significantly reduced as the fibre dosage rate increases. Key words: Steel fibres, FRC, Workability, Strengths.
1. Test Conducted On Harden Concrete: Confirming To IS 516-1959 [15]
In present work weigh batching hand mixing is used to study cube compression test, flexural test on beams, on plain and Steel Fibre Reinforced Concrete (SFRC) were carried on number of samples. The experimental set up for various tests were described below.
1.1 Hooked Steel fibres
ISSN: 2231-5381 http://www.ijettjournal.org
Page 792
Table 1.1: Physical Properties of Steel Fibers
Sr. No. Property Values
1. Diameter 0.75 mm
2. Length of fiber 60 mm
3. Appearance Bright in clean wire
4. Average aspect ratio 80
6. Deformation Hooked at both ends
7. Tensile strength 1050 MPa
8. Modulus of Elasticity 200 GPa
9. Specific Gravity 7.8
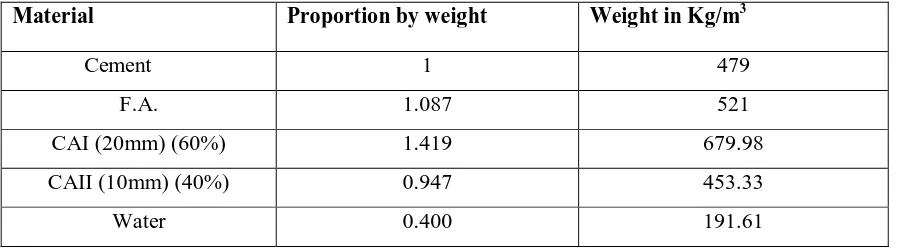
1.2Mix Design of Concrete
IS method of mix designed was used for mix design of M-35 grade of concrete. The quantities
of ingredient materials and mix proportions as per design are as under.
Table 1.2: Quantity of Materials per Cubic Meter of Concrete
Material Proportion by weight Weight in Kg/m3
Cement 1 479
F.A. 1.087 521
CAI (20mm) (60%) 1.419 679.98
CAII (10mm) (40%) 0.947 453.33
Water 0.400 191.61
1.3 Compressive strength test on cube
A cube compression test performed on standard cubes of plain and SFRC of size 100 x 100 x 100mm after 7 days and 28 days of immersed in water of curing plain concrete and SFRC specimens. Results are shown in Table (2.2). The compressive strength of specimen was calculated by the following formula:
fcu = C
P
A
(1)Where,
Pc = Failure load in compression, KN
A = Loaded area of cube, mm2 fcu = compressive strength
Expressions for compressive strength in 3 rd degree polynomial in terms of Vf are given by the following
ISSN: 2231-5381 http://www.ijettjournal.org
Page 793
7 Days: fcu = 0.047 Vf 3- 1.143 Vf 2 + 4.689 Vf + 29.08 (2)
28 Days: fcu = - 0.068 Vf 3 + 0.213 Vf 2 + 0.828 Vf + 42.77 (3)
Experimental results and results of regression analysis are presented in Table 3.0
Vf Volume Fraction of Fibers (%)
1.4 Flexural test on plain concrete and SFRC
Standard beams of size 100 x 100 x 500mm were supported symmetrically over a span of 400mm and subjected to two points loading till failure of the specimen. The deflection at the center of the beam is measured with sensitive dial gauge on UTM.
The flexural strength was determined by the formula
fcr = 2
f
P L
bh
(4)Where,
fcr = Flexural strength, MPa
Pf = Central point through two point loading system, N L = Span of beam, mm
b = Width of beam, mm
h = Depth of beam, mm
Expressions for flexure strength in 3rd degree polynomial in terms of Vf are obtained
7 Days: fcr = - 0.0149 Vf 3+ 0.0301 Vf 2+ 0.27 Vf + 5.098 (5)
28 Days: fcr = - 0.0262 Vf 3 + 0.245Vf2 - 0.3963 Vf+ 6.114 (6)
Experimental results and results of regression analysis are presented in Table 4.0
2. RESULT AND DISCUSSIONS
2.1 Experimental Analysis
ISSN: 2231-5381 http://www.ijettjournal.org
Page 794
strength of material theory. Various tables presented in this chapter shows the results obtained from the test on wet and harden concrete. Results of harden SFRC are discussed in comparison with those of normal concrete.
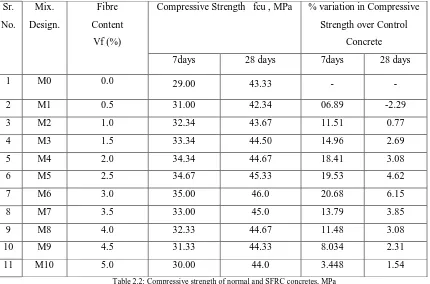
2.2 Compressive strength test on cube
The compressive strength of concrete with various fibre volume fractions is calculated and presented in Table 2.2 Sr.
No.
Mix. Design.
Fibre
Content Vf (%)
Compressive Strength fcu , MPa % variation in Compressive Strength over Control
Concrete 7days 28 days 7days 28 days 1 M0 0.0 29.00 43.33 - - 2 M1 0.5 31.00 42.34 06.89 -2.29 3 M2 1.0 32.34 43.67 11.51 0.77 4 M3 1.5 33.34 44.50 14.96 2.69 5 M4 2.0 34.34 44.67 18.41 3.08 6 M5 2.5 34.67 45.33 19.53 4.62 7 M6 3.0 35.00 46.0 20.68 6.15 8 M7 3.5 33.00 45.0 13.79 3.85 9 M8 4.0 32.33 44.67 11.48 3.08 10 M9 4.5 31.33 44.33 8.034 2.31 11 M10 5.0 30.00 44.0 3.448 1.54
Table 2.2: Compressive strength of normal and SFRC concretes, MPa
Results of compressive strength are shown in Table (2.2). It indicates the optimum volume fraction of fibers which gives maximum strength at 28 days is 3.0%. The percentage augment in strength at this volume fraction of fibers over normal concrete at 7 and 28 days is 20.68% and 6.15% respectively. Cracks occur in microstructure of concrete and fibers reduce the crack formation and propagation. After optimum level, there is drop in compressive
strength which indicates air entrapment in the concrete due to incorporation of high fiber volume fraction.
2.3 Flexural strength test on Beam
Flexural strength is obtained for various fibre volume fraction and results are presented in Table 2.3.
Sr. No.
Mix. Designati
on.
Fibre Volume fraction Vf (%)
Flexural strength N/mm2 From Eqn (6)
% variation in Flexural Strength
ISSN: 2231-5381 http://www.ijettjournal.org
Page 795
3 M2 1.0 5.33 6.01 04.14 -00.66 4 M3 1.5 5.57 5.95 08.85 -01.76 5 M4 2.0 5.69 6.11 11.20 00.88 6 M5 2.5 5.73 6.29 11.98 03.96 7 M6 3.0 5.75 6.21 12.34 02.64 8 M7 3.5 5.76 6.53 12.50 07.94 9 M8 4.0 5.83 7.01 13.80 15.86 10 M9 4.5 5.49 6.93 07.29 14.54 11 M10 5.0 5.39 6.91 05.20 14.10
Table 2.3: Flexural strength of fibre reinforced concrete, MPa
Table 2.3 shows that the flexural strength increases with increase in fiber content up to 4.0% and then it decreases. The maximum values at 7 and 28 days are 5.83 and 7.01 respectively. Thus, there is enhancement in flexural strength of concrete from 2.03% to 13.80% at 7 days and from 0.88% to 15.86 % at 28 days.
3 MATHEMATICAL ANALYSES
3.1 Compressive strength
Mix. Desi. Fibre Volume fraction Vf (%)
Compressive strength fcu (MPa)
Exp. Value 7 days
From Eqn(4) 7 days
Exp. Value 28 days
From Eqn (5) 28 days
M0 0.0 29.00 29.08 43.33 42.77 M1 0.5 31.00 31.14 42.34 43.23 M2 1.0 32.34 32.67 43.67 43.74 M3 1.5 33.34 33.70 44.50 44.26 M4 2.0 34.34 34.26 44.67 44.73 M5 2.5 34.67 34.39 45.33 45.11 M6 3.0 35.00 34.13 46.0 45.34 M7 3.5 33.00 33.50 45.0 45.36 M8 4.0 32.33 32.56 44.67 45.14 M9 4.5 31.33 31.32 44.33 44.61 M10 5.0 30.00 29.83 44.0 43.74 Table 3.1 Compressive strength
ISSN: 2231-5381 http://www.ijettjournal.org
Page 796
3.2 Flexural strengthMix. Desi. Fibre Volume fraction Vf (%)
Flexure strength (ff) MPa
Exp. Value 7 days
From Eqn(7) 7 days
Exp. Value 28 days
From Eqn (8) 28 days
M0 0.0 5.12 5.10 6.05 6.11 M1 0.5 5.22 5.24 6.03 5.97 M2 1.0 5.33 5.38 6.01 5.93 M3 1.5 5.57 5.52 5.95 5.97 M4 2.0 5.69 5.64 6.11 6.07 M5 2.5 5.73 5.73 6.29 6.22 M6 3.0 5.75 5.78 6.21 6.38 M7 3.5 5.76 5.77 6.53 6.55 M8 4.0 5.83 5.71 7.01 6.70 M9 4.5 5.49 5.56 6.93 6.82 M10 5.0 5.39 5.34 6.91 6.88 Table 3.2Comparison of flexure strength by regression analysis.
From table 3.2 with addition of specific amount of fibres to the concrete, higher ductility is achieved. Results of experimental and regression analysis are in good agreement with each other.
From Table 4 the experimental values and values obtained from regression analysis are in good agreement with each other.
4. CONCLUSIONS
1. Workability decreases with increase in fibre content.
2. The wet and dry density (7 and 28 Days) goes on decreasing as the percentage fibre volume fraction increases.
3. The maximum percentage increase in compressive strength, flexural strength, achieved are 6.15, and 7.94, respectively at 3.0%, 4.0%, of fibre volume fractions.
4. In general, the satisfactory improvement in various strengths is observed with the inclusion of Steel fibres in the plain concrete. However, maximum gain in strength of concrete is found to depend upon the amount of fibre content. The optimum fibre content to impart maximum gain in various strengths varies with type of the strengths.
ISSN: 2231-5381 http://www.ijettjournal.org
Page 797
REFERENCES
[1]. Singh S.P, Kaushik S.K, “Fatigue Strength of Steel Fibre Reinforced concrete in Flexure”, ACI Material Journal, Vol.98, No.4, 2001pp.306-312.
[2]. Balendran R.V., Zhou F.P, A. Nadeem, A.Y.T. Leung, “Influence of Steel Fibres on Strength and Ductility of Normal and
Lightweight High Strength Concrete”, Building and Environment, Vol.37, No.12, (2002), pp. 1361-1367.
[3]. Remigijus Salna, Gediminas Marciukaitis, “The Influences of Shear Span Ratio on Load Capacity of Fibre Reinforced Concrete
Elements with Various Steel Fibre Volumes”, ISSN 1392-3730 print / ISSN 1822-3605 online Journal of civil Engineering and
Management, Vol XIII, No. 3, 2007,pp 209-215
[4]. Job Thomas and Ananth Ramaswamy, “Mechanical Properties of Steel Fiber-Reinforced Concrete”, ASCE Journal of Materials in Civil Engineering, Vol. 19, No. 5 , 2007, pp.385-395.
[5] Jacek Katzer, “Steel Fibers and Steel Fiber Reinforced Concrete in Civil Engineering”. The Pacific Journal of Science and
Technology, Vol.7, No.1, May 2006 (Spring), pp. 53-58
[6]. Julie Rapoport, Corina-Maria Aldea, Surendra P. Shah, Bruce Ankenman and Alan Karr, “Permeability of Cracked Steel Fiber-
Reinforced Concrete”. Journal of Materials in Civil Engineering, Vol. 14, No. 4, August 1, 2002, pp.355-358.
[7]. Jean-Louis Granju and Sana Ullah Balouch, “Corrosion of steel fibre reinforced concrete from the cracks”. Cement and Concrete Research, Vol. 35, 2005, pp. 572 – 577.
[8]. Calogero Cucchiara, Lidia La Mendola and Maurizio Papia, “Effectiveness of stirrups and steel fibers as shear reinforcement”.
Cement and Concrete Research, Vol.26, 2004, pp. 777-786.
[9]. Bayramov F., Tasdemir C. and Tasdemir M.A., “Optimisation of steel fiber reinforced concretes by means of statistical response Surface method”. Cement & Concrete Composites, Vol. 26, 2004, pp.665–675.
[10]. IS.383, “Specifications for Coarse and Fine Aggregates from Natural Sources for Concrete,” Bureau of Indian Standards, New
Delhi, 1970.
[11]. I.S.1489-1991, “Specification for Portland pozzolonas cement Part 1 Fly ash based (Third Revision)”, Bureau of Indian Standard,
New Delhi, 1991.
[12]. I.S.456-2000, “Indian Standard Code of Practice for Plain and Reinforced Concrete, (fourth Revision)”, Bureau of Indian Standard, New Delhi, 2000 .
[13]. I.S.10262-1982, “Indian Standard Recommended Guidelines for Concrete Mix Design”, Bureau of Indian Standard, New Delhi,
1983.