EFFECT OF WEIGHT IN MOTION DETECTION SYSTEM IN
HUNGARY
Beatrix Ronay-Tobel1
1 Department of Road Transport Control, Transport Authority of the Ministry for Innovation and Technology, Hungary
Received 24 August 2019; accepted 22 December 2019
Abstract: In 2018, the National Dynamic Axle Weight Measurement System was introduced in Hungary. More than 100 control points were deployed countrywide. On this points the weight of road vehicles could be measured without stopping them, without harming the traffic. This paper aims to present the changes in road usage as a result of introducing the dynamic axle weight measurement system if any. The research hypothesis of this paper that the dynamic axle weight measurement system with the proper combination of highway code would not cause significant change on route choice and road usage patterns. Detailed statistical analysis of preliminary results was conducted separately for domestic and for foreign vehicles. Analysis of time series was done. Based on the results author could conclude that the introduction of the dynamic axle weight measurement system has not caused significant change, but also increased the effectiveness of control. Also, a preliminary economic investigation was elaborated. Keywords: automatic weight enforcement, road usage, by-pass.
1 Corresponding author: [email protected]
1. Introduction
It is following the successful example of the Hungarian road toll system and the intelligent road checkpoint system, a new dynamic weight control network was deployed in Hungary. This will also utilise the ‘principle of objective liability. This means that in case of a vehicle- or axle-weight limit violation, the administrative procedure is immediately initiated against the transport operator. Legally binding administrative decisions are generated like in case of speeding, or unauthorised usage of toll-roads. This means the margin of error is minimal when it comes to vehicle identification and the evaluation of Weight-In-Motion measurement data. In order to reach the social acceptance of such a system,
all parties had to work in close cooperation (Šimecki et al., 2013; Oláh, 2016). The system detects over 40 million events monthly. Such a vast amount of big-data shall be collected and processed within the network in a way that effectively supports traffic control and road maintenance, meanwhile respects applicable information privacy and data protection acts (Oláh et al., 2018; Nesic et al., 2015). Preliminary technical details were already investigated and analysed (Ronay-Tobel et al., 2019).
2. Methodology
bridges present a much better inspection coverage, but they cause significant time loss. The dynamic weight-in-motion project in Hungary has achieved a significant increase on coverage and enforcement efficiency, featuring 107 stations monitoring 274 lanes with approximately 1500 quartz sensors. The development was financed (for over 90 Million EUR) by domestic budget and managed by the public-sector consortium of National Transport Authority of Hungary and the National Toll Payment Services Plc (Ronay-Tobel et al., 2019). Decision-makers have been guided by the well-known goals of the proposed solution:
• improvement of road safet y (as overloaded vehicles pose an increased risk and severity of accidents) (Török, 2015);
• preserving the generalcondition of the roads (as overloaded axles significantly deteriorate the public roads network; its annual maintenance cost is larger than the total investment of project TSM) (Sipos, 2014);
• create a fair, competitive environment (as law-abiding businesses had to face a market distorted by carriers violating regulations for higher profit) (Oláh et al., 2017).
The existing infrastructure of the toll enforcement system provided a cost-efficient method of implementation, utilising its power-, communication-, and processing capabilities. The system is capable of detecting and measuring all types of vehicles, including cars, minivans, trailers, motorcycles. These drivers still have to comply with applicable weight regulations and may be subject to regular inspection by authorities.
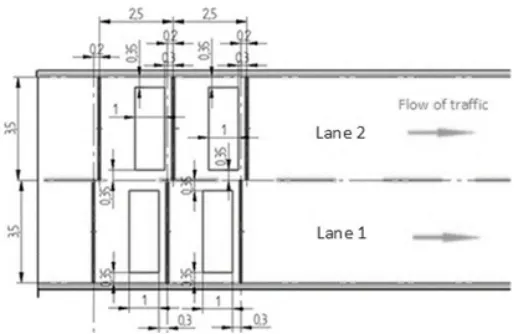
Sensor arrays are installed in two basic configurations:
• Two sensor rows - used for preselection, calibrated for weighing;
• Three sensor rows - used for direct enforcement, certified by a notified body.
Fig. 1.
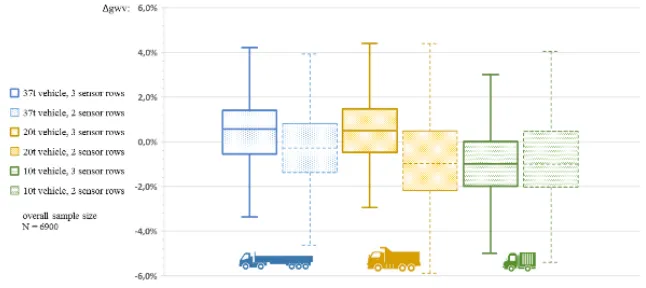
Quartz sensors are installed in the full width of the road (including emergency lanes) in a single line (Fig. 1) or offset, depending on available lane width. The system is prepared to measure vehicles passing in-between two parallel lanes. Detection units have located the roadside. In order to meet ‘Class I – Excellent’ quality parameters stated in COST 323 specification, providing appropriate geometric and mechanical conditions for high accuracy measurement (Jacob et al., 2002). Statistical analysis and assessment of measurement error of gross vehicle weight are
characterised by 2.0..2.5% interquartile range (IQR). Sites are featuring only two sensor rows and lower road quality classification, usually having +0,5% higher IQR as seen in the boxplot below (Fig. 2). The boxplot covers a specific subset of reference vehicles that were present at the verification of both certified and non-certified (preselection) stations, therefore unloaded vehicles are excluded. The presented dataset should be considered as a base of comparison of site-layouts rather than the representative benchmark of quartz technology.
Fig. 2.
Distribution of Relative Error for the Gross Weight of Loaded Reference Vehicles Source: (Ronay-Tobel et al., 2019)
3. Results of Live Operation
Although the system started to work on Sept 2017, automatically generated administrative fines for weight limit violations began to be sent out in July 2018. A considerable amount of data has been collected. An exact definition of “Big Data” is challenging to nail down because projects, vendors, practitioners, and business professionals use it quite differently. With that in mind, generally speaking, Big Data is:
• large datasets;
• the category of computing strategies and technologies that are used to handle large datasets.
at designing solutions by Big Data. By the term of new challenges, it means the massive scale, the speed of ingesting and processing, and the characteristics of the data that must be dealt with at each stage of the process. There exist “three Vs of Big Data” to describe some of the characteristics that make big data different
from other data processing (Laney, 2001). These are: volume, velocity and variety.
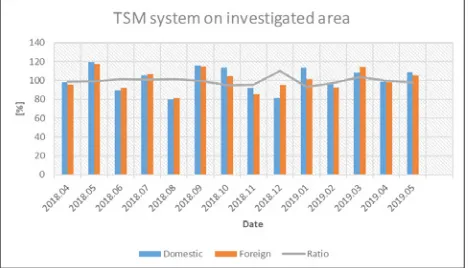
There is far more to consider than this 3V such as visualisation, veracity, variability, and value. From the generated data monthly report were created (Fig. 3).
Fig. 3
Example of the Preliminary Report Source: Own Edition
The monthly data were statistically analysed in order to reveal possible changes as an effect of introduction.
4. Analysis and Discussion
The previous analysis of data showed that no significant change in road usage was
detectable. The ratio of foreign vehicles to domestic has not significantly fluctuate.
The introduction of dynamic weight-in-motion detection system has not caused significant restructuring of road usage patterns - neither in domestic nor in foreign traffic.
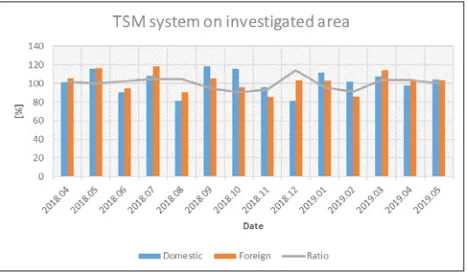
Fig. 4.
In order to capture changes in traffic, previous months were compared. As it can be seen on Fig. 4, the changes are not significant nor in domestic neither in foreign traffic in category J2. The average change in J2 traffic was:
• 101.6 % in case of domestic traffic with the variance of 12.5 %;
• 100.4 % in case of foreign traffic with the variation of 10.8 %;
• the domestic-foreign-ratio average was 99.5 % with 4.2 % variation.
Fig. 5.
Changes in Road Usage Pattern for Vehicle Category J3 Source: Own Edition
In order to capture changes in traffic, the previous months were compared. As can be seen in Fig. 5 the changes are not significant nor in domestic neither in foreign traffic in category J3. The average change in J3 traffic was:
• 102.3 % in case of domestic traffic with the variance of 12.0 %;
• 101.9 % in case of foreign traffic with the variation of 10.5 %;
• the domestic-foreign-ratio average was 100.1 % with 6.4 % variation.
Fig. 6.
In order to capture changes in traffic, previous months were compared. As can be seen in Fig. 6, the changes are not significant nor in domestic neither in foreign traffic in category J4. The average change in J4 traffic was:
• 101.3 % in case of domestic traffic with the variance of 11.6 %;
• 100.3 % in case of foreign traffic with a variation of 13.2 %;
• the domestic-foreign-ratio average was 99.6 % with 1.7 % variation.
Detailed statistical analysis of preliminary results was conducted separately for domestic and for foreign vehicles. Analysis of time series was done. Based on the results author could conclude that the introduction of the dynamic axle weight measurement system has not caused significant change, but also increased the effectiveness of control.
Fines were applied on 1294 occasions, for the total value of 62.6 million HUF. These fines are five-times more considerable than compared to the five-year average performance of mobile inspection units (Fig. 7).
Fig. 7
Annual Number of Fines Imposed on Overweight Trucks Source: (Ronay-Tobel et al., 2019)
5. Conclusion
Apart from the lower acquisition costs provided by the in-bulk purchase of hardware, and several site-specific services – such as calibration and maintenance – being conducted in a cost-efficient way, what made the implementation financially feasible was the efficient utilisation of the national road toll system. Vehicle detection, automatic number plate recognition functionality, gantries with power and communication
outlets were already granted on the sites. Hence the duplication of roadside infrastructure could be avoided altogether. Another advantage of full network coverage happened to be the potential for self-correction, and the immediate detection of sites/sensors with their accuracy suspected being below the required level.
References
Jacob, B.; O’Brien, E.J.; Jehaes, S. 2002. Weigh-in-Motion of Road Vehicles – Final Report of the COST323, LCPC, Paris. Available from internet: <https://pdfs. semanticscholar.org/d387/3576868f6cb27a1dc1c66e af0b6120a39090.pdf>.
Laney, D. 2001. 3D data management: Controlling data volume, velocity and variety. META Group Inc., 208 Harbor Drive, P.O. Box 120061, Stamford, CT 06912-0061. 4p. Available from internet: <https:// blogs.gartner.com/doug-laney/files/2012/01/ad949-3D- Data-Management-Controlling-Data-Volume-Velocity-and-Variety.pdf>.
Nešić, A.; Čavka, I.; Čokorilo, O. 2015. Shifting to more environmentally friendly modes in long-distance transport. In Proceedings of 2nd international academic conference on places and technologies 2015, Nova Gorica, Slovenia, June 18-19, 479-484.
Oláh, J. 2016. Introduction of operation support technical devices needed for the transportation in the 21st century [in Hungarian: 21. századi fuvarozáshoz szükséges, működést
támogató technikai eszközök bemutatása], Department of
Logistics Management, Institute of Applied Informatics and Logistics, Faculty of Economics, University of Debrecen, Hungary, Gradus 3: 454-460.
Oláh, J.; Karmazin, G.; Pető, K.; Popp, J. 2018. Information technology developments of logistics service providers in Hungary, International Journal of Logistics Research and Applications 21(3): 332-344. doi: 10.1080/13675567.2017.1393506.
Oláh, J.; Halasi, G.; Szakály, Z.; Popp, J.; Balogh, P. 2017. The impact of international migration on the labor market–A case study from Hungary, Amfiteatru
Economic 19(46): 790-805.
Ronay-Tobel, B.; Mikulas, R.; Katkics, A.; Toldi, M. 2019. Weight Enforcement Network of Hungary (A multilevel case study on WIM). In Proceedings of the 8th
International Conference on Weigh-In-Motion - ICWIM8,
19-23 May 2019, Prague, Czech Republic.
Sipos, T. 2014. Coherence between Horizontal and Vertical Curves and the Number of the Accidents,
Periodica Polytechnica Transportation Engineering, 42(2): 167-172. doi: 10.3311/PPtr.7403.
Šimecki, A.; Steiner, S.; Čokorilo, O. 2013. The accessibility assessment of regional transport network in the South East Europe, International Journal for Traffic
and Transport Engineering 3(4): 351-364. doi: 10.7708/
ijtte.2013.3(4).01.