Iran J Public Health, Vol. 47, No.7, Jul 2018, pp.1007-1016
Original Article
Process and Results of Implementing Disease Management
Pro-gram in Patients with First-time Ischemic Stroke
Hong-Rong YANG
1, Lei MA
1, Yi-Feng JIANG
1, Yun-Cheng WU
2, Eugene C. LAI
3,
*Yan-Hong ZHU
1,4,51. Dept. of Science, Shanghai General Hospital, Shanghai Jiao Tong University School of Medicine, Shanghai, China 2. Dept. of Neurology, Shanghai General Hospital, Shanghai Jiao Tong University School of Medicine, Shanghai, China
3. Houston Methodist Neurological Institute, Houston, Texas, USA
4. Health Economic Research Institute, Shanghai Jiao Tong University National Institute Hospital Development, Shanghai, China 5. School of Public Health, Shanghai Jiao Tong University School of Medicine, Shanghai, China
*Corresponding Author: Email: [email protected]
(Received 09 Feb 2017; accepted 23 Jul 2017)
Introduction
Stroke is a global health problem and the main cause of disability-adjusted life-years according to the previous report (1). Multiple factors, includ-ing sociodemographic, clinical, psychosocial, and behavioral factors can impact the onset and pro-gression of stroke (2). Among them, behavioral risk factors are responsible for 80% of all the stroke cases (3). Therefore, integrated health care
approaches which can better manage the high-risk behaviors of stroke patients are urgently needed.
Several approaches have been proposed to re-duce rehospitalization and healthcare costs (4). Disease management program (DMP) appears to be a multifaceted program associated with im-proving health outcomes and lowering costs Abstract
Background: This study aimed to examine the effect of disease management program (DMP) on the patients with first-time ischemic stroke (IS).
Methods: A DMP with 4 parts of performance indicators (PIs, including outpatient, emergency department,
inpatient and follow-up treatment) was implemented in patients with stroke in 2 hospitals (Hospital T and R) in Shanghai China from 2007-2010. The effect of DMP on the outcome of IS patients was analyzed according to the criteria of the National Institute of Health Stroke Scale (NIHSS). Furthermore, the total effective rate of DMP, average length of stay, hospitalization cost, and cost-effectiveness ratio (CER) between DMP and non-DMP patients were calculated, followed by the cost-effectiveness analysis.
Results: The total effective rate of DMP (T: 69.9%; R: 76.6%) was significantly (P<0.05) higher than that of
non-DMP (T: 60.8%; R: 62.7%) group in the same hospital. In addition, a significant (P<0.05) difference in effective rate was observed between DMP and non-DMP at the NIHSS score ≥ 7. Furthermore, the average length of stay and hospitalization cost of the patients in DMP group were significantly (P<0.05) lower than those in non-DMP group. A superior CER was also found in DMP group than non-DMP group.
Conclusion: The implementation of DMP for IS can effectively improve the treatment outcome and reduce
the average length of stay and hospitalization cost.
among chronic diseases (5). This program is characterized by disease staging, evidence-based guidelines, patient education, collaborative care, aggressive screening for complications, and early and appropriate specialty referral (6). In recent years, a number of DMPs have been examined, and favorable effects on morbidity and even mortality have been reported (7, 8). For instance, the association of evidence-based guidelines with stroke care was examined and suggested a statis-tically and clinically significant improvement in the treatment of patients with IS (9). Although certain progress has been made for the use of DMP, further verification of the short-term and long-term effects on patient outcomes is still needed.
Therefore, the present study was designed to as-sess the short-term effects of DMP implementa-tion on the outcomes of patients with IS. Briefly, the DMP was implemented in patients with stroke in two hospitals in Shanghai. The effect of DMP on the outcome of IS patients was analyzed according to the criteria of the National Institute of Health Stroke Scale (NIHSS). Additionally, the average length of stay, hospitalization cost, and cost-effectiveness of IS patients under the im-plementation of DMP were analyzed.
Materials and Methods
Study Population
This is a prospective and observational study. During Aug 1, 2007, to Jul 31, 2010, the IS pa-tients in Hospital T (a teaching hospital) and Hospital R (a regional hospital) were recruited in our study according to the following inclusion criteria: (1) ≥ 18 yr old; (2) received a final diag-nosis of IS within two weeks after their stroke. Patients were excluded if they (1) had no neuro-logical functional deficit (i.e. National Institutes of Health Stroke Scale (NIHSS) score = 0); (2) were transferred from another hospital; (3) were refractory to repeated outpatient treatments; (4) were re-hospitalized within 30 d from a previous discharge, or had neurological deficits from a previous stroke.
The study was approved by Shanghai General Hospital Ethics Committee and performed in accordance with the ethical standards.
Implementation of DMP
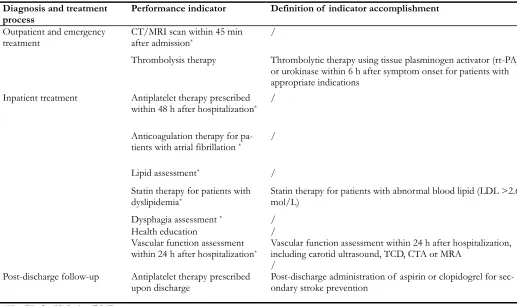
There were four parts of performance indicators (PIs) in the DMP issued by Chinese Hospital As-sociation, including outpatient, emergency de-partment, inpatient, and follow-up treatments (Table 1). In this study, seven core measurements in DMP were designated as key PIs for IS pa-tients according to evidence-based medicine and actual treatment process, including computed tomography (CT)/ magnetic resonance imaging (MRI) scan within 45 min after admission, an-tiplatelet therapy prescribed within 48 h after hospitalization, anticoagulation therapy for pa-tients with atrial fibrillation, lipid assessment, statin therapy for patients with dyslipidemia, dys-phagia assessment, and vascular function assess-ment within 24 h after hospitalization. The moni-toring and evaluation of PIs were achieved by their physicians. The patients who accomplished all the seven measurements were assigned to DMP group, while the patients failing to receive one or more of the core measurements were clas-sified to non-DMP group.
Outcome, Average Length of Stay, Cost and Cost-effective Assessment
decreasing > 17%, and ineffective management was defined as NIHSS score decreasing ≤ 17%. The effective rate of DMP referred to total effec-tive number corresponding to total number of patients (total effective number/ total number of patients), taken as the effectiveness indicator.
In addition, the average length of stay was calcu-lated. The hospitalization cost was taken as the cost indicator.
Table 1: Performance indicators (PIs) for ischemic stroke (IS) during disease management program (DMP)
Diagnosis and treatment
process Performance indicator Definition of indicator accomplishment
Outpatient and emergency
treatment CT/MRI scan within 45 min after admission* /
Thrombolysis therapy Thrombolytic therapy using tissue plasminogen activator (rt-PA)
or urokinase within 6 h after symptom onset for patients with appropriate indications
Inpatient treatment Antiplatelet therapy prescribed
within 48 h after hospitalization* /
Anticoagulation therapy for
pa-tients with atrial fibrillation * /
Lipid assessment* /
Statin therapy for patients with
dyslipidemia*
Statin therapy for patients with abnormal blood lipid (LDL >2.6 mol/L)
Dysphagia assessment * /
Health education /
Vascular function assessment
within 24 h after hospitalization*
Vascular function assessment within 24 h after hospitalization, including carotid ultrasound, TCD, CTA or MRA
/
Post-discharge follow-up Antiplatelet therapy prescribed
upon discharge Post-discharge administration of aspirin or clopidogrel for sec-ondary stroke prevention
*Key PIs for IS during DMP.
CT: computed tomography; MRI: magnetic resonance imaging; LDL: Low-density lipoprotein; TCD: transcranial ultrasound; CTA: computed tomography angiography; MRA: magnetic resonance angiography
A cost-effective analysis for DMP implementa-tion was carried out by using the Bootstrap method according to the previous description (12, 13). The ratio of cost to one percent incre-ments of the effective rate (cost/ one percent increments of the effective rate) was calculated as cost-effectiveness ratio (CER). Additionally, Bootstrap method (14) was also used to analyze the distribution of incremental cost-effectiveness ratios (ICERs) (ΔC/ΔE).
Statistical Analysis
All the statistical analyses were performed using the SPSS 17.0 software (Chicago, IL, US). The t-test or rank-sum t-test was used to compare mean (normally distributed) or median (not normally distributed) between different groups respective-ly. The χ2 test and Mantel-Haenszel test were
Results
Baseline Data in DMP Group and non-DMP Group
Total 249 and 469 cases in Hospital T were re-spectively assigned to DMP Group and non-DMP Group, while in Hospital R, 128 and 343 cases were assigned to DMP Group and
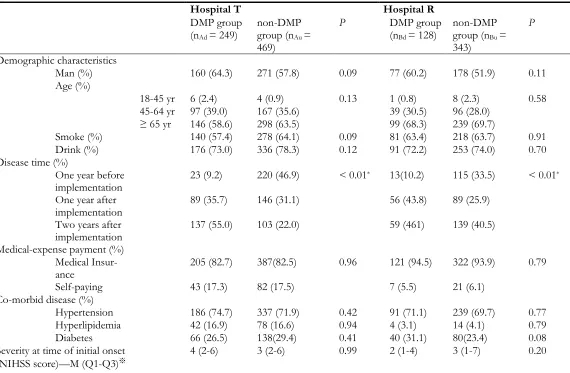
non-DMP Group respectively. The response rate in this study was 100%. In addition, no statistical difference was found on demographic character-istics, medical-expense payment, co-morbid dis-ease or severity at time of initial onset, while statistical difference was found on time of disease onset between DMP group and non-DMP group in Hospital T and Hospital R (Table 2).
Table 2: Baseline data in DMP group and non-DMP group
Hospital T Hospital R
DMP group (nAd = 249)
non-DMP group (nAu =
469)
P DMP group (nBd = 128)
non-DMP group (nBu =
343)
P
Demographic characteristics
Man (%) 160 (64.3) 271 (57.8) 0.09 77 (60.2) 178 (51.9) 0.11 Age (%)
18-45 yr 6 (2.4) 4 (0.9) 0.13 1 (0.8) 8 (2.3) 0.58 45-64 yr 97 (39.0) 167 (35.6) 39 (30.5) 96 (28.0)
≥ 65 yr 146 (58.6) 298 (63.5) 99 (68.3) 239 (69.7)
Smoke (%) 140 (57.4) 278 (64.1) 0.09 81 (63.4) 218 (63.7) 0.91 Drink (%) 176 (73.0) 336 (78.3) 0.12 91 (72.2) 253 (74.0) 0.70 Disease time (%)
One year before
implementation 23 (9.2) 220 (46.9) < 0.01
* 13(10.2) 115 (33.5) < 0.01*
One year after
implementation 89 (35.7) 146 (31.1) 56 (43.8) 89 (25.9) Two years after
implementation 137 (55.0) 103 (22.0) 59 (461) 139 (40.5) Medical-expense payment (%)
Medical
Insur-ance 205 (82.7) 387(82.5) 0.96 121 (94.5) 322 (93.9) 0.79 Self-paying 43 (17.3) 82 (17.5) 7 (5.5) 21 (6.1)
Co-morbid disease (%)
Hypertension 186 (74.7) 337 (71.9) 0.42 91 (71.1) 239 (69.7) 0.77 Hyperlipidemia 42 (16.9) 78 (16.6) 0.94 4 (3.1) 14 (4.1) 0.79 Diabetes 66 (26.5) 138(29.4) 0.41 40 (31.1) 80(23.4) 0.08 Severity at time of initial onset
(NIHSS score)—M (Q1-Q3)※ 4 (2-6) 3 (2-6) 0.99 2 (1-4) 3 (1-7) 0.20
※Rank sum test (S) between severity at time of initial onset at Hospital T and Hospital R (because the original data were measurement data which
did not conform to the normal distribution) DMP: Disease Management Program *P < 0.05
Implementation of PIs in DMP for IS
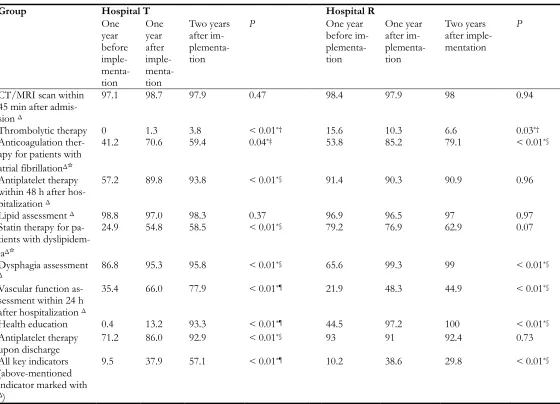
As shown in Table 3, accomplishment rates of the PIs in DMP for IS patients were significantly increased two years after the DMP implementa-tion in both hospitals (P<0.01). Of all PIs, the
with-in 45 mwith-in after admission and lipid assessment, there was no significant difference among three groups in both hospitals. Furthermore, the ac-complishment rates of other PIs increased year
by year in Hospital T while those were increased at the first year and stayed at the same rate in the second year in Hospital R.
Table 3: Accomplishing rate (%) of the performance indicators before and after implementation of disease man-agement program (DMP) for ischemic stroke (IS)
Group Hospital T Hospital R
One year before imple- menta-tion
One year after imple- menta-tion
Two years after im- plementa-tion
P One year
before im- plementa-tion
One year after im- plementa-tion
Two years after imple-mentation
P
CT/MRI scan within 45 min after admis-sion Δ
97.1 98.7 97.9 0.47 98.4 97.9 98 0.94
Thrombolytic therapy 0 1.3 3.8 < 0.01*† 15.6 10.3 6.6 0.03*†
Anticoagulation ther-apy for patients with atrial fibrillationΔ☆
41.2 70.6 59.4 0.04*‡ 53.8 85.2 79.1 < 0.01*§
Antiplatelet therapy within 48 h after hos-pitalization Δ
57.2 89.8 93.8 < 0.01*§ 91.4 90.3 90.9 0.96
Lipid assessment Δ 98.8 97.0 98.3 0.37 96.9 96.5 97 0.97
Statin therapy for pa-tients with dyslipidem-iaΔ☆
24.9 54.8 58.5 < 0.01*§ 79.2 76.9 62.9 0.07
Dysphagia assessment
Δ 86.8 95.3 95.8 < 0.01
*§ 65.6 99.3 99 < 0.01*§
Vascular function as-sessment within 24 h after hospitalization Δ
35.4 66.0 77.9 < 0.01*¶ 21.9 48.3 44.9 < 0.01*§
Health education 0.4 13.2 93.3 < 0.01*¶ 44.5 97.2 100 < 0.01*§
Antiplatelet therapy
upon discharge 71.2 86.0 92.9 < 0.01
*§ 93 91 92.4 0.73
All key indicators (above-mentioned indicator marked with
Δ)
9.5 37.9 57.1 < 0.01*¶ 10.2 38.6 29.8 < 0.01*§
*† represent accomplishing rate comparison among three groups. Significant difference was found between one year before
im-plementation and two years after imim-plementation.
*‡ represent accomplishing rate comparison among three groups. Significant difference was found between one year before
im-plementation and one year after imim-plementation.
*§ represent accomplishing rate comparison among three groups. Significant difference was found between one year before im-plementation and one year after imim-plementation as well as between one and two years after imim-plementation.
*¶ represent accomplishing rate comparison among three groups. Significant difference was found between any two groups.
Δ☆for anticoagulation therapy indicator, the denominator is patients with atrial fibrillation; for statin therapy indicator, the
de-nominator is patients with dyslipidemia.
Δ = key performance indicator.
Comparison of Outcome Improvement be-tween DMP Group and non-DMP Group
The total effective rates of DMP and non-DMP were 69.9% and 60.8%, respectively in Hospital T. In Hospital R, the total effective rates were 76.6% and 62.7% for DMP and non-DMP group. Significant differences were found be-tween DMP and non-DMP group in both hospi-tals (PT=0.018, PR=0.004).
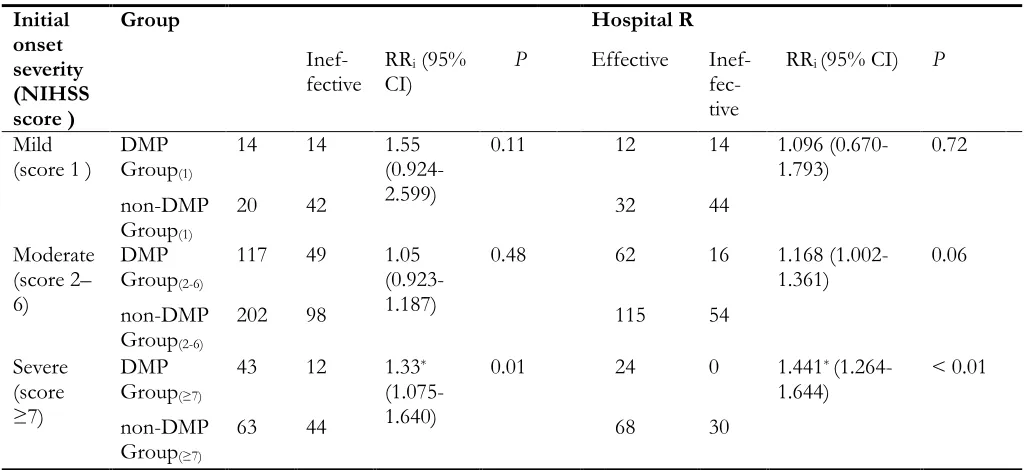
The NIHSS scores at initial onset of IS were used as the stratification factor to compare the
out-come between DMP and non-DMP group in two hospitals (Table 4). Estimated values of inter-group combined relative risk (RR) between DMP and non-DMP in Hospital T and Hospital R was 1.27 and 1.38, respectively. Significant difference on RR was found between DMP and non-DMP. For the patients with NIHSS score ≥ 7 (most severe), significant outcome improvement was observed in DMP group than that in non-DMP group (PT=0.01, PR<0.01).
Table 4: Outcome comparison between disease management program (DMP) group and non-DMP group in the hospital using initial onset symptom severity as stratification factor
Initial onset severity (NIHSS score )
Group Hospital R
Inef-fective RRCI) i (95% P Effective Inef- fec-tive
RRi (95% CI) P
Mild
(score 1 ) DMP Group(1)
14 14 1.55 (0.924-2.599)
0.11 12 14 1.096
(0.670-1.793) 0.72 non-DMP
Group(1)
20 42 32 44
Moderate (score 2– 6)
DMP Group(2-6)
117 49 1.05 (0.923-1.187)
0.48 62 16 1.168
(1.002-1.361) 0.06 non-DMP
Group(2-6)
202 98 115 54
Severe (score ≥7)
DMP Group(≥7)
43 12 1.33*
(1.075-1.640)
0.01 24 0 1.441*
(1.264-1.644) < 0.01 non-DMP
Group(≥7)
63 44 68 30
* Significant difference was found between DMP and non-DMP group; RR: risk ratio. Effective management = Decrease NIHSS score by 17% to 100%.
Ineffective management = Decrease NIHSS score at least than 17% or worse
Comparison of Average Length of Stay be-tween DMP Group and non-DMP Group
A trend test was performed between the average length of stay and DMP implementation in Hos-pital T and R and a linear correlation was found. Decrease in the average length of stay was found in Hospital T and R with the progression of the DMP implementation. A significant difference was found in the average length of stay between
Table 5: Average length of stay with different implementation progress in Hospital T and Hospital R
Hospital T Hospital R
Average length of stay *
DMP Group (Days)
non-DMP Group (Days)
P Average length of stay * (Days)
DMP Group (Days)
non-DMP Group(Day s)
P
(Days) One year before
implementation (n1 = 371)
21 16.5 21.5 0.007 21.9 19.2 22.5 0.26 1
One-year imple-mentation (n2 =
380)
16.4 17 16.7 0.404 20 19.2 20.9 0.29 6
Two-year imple-mentation (n3 =
438)
15.6 16.6 16.3 0.168 17.9 17.8 18.2 0.71 6
*Trend test between the average length of stay at Hospital T and Hospital R and implementation progress (P <
0.0001); DMP: disease management program.
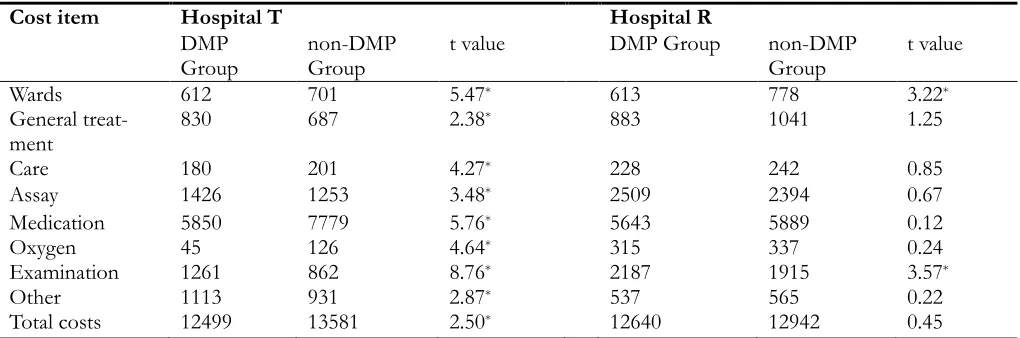
Comparison of Hospitalization Cost between DMP Group and non-DMP Group
The costs of the medical procedures (except for B mode ultrasound) and treatment, and the costs of hospital stay remained essentially unchanged during the study period. The cost incurred was not corrected because the changes in consumer
prices index (CPI) were negligible. The hospitali-zation cost in DMP group was significantly lower than that in non-DMP group in Hospital T (P=0.013) while no significant difference was found in DMP and non-DMP group in Hospital R (Table 6).
Table 6: Hospitalization cost before and after implementation of disease management program (DMP) for ischemic stroke (IS) (in CNY)
Cost item Hospital T Hospital R
DMP
Group non-DMP Group t value DMP Group non-DMP Group t value
Wards 612 701 5.47* 613 778 3.22*
General
treat-ment 830 687 2.38
* 883 1041 1.25
Care 180 201 4.27* 228 242 0.85
Assay 1426 1253 3.48* 2509 2394 0.67
Medication 5850 7779 5.76* 5643 5889 0.12
Oxygen 45 126 4.64* 315 337 0.24
Examination 1261 862 8.76* 2187 1915 3.57*
Other 1113 931 2.87* 537 565 0.22
Total costs 12499 13581 2.50* 12640 12942 0.45
*P < 0.05; CNY: Chinese Yuan
Cost-effectiveness Analysis between DMP Group and non-DMP Group
In Hospital T, the CER in DMP and non-DMP group were respectively 178.8 and 223.4, and a
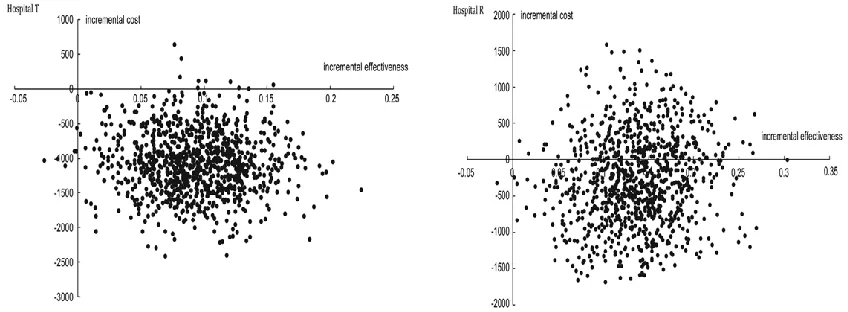
In addition, a bootstrap map of ICERs for the DMP implementation in IS patients in both hos-pitals was constructed. ICERs was -118.9 for Hospital T, and 98.5% of scattered dots of ICERs were located in the fourth quadrant (Fig. 1). Compared with non-DMP Group, a
decreas-ing on the hospitalization cost and an increasdecreas-ing on effective rate were found in DMP Group of hospital T. In Hospital R, ICERs was -21.7, and 31.5% of the scattered dots of ICERs were locat-ed in the first quadrant while 68.4% in the fourth quadrant.
Fig. 1: Bootstrap figure of incremental cost-effectiveness ratio (ICER) for disease management program (DMP) group and non-DMP group in Hospital T and Hospital R
Discussion
DMP has been implemented in several countries and diseases (7, 15-17), and achieved the optimal disease management. Since 2007, Chinese Minis-try of Health has implemented the DMP for IS patients in teaching and regional hospitals (18). In the present study, the implementation of DMP significantly improved the prognosis and out-come of IS patients, as well as decreased the total cost.
After DMP implementation for IS in two hospi-tals, the accomplishment rates of the key IPs were improved. However, the improvement was not consistent between two hospitals. The differ-ence may be attributed to the inappropriate usage of thrombolytic drugs beyond the qualifying indi-cations. After implementation of DMP for IS patients, the thrombolytic indications were more strictly followed, and the accomplishment rate of thrombolysis was decreased. Therefore, the im-plementation of DMP may make the diagnosis and treatment more scientific and consistent. The measures to expedite clot lysis and restore
circu-lation may decline the extent of brain injury and improve outcome after stroke (19). According to the requirement of DMP, thrombolysis should be performed within 4.5 h after the onset of stroke (20). Therefore, the improvement of the accom-plishment rates of IPs including thrombolysis may finally improve the outcome of IS. Dart-mouth-Hitchcock Medical Center has imple-mented standardized treatment of IS since 2004, and the average accomplishment rate of the sev-en key PIs in 2009 was 92.6% (21) which was higher than that in two hospitals of our study. Therefore, more efforts are still needed to further develop DMP for IS in China.
hospitals. Additionally, the patient education program, belonging to DMP, is successful in im-proving health status, and decreasing rates of hospitalization (23). The patient education pro-gram can provide patients with necessary knowledge and confidence (self-efficacy) to deal with disease-related problems (24). Systematic screening, another aspect of the DMP, has also been found to increase the proportion of patients receiving appropriate treatment compared to usual care (25).
The goal of DMP is to improve health outcomes and simultaneously reduce healthcare cost (26). In our study, hospitalization cost in DMP group was significantly lower than that in non-DMP group, which may be partly due to the optimiza-tion of the average length of stay (22). Moreover, ICER analysis indicated that both hospitalization cost and therapeutic benefits were better con-trolled in DMP group than that in non-DMP group in Hospital T. In Hospital R, the therapeu-tic benefits were better controlled while the hos-pitalization cost for most patients was reduced, which suggested that the implementation of DMP extended an economic efficiency because the improvement on therapeutic effectiveness did not increase the hospitalization cost for most of patients.
However, there are several potential limitations in our study. On one hand, some medical records data on outpatient and emergency treatment costs were not detailed during hospitalization. On the other hand, the long-term therapeutic out-come of DMP implementation for IS was not studied in the present study, but it will be investi-gated in the near future.
Conclusion
The implementation of DMP for IS can obvious-ly improve the standard use of thromboobvious-lytic drugs, effectively improve the treatment out-come, and decrease the average length of stay and the hospitalization cost. Taken together, DMP will have a wide application prospect and will give some hints to policymakers.
Ethical considerations
Ethical issues (Including plagiarism, informed consent, misconduct, data fabrication and/or fal-sification, double publication and/or submission, redundancy, etc.) have been completely observed by the authors.
Acknowledgements
This research was supported by Natural Science Foundation of China (NSFC) key program (71432007).
Conflict of interest
The authors declare that there is no conflict of interest.
References
1. Murray CJ, Lopez AD (2013). Measuring the global burden of disease. N Engl J Med, 369 (5): 448-57.
2. Jia Q, Liu LP, Wang YJ (2010). Stroke in China.
Clin Exp Pharmacol Physiol, 37 (2): 259-64.
3. Lloyd-Jones D, Adams RJ, Brown TM, et al (2010). Heart disease and stroke statistics— 2010 update A report from the American Heart Association. Circulation, 121(7): e46-e215. 4. Ontario HQ (2012). Specialized community-based care: an evidence-based analysis. Ont Health
Technol Assess Ser, 12 (20): 1-60.
5. Sidorov J, Shull R, Tomcavage J et al (2002). Does diabetes disease management save money and improve outcomes? A report of simultaneous short-term savings and quality improvement associated with a health maintenance organization–sponsored disease management program among patients fulfilling health employer data and information set criteria.
Diabetes Care, 25 (4): 684-689.
6. Joshi MS, Bernard DB (1999). Clinical performance improvement series. Classic CQI integrated with comprehensive disease management as a model for performance improvement. Jt Comm J Qual Improv, 25 (8): 383-95.
effective in improving quality of care for people with chronic conditions? http://www.euro.who.int/__data/assets/pdf_ file/0020/74720/E82974.pdf
8. Krumholz HM, Amatruda J, Smith GL et al (2002). Randomized trial of an education and support intervention to preventreadmission of patients with heart failure. J Am Coll Cardiol, 39 (1): 83-89.
9. LaBresh KA, Reeves MJ, Frankel MR, Albright D, Schwamm LH (2008). Hospital treatment of patients with ischemic stroke or transient ischemic attack using the “Get With The Guidelines” program. Arch Intern Med, 168 (4): 411-17.
10. Lyden PD, Lu M, Levine SR et al (2001). A modified national institutes of health stroke scale for use in stroke clinical trials preliminary reliability and validity. Stroke, 32 (6): 1310-1317. 11. Adams H, Adams R, Del Zoppo G et al (2005).
Guidelines for the Early Management of Patients With Ischemic Stroke 2005 Guidelines Update A Scientific Statement From the Stroke Council of the American Heart Association/American Stroke Association.
Stroke, 36 (4): 916-923.
12. Gandjour A (2010). A model to predict the cost-effectiveness of disease management programs. Health Econ, 19 (6): 697-715.
13. Doan QV, Gillard P, Brashear A et al (2013). Cost-effectiveness of onabotulinumtoxinA for the treatment of wrist and hand disability due to upper-limb post-stroke spasticity in Scotland. Eur J Neurol, 20 (5): 773-780.
14. Hollenbeak CS, Boltz MM, Wang L et al (2011). Cost-effectiveness of the National Surgical Quality Improvement Program. Ann Surg, 254 (4): 619-624.
15. Gravely S, Reid RD, Oh P et al (2012). A prospective examination of disease management program use by complex cardiac outpatients. Can J Cardiol, 28 (4): 490-496. 16. Schafer I, Kuver C, Gedrose B et al (2010). The
disease management program for type 2 diabetes in Germany enhances process quality of diabetes care - a follow-up survey of patient's experiences. BMC Health Serv Res, 10: 55.
17. Jaarsma T, van der Wal MH, Lesman-Leegte I, et al (2008). Effect of moderate or intensive disease management program on outcome in patients with heart failure: Coordinating Study Evaluating Outcomes of Advising and Counseling in Heart Failure (COACH). Arch
Intern Med, 168 (3): 316-324.
18. Kong L, Hu S (2005). Report on cardiovascular disease in China. Beijing: Encyclopedia of China
Publishing House, pp.: 86-88.
19. Adams HP, Brott TG, Furlan AJ, et al (1996). Guidelines for thrombolytic therapy for acute stroke: a supplement to the guidelines for the management of patients with acute ischemic stroke a statement for healthcare professionals from a special writing group of the stroke council, American heart association.
Stroke, 27(9):1711-8.
20. Gladstone DJ, Rodan LH, Sahlas DJ, et al (2009). A citywide prehospital protocol increases access to stroke thrombolysis in Toronto.
Stroke, 40 (12): 3841-4.
21. Dartmouth-Hitchcock Medical Center (2010).
http://med.dartmouth-hitchcock.org/documents/surgery_report_201 0.pdf
22. Knox D, Mischke L (1999). Implementing a congestive heart failure disease management program to decrease length of stay and cost. J
Cardiovasc Nurs, 14 (1): 55-74.
23. Lorig KR, Sobel DS, Stewart AL, et al (1999). Evidence suggesting that a chronic disease self-management program can improve health status while reducing hospitalization: a randomized trial. Med Care, 37 (1): 5-14. 24. Lorig KR, Sobel DS, Ritter PL et al (2001). Effect
of a self-management program on patients with chronic disease. Eff Clin Pract, 4 (6): 256-262.
25. Badamgarav E, Weingarten SR, Henning JM et al (2003). Effectiveness of disease management programs in depression: a systematic review.
Am J Psychiatry, 160 (12): 2080-2090.