ORIGINAL ARTICLE DOI 10.1007/s10086-004-0652-0
Y. Midorikawa · M. Fujita (*)
Division of Forest and Biomaterials Science, Graduate School of Agriculture, Kyoto University, Kitashirakawa-Oiwake-cho, Sakyo-ku, Kyoto 606-8502, Japan
Tel. 81-75-753-6238; Fax 81-75-753-6302 e-mail: kzfujita@kais.kyoto-u.ac.jp Yoko Midorikawa · Minoru Fujita
Transverse shape analysis of xylem ground tissues by Fourier transform
image analysis II: cell wall directions and reconstruction of cell shapes
Received: November 26, 2003 / Accepted: May 26, 2004
although there are various wood cells. Each represents an important characteristic of the wood. Until now the shapes of these cells, however, were not measured precisely. Fujita et al.1
developed the Fourier transform image analysis (FTIA) procedure, consisting of a pre-fast Fourier trans-form (FFT), which clarifies the shape factor by the dot – map and net – map methods, the autocorrelation function from the power spectrum pattern (PSP),2
and the process of post-FFT, such as polar coordinate analysis. Then they3
detected the cell arrangement and measured the direction of cell walls (cell sides) according to the process, and tried to reconstruct the most frequent (abundant) cell shape from the PSP maximum power.2
The accuracy and verification of analysis are unknown. The controlling process of ordinary accumulation image analysis (OAIA) was examined4
to prevent various errors and quantitative analysis in FTIA was introduced for highly precise quantitative evaluation.5
We precisely examined cell arrangements of Agathis sp.,
Cryptomeria japonica, and Magnolia obovata, and
deter-mined the grade of fluctuation of it under this process.6 Dot models and block models were restructured as part of the process. In this report, the most frequent angle of the cell walls (cell sides) was acquired and reconstruction of the cell shapes in transverse sections was performed using the same sample images. The grade of fluctuation was also examined and both data from FTIA and OAIA in Agathis were com-pared in detail.
A number of terms are not defined in this report because of their definition in previous reports.4–6
Terms specifically defined in this article are shown in Table 1.
Materials and methods
Specimens and picture sampling
Agathis, Cryptomeria, and Magnolia were analyzed
accord-ing to our previous report.6
The same sections and input methods6
were used in the present study except that micro-scopic magnification was higher (10). Pictures of Agathis Abstract Cell wall directions of tracheids in transverse
sec-tions of Agathis sp. and Cryptomeria japonica and fiber bodies in Magnolia obovata were quantified by Fourier transform image analysis (FTIA). Three kinds of informa-tion about cell shapes were determined from the angular distribution functions of the net map-power spectrum pat-tern (NM-PSP): (1) the peak angle expresses the most fre-quent cell wall direction, (2) the area of the peak is indicative of cell wall length, and (3) the dispersion of the peak indicates the fluctuation of cell wall orientation. Fluc-tuations were expressed as the standard deviation (σ) by the use of statistical analysis. Cell wall directions in Agathis, that is, directions of the tangential and radial walls (three orientations were detected) were 0° (σ 7°), 59° (12°), 91° (9°), and 122° (12°), respectively. Pentagonal and hexagonal models were reconstructed as cell shape models in a calcu-lated ratio of 60 : 40. On the other hand, directions were 0° (5°), 76° (12°), 89° (5°), and 102° (12°) in a calculated ratio of 45 : 55 in Cryptomeria. Fiber bodies were extracted in
Magnolia and their wall directions were 0° (5°), 50° (7°), 90°
(6°), and 131° (7°), respectively. The ordinary accumulated image analysis (OAIA) was checked at the same time in
Agathis, and indicated that FTIA could be used as a method
of reconstruction of cell shape.
Key words Tracheid shape · Fiber shape · Fourier trans-form · Cell wall directions · Cell shapes
Introduction
1.39µm, with an input area of 1.42 1.42 mm. There were about 35 tracheids along the radial direction, and mainly contained an earlywood zone and a small area of the late-wood zone in Agathis. Latelate-wood-like zones were observed repeatedly, although Agathis is one of the tropical trees. One thousand tracheids were sampled at a time. There were about 20–25 tracheids along the radial direction and the total number of cells was about 700 in Cryptomeria. They consisted of almost all earlywood cells. Magnolia was input to Luzex III through a film scanner Polascan 4000 (Poraroid, 1280 dpi) and image processing software, Photoshop.v.5.0J with a pixel width of 0.83µm (sample area 0.85 0.85 mm). On the other hand, for the OAIA examina-tion of Agathis secexamina-tions, only the earlywood area was se-lected and input under the same conditions as Magnolia.
Extractions of the structure element and shape factor, and their PSP analysis
A transverse image of Agathis was transferred to a binary image as a wall map (WM)4
(Fig. 1a), and simplified to a net map (NM)4
(Fig. 1b) after removal of rays according to previous reports.2–4 The same treatments were performed for Cryptomeria. Furthermore, the NM was divided into fragment maps (FM)4
of tangential walls (Fig. 2a) and of radial walls (Fig. 2c) by cutting off at the corner map (CM)4
in order to measure the length and direction of cell sides by OAIA. A selective net map (sNM) (Fig. 1e) was created for
Magnolia (Fig. 1d) as previously described6
for extraction of only the body part of the wood fibers.
These maps were transformed to the PSPs by FFT pro-cessing (Fig. 1c,f). These PSPs were used for the polar coor-dinate analysis as programmed by Maekawa et al.2,3
and angular distribution functions were obtained (Figs. 3, 4, 5a).
Results and discussion
Overall information of NM-PSP
Structure elements on a NM are cell sides and they contain three types of shape factors, that is, length, direction, and arrangement. When NM-PSP of Agathis and Cryptomeria
Fig. 1a–f. General procedure of Fourier transform image analysis (FTIA) for direction analysis. a Wall map (WM), b net map (NM), c power spectrum pattern (PSP) of b in case of Agathis sp. d WM, e selective NM (sNM), called a body-NM, and f PSP of e in case of Magnolia obovata. Note that NM-PSP (c) provides spreading power from the origin to the high-frequency bandwidth in a star-like fashion in eight directions in Agathis. On the other hand, sNM-PSP (f) shows that the power is distributed in a circular fashion and some spots are discerned on the circle (arrowheads) and further spots exist on the higher frequency power ring (arrows) in Magnolia
256, hBW : 257 k 512). These power radiations in-form us of the length (l) and direction (θ) of the wall sides (Fig. 1c). On the other hand, eight spots are observed along a ring in the mBW on the PSP of Magnolia sNM (Fig. 1f). The ring corresponds to the paired lines of five-pixel width and spots on the ring originate from the wall direction (θ). Concentration and diffusion of the power were calcu-lated more quantitatively, that is, PkhBW (f) in Agathis and
Cryptomeria, and PkmBW–hBW (f) in Magnolia (Figs. 3, 4, 5a),
in order to examine only cell side lengths and directions without arrangements.
Here, we note that three kinds of keys relating to cell shape are expressed on the peaks of P(f). Namely, key 1 is fmax. It shows the most frequent direction (θmax) of the cell
wall, i.e., θmax fmax 90°. Key 2 is the peak area. It has a
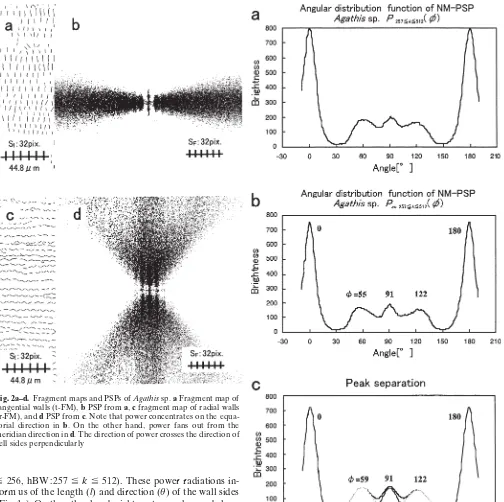
proportional relation to the integrated length of each cell wall, although the proportionality coefficient is not known. Because a cell side that has a one-pixel width is treated as a Fig. 2a–d. Fragment maps and PSPs of Agathis sp. a Fragment map of tangential walls (t-FM), b PSP from a, c fragment map of radial walls (r-FM), and d PSP from c. Note that power concentrates on the equa-torial direction in b. On the other hand, power fans out from the meridian direction in d. The direction of power crosses the direction of cell sides perpendicularly
Fig. 3a–c. The NM-PSP analysis of Agathis sp. a Raw angular distribu-tion funcdistribu-tion, b angular distribudistribu-tion funcdistribu-tion after angle compensadistribu-tion, and c angular distribution after peak separation composed of five Gaussian peaks. Compensation was done by using the test patterns similar to the structure element of NM (b). It was used in fluctuation analysis because c consisted of normal distribution curves. R (correla-tion coefficient) 0.997
Experimental conditions for transverse shape analysis
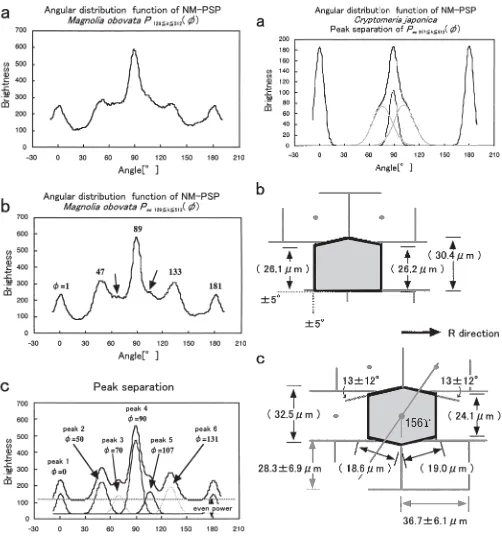
The FTIA enables us to pull out certain features from am-biguous structures when many samples are prepared. We tried to input as many tracheids as possible in order to enhance the reliability of the angular distribution function. Fig. 4a–c. The NM-PSP analysis of Magnolia obovata. a Raw angular
distribution function, b angular distribution function after angle com-pensation, and c peak separation composed of five Gaussian peaks. Compensation was done by using the test patterns similar to the struc-ture element of NM (b). Even power indicates that there are many cell sides not identified in c. R 0.978
156
°
For this purpose, lower magnification of picture sampling is desirable within the optical resolution RO and discrete
reso-lution RD. 4
A wider sampling area sometimes contains un-desirable heterogeneous parts. Therefore, in this report, we decided not to make the observations under such low magnification and repeated the samplings mainly from the homogeneous earlywood zone. As the PSP from each NM is very weak, low power is omitted by digitally processing of the gray levels. This problem was overcome5
by overlapping different NMs from several areas, although some convolu-tion techniques were introduced.6
The overlapped NM image will generally become very complicated. This procedure, however, is expected not to bring serious influences, being based on the Fourier transform theory, in which phase information of the spatial domain is eliminated in the power spectrum. Fujita et al.7
verified this character-istic by the method of optical Fourier transform, and re-ported that overlapped sections also generated the original periodicity in diffraction. This characteristic was also applied to electron diffraction of cellulose crystals.8
Midorikawa and Fujita9
cut off maps of only the earlywood zone of softwood into long and slender strips along the tangential direction and overlapped them. Then they dem-onstrated that they could increase the number of tracheids, holding the uniformity of a sample. The negative influence of overlapping (Eol, overlapping error) must be estimated
beforehand.
This error must originate from the overlapped points between cell sides on two NM sheets (NM1 and NM2),
be-cause these points having two times the contrast are again transferred to binary data. When the ratio of lines are m1
and m2 on NM1 and NM2, the probability of overlapping is
m1 m2, namely m 2
in the homogeneous NMs. The line position is only a few percent in the area on each NM. The overlapping probability of over two sheets, that is, mover2
becomes negligible when this theory is expanded to numer-ous sheets (NMn) and the line ratio m is under 0.1. The error
ratio of overlapping (ERol(123 ... n) ERoln) is determined
by the following formula.
ERoln
(
n 1)
m 2 (1)The curves of ERol in the case of m 0.01, 0.05, and 0.1 are
shown in Fig. 6. In this report, m was about 0.05. The error ratio does not exceed 0.1 even if five sampling images are overlapped.
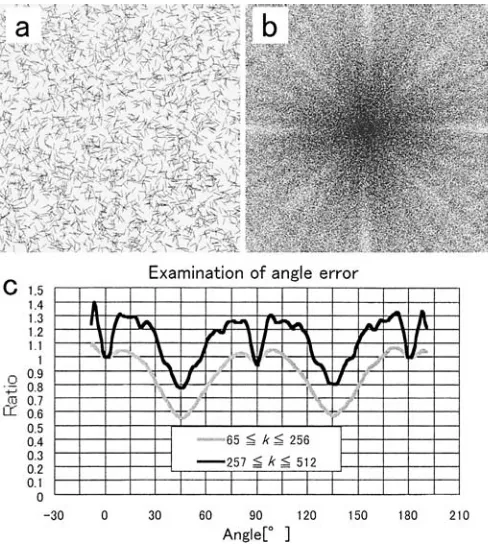
The most severe problem in cell shape analysis is the angular error that is caused by oblique lines.5
Power is un-derestimated by around 50% at oblique directions, which is unavoidable in the present FFT systems. The degree of underestimation of powers was detected by using test pat-terns similar to cell side fragments that are the structure element of NM in order to minimize the negative influence. This modified angular distribution function that performed angle compensation was written as Pac(f). One thousand
line segments with 1-pixel width and 30-pixel length were spread randomly on a screen as the test (Fig. 7a). These segments can be treated as a σ function.4,5
From the PSP of this map (Fig. 7b), angular distribution functions were
ob-tained from the same frequency bandwidth as that of the real NM-PSP. This operation was repeated 50 times (a total of 50 000 lines). We compensated the original angular distri-bution function P(f) to the modified function Pac(f) using
the curve (Fig. 7c). Because the PSP outputted power with point symmetry, the 0 f 180° display was sufficient Fig. 6. Examination of error ratio caused by overlapping (ERol). In the case of Agathis sp. that has an area ratio of about 0.05, five maps can be overlapped at less than 0.1 error ratio
struction. The tracheid arrangement models (block models) that were previously proposed6
were used as the base of reconstruction here and we added the information of cell wall directions (θ) to them by the fmax. The FM and FM-PSP
of Agathis are shown in Fig. 2 and demonstrate the relation between cell wall direction (θ) and power direction (θ). When FM is compared with FM-PSP, power is concentrated on the direction (f) (Fig. 2b,d) perpendicular to the direc-tion of cell sides (θ) (Fig. 2a,c). It is clear that NM-PSP (Fig. 1c) consists of t-FM-PSP (Fig. 2b) and also r-FM-PSP (Fig. 2d). Here, it must be remembered that the radial direction was set by the horizontal direction of the screen (θ 0°) and fθ 90° in the frequency domain (Fig. 2b,d).
Tangential walls were set around θ 90° in the picture sampling. It is clear that sharp peaks at f 0°, 180° are generated from tangential walls shown in Fig. 3. On the contrary, as for radial walls, six radiations were observed (Fig. 1c) and three peaks at 59°, 91°, and 122°, and their point symmetric peaks could also be identified (Fig. 3c). Direct interpretation of this NN-PSP is an octagonal cell shape. Such cells are rare on the actual transverse section, so we can conclude pentagonal cells in the shape of a house composed of two walls (tangential walls), one flat floor (rf)
corresponding to f 91° (Fig. 3c), and two oblique roofs of
f 59° (r2) and 122° (r1) (Fig. 8a). The same method was
used in the case of Cryptomeria. The data are shown in Table 2.
The floor is not of a strict geometry but contains various cases. At the tracheid tips, radial walls are often flat and their tangential walls are very short. Transverse cell shapes are a slender rectangle. We omit such cases in the discussion because of their rare occurrence. Tracheids neighboring rays have a straight radial wall, and result in the house-like shape. When radial files are in contact with each other, many tracheids have a typical roof shape, composed of two sides. The two sides, however, were often uneven in length and the longer ones became flat (Fig. 8b). Moreover, the included angles between the two radial walls are often very large, near 180°, even if they have similar length. When the main peak at around 90° in Cryptomeria was separated into two peaks, the distance between them was only 4° (Fig. 5a). Although such evaluations will be reported in a following report, the large peak was calculated as one floor having some angular fluctuations in this report. We therefore
cat-egorized them to the house model. The house model was reconstructed by the rotation of r1 and r2 of the block model
around the middle point of each roof side and stopped in the position at 59° and 122°. Each side is elongated to the crossing points of rotated sides. The hexagonal cell shapes are also abundant in the original picture judging from the peak area ratio between r1 and r2 and rf, resulting in the
figure consisting of every two-faced cell wall as a whole.
159
°
Pac(f) of Magnolia (Fig. 4) was quite different from that
of Agathis (Fig. 3) and Cryptomeria (Fig. 5a) when it was observed. Four peaks are very sharp in the range 0° f 180°, and small shoulders are also discernable around 75° and 105° (arrows in Fig. 4b). Then, it was separated into six peaks (peaks 1–6 in Fig. 4c and Table 2) using Sigma Plot, suggesting a dominant octagonal cell shape. Cell arrange-ment and shape are more complicated in hardwoods than in softwoods for three main reasons: (1) transverse expansion of the vessels, (2) elongation of wood fiber tips, and (3) ray distribution. Vessels are very abundant; more than 100/mm2 in Magnolia. The cell arrangement and shape are also af-fected by tip invasion into the cell corner from upper and lower fibers. The neighboring radial walls with rays are flat. Small invading tips were often observed at the corner posi-tion between ray and two fibers, and these may have de-rived the small peaks 3 and 5. In particular, peak 4 had small angular fluctuations in the radial walls that were flattened by the neighboring rays. When Fig. 4b,c is observed, powers dispersed in all directions are equal to the amount of peaks 1–6, suggesting that many cell sides are not yet identified. For the reasons described above, it is difficult to reconstruct the correct cell shape of fiber bodies and so only data is given in this report.
Existence ratio of transverse cell shape models
The peak areas (Apeak) correspond to the accumulation
length of each cell wall as stated above. Then, we examined the existence ratio of transverse cell shape models from peak areas in Agathis. We focused on the r wall only, and computed the following process in order to simplify calcula-tions. The area of each peak r1, rf, r2, namely, Ar1, Arf, Ar2,
was calculated from the angular distribution function (Fig. 3c) after their peak separation. When the existence ratio of the house model and hexagonal model were set as
x%, y%, and wall length in house model as Lr1, Lrf, Lr2,
respectively, the following relations are:
x y 100 (2)
(
Ar1 Ar2)
Arf(
x 2y)(
Lr1 Lr2)
xLrf (3) In Eq. 3, the left side expresses peak area ratio of oblique walls (r1, r2) against the flat wall (rf) , and the right sideshows the wall length ratio. From Eqs. 2 and 3 x and y were
59.9% and 40.1%, respectively (Fig. 8). The fact that the house model is much abundant than hexagonal model is very attractive. Tracheids with a house model shape existed at various places, in addition to both sides of the rays when the NM of a transverse section was observed. On the other hand, the house model was less abundant than the hexago-nal model, 45% and 55%, respectively, in Cryptomeria (Fig. 5a,b). The existence of the rectangular model was ignored in the above-mentioned operation process, because the in-fluence will be only slight because of its rare existence.
Fluctuation analysis of tracheid shape
Fluctuations in cell arrangement were analyzed previously6
. Here, the fluctuation in cell wall direction is analyzed. We regarded B(x, y), representing the distribution of DM, as the periodic function.6
P(k, f) was finally translated into the periodic distribution function Period (τ, f). Disorders of periodicity were expressed as a standard deviation by con-sidering a normal distribution of the functions. Objects are considered as nonperiodic in the direction analysis of the cell wall. Each cell side causes two power radii perpendicu-lar to the cell side from the origin of the PSP. Thus, it was sufficient to read P(f).
We required a position equivalent to the standard devia-tion σ and evaluated the fluctuation in Agathis shown in Fig. 3c and Cryptomeria shown in Fig. 5a (Table 2) using a normal distribution analysis.6 Consequently, radial walls r2,
rf, and r1 had fluctuations of 12°, 9°, and 12° for sides from
59°, 91°, and 122°, respectively, while tangential wall t was 7° smaller than the radial walls in Agathis. On the other hand, radial walls are 12°, 5°, and 12° from 76°, 89°, and 102°, and the tangential wall was 5°, which was equal to rf in
Cryptomeria.
Comparison between cell shape models by FTIA and OAIA
Cell arrangement was previously evaluated quantitatively by FTIA6
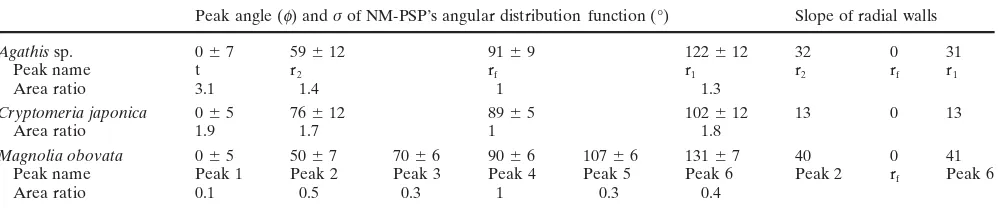
and cell shape is characterized by FTIA in this report. FTIA itself was a new analysis method and there are many preconditions. Then, the provability of reconstruction of cell shape models should be inspected by OAIA, a con-ventional analysis method, also using the data of Table 2 in Table 2. Angles of cell walls calculated from the angular distribution function of net map-power spectrum patterns (NM-PSPs)
Peak angle (f) and σ of NM-PSP’s angular distribution function (°) Slope of radial walls
Agathis sp. 0 7 59 12 91 9 122 12 32 0 31
Peak name t r2 rf r1 r2 rf r1
Area ratio 3.1 1.4 1 1.3
Cryptomeria japonica 0 5 76 12 89 5 102 12 13 0 13
Area ratio 1.9 1.7 1 1.8
Magnolia obovata 0 5 50 7 70 6 90 6 107 6 131 7 40 0 41
Peak name Peak 1 Peak 2 Peak 3 Peak 4 Peak 5 Peak 6 Peak 2 rf Peak 6
Area ratio 0.1 0.5 0.3 1 0.3 0.4
Median value of Gaussian distribution (the others are most frequent values)
bCompensated value from overestimated Feret’s H (2.6µm) generated by t-wall inclination (average 84.3°) cCalculated with consideration of ratio between two models
dCompensated value by the addition of half value of IM area eArithmetic mean value
fCalculated from length sum
gCalculated from area ratio of inclining radial walls against flat radial wall at angular distribution function and wall length ratio of models
our previous report.6
Agathis was analyzed as an example. A very wide region containing about 6600 tracheids was used6
as sample images in FTIA analysis. About 1000 tracheids were sampled on one screen and then two screens were overlapped in this study. On the other hand, OAIA measurement became possible only after strict se-paration of each element. These sese-parations are very troublesome. Prudent sampling under higher magnification is necessary for the separation. As already described, espe-cially in OAIA, sampling regions were limited and the number of tracheids was about 350. In the pure earlywood region, the OAIA sample consists of slightly larger trache-ids along the radial direction than the trachetrache-ids used for the FTIA analysis. When this fact is taken into consider-ation, it can be regarded that the results of both analyses in Table 3 are consistent. Some items will be examined in more detail.
In comparison of radial diameters, because tracheids are produced constantly from the cambium forming the radial files, the radial diameter measured by OAIA is expected to be identical to the radial periodicity estimated by FTIA; that is, the radial interval of the block model. Feret’s diam-eter H seems to be the most easily measured (Feret’s H in Table 3). Tangential walls are sometimes inclined, and their inclinations result in an overestimation of radial diameters. Although direction measurements of short lines are very difficult in OAIA, especially under low magnification, the results for t, r1, rf, and r2 are shown in Table 3. Feret’s H data
were compensated (r-dia compensated from Feret’s H in Table 3). As a result, the OAIA measurement of 36.3µm was 3.4% larger than the FTIA measurement of 35.1µm. The difference must reflect the sample characteristics, be-cause large tracheids were selectively sampled from pure earlywood in OAIA.
In comparison of cell areas, we examined the validity of models from the area information. When transverse
sec-tions of the house and hexagonal models were computed considering the existing rates of 59.9% and 40.1%, respec-tively. Total area average was calculated to be 1.46 103µm2
. On the other hand, in the OAIA measurement, the expanded lumen map (e-LM)4
separated by intercellular layer map (IM) was used. Data must be compensated for by the addition of a half value of the IM area surrounding each tracheid. Then, it became 1.51 103µm2
and was 3.4% larger than FTIA models of 1.46 103µ
m2
(Table 3). Rays are counted in the t-diameter by the periodicity of FTIA, and are thought to have weak influence because they oc-cupy a large part of the xylem. The 3.4% inconsistency seems to be due to the reason described above.
In comparison of cell side lengths, the result was consid-erably different between OAIA and FTIA (t-dia minimum in Table 3). The length of the t-fragment measured by OAIA was estimated to be 25.7µm. On the other hand, tangential wall length was calculated to be 32.9µm when the ratio of both models was considered by FTIA. The result of OAIA was smaller by 25%, when both data were compared. Very short t-fragments of tracheid tips must be the main reason for this underestimation. Moreover, fluctuations of r1 and r2 in FTIA were 12°. If the angle of r1
and r2 is corrected to a slightly steep slope, a tangential
wall suddenly becomes short. OAIA angles of r1 and r2
very difficult in hardwoods, however, because rays, vessels, and tips disturb cell arrangements and Espn is inevitably
generated. Some problems remain when the method is used for all species, but these problems are expected to be re-solved. The FTIA series from this report and our previous work6
are shown in Fig. 9 as a conclusion.
References
1. Fujita M, Kaneko T, Hata S, Saiki H, Harada H (1986) Periodical analysis of wood structure I: some trials by the optical Fourier transformation (in Japanese). Bull Kyoto Univ Forest 60: 276–284
2. Fujita M, Saiki H, Norimoto M (1991) Anisotropic periodicity analysis on cell distribution and microfibril orientation by the various diffraction methods. Grant-in-Aid for Scientific Research (Category B) Result Report from Japan Society for the Promotion of Science
3. Maekawa T, Fujita M, Saiki H (1993) Characterization of cell ar-rangement by polar coordinate analysis of power spectral patterns (in Japanese). J Soc Mater Sci Jpn 42:126–131
4. Fujita M, Midorikawa Y, Ishida Y (2002) Experimental conditions for quantitative image analysis of wood cell structure I: evaluation of various errors in ordinary accumulation image analysis (in Japanese). Mokuzai Gakkaishi 48:332–340
5. Midorikawa Y, Fujita M (2003) Experimental conditions for quanti-tative image analysis of wood cell structure IV: general procedures of Fourier transform image analysis (in Japanese). Mokuzai Gakkaishi 50:73–82
6. Midorikawa Y, Ishida Y, Fujita M (2005) Transverse shape analysis of xylem ground tissues by Fourier transform image analysis I: trial for statistical expression of cell arrangements with fluctuation. J Wood Sci 51:201–208
7. Fujita M, Hata H, Saiki H (1991) Periodical analysis of wood struc-ture IV: characteristics of the power spectral pattern of wood sec-tions and application of non-microscopic wood pictures. Mem Coll Agr Kyoto Univ 138:11–23
8. Fujita M, Saito Y, Hanaoka J, Saiki H (1993) An electron diffraction method applied to the higher order structure of cellulose microfibrils (in Japanese). Bull Kyoto Univ Forest 65:325– 328
9. Midorikawa Y, Fujita M (1997) Quantitative evaluation of transverse cell shapes by the Fourier transform image analysis: new expression of tracheids’ shape changes in an annual ring (in Japanese). Abstracts of 47th Annual Meeting of the Japan Wood Research Society, Kochi, p 19
Fig. 9. General series of FTIA for transverse shape analysis. The pro-cedure shows maps, patterns and models (in rectangles), and terms and functions from previous reports4–6 and the present study