REVIEW
Big data for bipolar disorder
Scott Monteith
1, Tasha Glenn
2, John Geddes
3, Peter C. Whybrow
4and Michael Bauer
5*Abstract
The delivery of psychiatric care is changing with a new emphasis on integrated care, preventative measures, popula‑
tion health, and the biological basis of disease. Fundamental to this transformation are big data and advances in the
ability to analyze these data. The impact of big data on the routine treatment of bipolar disorder today and in the
near future is discussed, with examples that relate to health policy, the discovery of new associations, and the study
of rare events. The primary sources of big data today are electronic medical records (EMR), claims, and registry data
from providers and payers. In the near future, data created by patients from active monitoring, passive monitoring
of Internet and smartphone activities, and from sensors may be integrated with the EMR. Diverse data sources from
outside of medicine, such as government financial data, will be linked for research. Over the long term, genetic and
imaging data will be integrated with the EMR, and there will be more emphasis on predictive models. Many techni‑
cal challenges remain when analyzing big data that relates to size, heterogeneity, complexity, and unstructured text
data in the EMR. Human judgement and subject matter expertise are critical parts of big data analysis, and the active
participation of psychiatrists is needed throughout the analytical process.
Keywords:
Bipolar disorder, Big data, EMR, Registries, Claims, Patient monitoring
© 2016 Monteith et al. This article is distributed under the terms of the Creative Commons Attribution 4.0 International License (http://creativecommons.org/licenses/by/4.0/), which permits unrestricted use, distribution, and reproduction in any medium, provided you give appropriate credit to the original author(s) and the source, provide a link to the Creative Commons license, and indicate if changes were made.
Background
The frequency and importance of comorbid mental and
chronic physical illness have emphasized the need for
a change in the delivery of psychiatric care, including
bipolar disorder (Melek et al.
2014
, DeHert et al.
2011
).
Bipolar disorder is associated with poor functional
out-come (Conus et al.
2014
), considerable economic cost
for society (Kleine-Budde et al.
2014
; Young et al.
2011
),
and management is often complicated by medical
comor-bidity such as type II diabetes/insulin resistance (Calkin
et al.
2015
; Calkin and Alda
2015
; Carney and Jones
2006
). Responses to improve care delivery include
inte-grating psychiatry with primary care (Butler et al.
2008
;
Manderscheid and Kathol
2014
; Cerimele and Strain
2010
; Katon et al.
2010
), collaborative care measures
(Woltmann et al.
2012
), implementing preventive
pro-grams and quality measurements consistent with a
popu-lation health perspective (Rose
2001
; Mabry et al.
2008
),
and increasing emphasis on the genetic and neuroscience
basis of mental illness (Insel
2009
; Reynolds et al.
2009
).
Additionally, precision medicine initiatives are
accelerat-ing interdisciplinary research with a goal of tailoraccelerat-ing
psy-chiatric care to the individual (Insel
2014
).
Big data and advances in the ability to analyze these
data are fundamental to this evolving perspective of
psy-chiatry (Monteith et al.
2015
; NRC
2013
). Big data can
be conceptualized as heterogeneous data, unprecedented
in size and complexity, lacking in structure, and coming
from many sources (Monteith et al.
2015
). The scale of
big data in size and complexity makes it difficult to
pro-cess, analyze, and extract useful information (Burkhardt
2014
). Today, the primary source of big data in medicine
is from providers and payers including electronic
medi-cal records (EMR) created by physicians, claims records,
pharmacy records, and imaging. However, the data
for analysis will keep expanding from omics, such as
genomic, epigenomic, proteomic, and metabolomic data.
Today, about 95 % of the data for each patient is generated
by imaging (Hamalka
2011
), and genomic data requires
50-fold greater storage per patient than imaging
(Star-ren et al.
2013
). Data will also be coming from
non-tradi-tional sources including patients and non-providers, from
smartphone applications, sensors, and Internet activities
Open Access
*Correspondence: michael.bauer@uniklinikum‑dresden.de 5 Department of Psychiatry and Psychotherapy, Universitätsklinikum Carl Gustav Carus, Technische Universität Dresden, Fetscherstr. 74, 01307 Dresden, Germany
(Glenn and Monteith
2014a
). With the addition of data
from patient devices, it is estimated that every person
will generate more than 1 petabyte (1 million gigabytes)
of health information over a lifetime (IBM
2015a
). IBM
envisions a future in which 10 percent of medical data will
be from medical records, 20 percent from genomics, and
70 % from patient-created sources (Slabodkin
2015
). The
amount of medical-related data in existence is expected to
double in size every 2 years (IBM
2015b
).
It is still early in the process of converting from paper
to digital-based medicine. As with other industries, the
main benefits will be related to future innovations and
redefined work processes fostered by the technology, and
increased software usability and usefulness (Fernald and
Wang
2015
; Landauer
1995
). However, many initial
ben-efits from digitizing data are already being seen today in
the analysis of very large databases. The objective of this
review is to discuss both the promises and challenges of
using big data to improve the understanding and
treat-ment of bipolar disorder.
Data sources from providers and payers
There are many public and private sources of big data
from EMR, claims/administrative data, and registries
that are available for secondary use in medical research.
These data sources were not designed for research and
each has strengths and weaknesses, with differences in
quality, completeness, and potential for bias. In the US,
claims or administrative encounter data that providers
(physicians, hospitals, labs, and pharmacies) submit for
payment to insurers and the government provide the
most complete picture of patient involvement with the
healthcare system. Although standardized diagnostic and
procedure codes are used, claims data lacks clinical detail
such as test results. The diagnosis on a claim is only for
the services performed on that date, and may be
incor-rect, incomplete, differential, or driven by
reimburse-ment policies (Sarrazin and Rosenthal
2012
; Wilson and
Bock
2012
; West et al.
2014
; Overhage and Overhage
2013
). The time lag for claims processing is often several
months. About 17 % of commercially insured people in
the US switch coverage each year posing challenges for
longitudinal analysis (Sung
2015
; Marketscan
2011
).
In contrast to claims, EMR provide timely clinical
details from the providers who use the software,
espe-cially related to patient management. The clinical data
may include patient history and symptoms, multiple
diagnoses including those unrelated to the current visit,
physician assessment and treatment plan, disease
sever-ity, lab results, vital signs, non-prescription drugs and
results of screening tools such as PHQ-9. Government
mandates in the US have dramatically increased the use
of EMR. About half of EMR text is unstructured data
(Davenport
2014
), and many challenges remain to
auto-matically extract information from the rich but distinct
vocabularies used throughout medicine (Dinov
2016
;
Ivanovic and Budimac
2014
). Efforts are underway to
address standardization with the goal of semantic
inter-operability of data from different providers and software
systems (IHE
2015
; HealthIT.gov
2015
; Dinov
2016
).
There are other important quality issues in EMR data
including inconsistency, redundancy, inaccuracy,
miss-ing data, interoperability between vendor products, and
potential biases from measured and non-measured
con-founders (Monteith et al.
2015
; Bayley et al.
2013
; Kaplan
et al.
2014
; Hersh et al.
2013
; Hripcsak et al.
2011
).
Outside the US, psychiatric register data may be based
on a country population such as in the Nordic countries
or Taiwan, or a geographical area such as the South
Lon-don and Maudsley NHS Foundation Trust (SLAM) case
register, or a provider (Munk-Jorgensen et al.
2014
;
Alle-beck
2009
; Stewart et al.
2009
). These registries provide a
longitudinal record of all psychiatric contacts, and have
high coverage and low dropout rates in countries with a
national health service. However, there are limitations to
the validity and quality of data in psychiatric registries,
including over-representation of severe cases or
inpa-tient data, sparse clinical detail, exclusion of variables not
available from all institutions reporting to the register,
and insufficient linking to other registries such as cause
of death (Munk-Jørgensen et al.
2014
). There are also
questions about the validity of psychiatric diagnoses in
the register data (Byrne et al.
2005
; Øiesvold et al.
2013
),
including bipolar disorder (Øiesvold et al.
2012
).
Psychi-atric case registries do not include patients without a
psy-chiatric diagnosis for comparison (Munk-Jørgensen et al.
2014
). Some other types of registries that can be linked
to psychiatric registries include those for general health,
prescription drugs, vital statistics, school registries,
social insurance registries, and biobanks (Allebeck
2009
),
each of which has strengths and weaknesses.
Other sources of data include research databases and
surveys, such as the US National Comorbidity Survey
(Kessler et al.
1994
) or the National Epidemiological
Survey on Alcohol and Related Conditions (NESARC)
(Grant et al.
2004
), which may have a national scope but
contain a subset of clinical information.
Even very large databases containing millions of
individuals may not be representative of the general
population (Riley
2009
). For example, the US claims/
EMR database with 84 million patients, psychiatric and
behavioral diagnoses were less frequent as compared to
the US National Inpatient Sample, an established
popu-lation estimate based on claims (HCUP
2015
; DeShazo
and Hoffman
2015
). Population-based registries from
small homogenous countries may not be
representa-tive of the population in larger diverse countries. Due to
the heterogeneity among very large databases, the data
source selected may challenge the results of
observa-tional studies, including even finding contradictory
sta-tistical significance (Madigan et al.
2013
; Goldstein and
Winkelmayer
2015
; Crump et al.
2013a
). However, with a
clear understanding of the strengths and weaknesses of a
database, some findings from observational analyses can
now be verified in many national and regional settings.
For example, in a systematic review of 25 international
population or community-based studies using different
diagnostic criteria, the prevalence of bipolar disorder
type I and type II was consistently low (Clemente et al.
2015
).
The addition of complementary data sources may
improve the accuracy and usefulness of data from any
one source. Even when using validated algorithms, it
is difficult to determine an episodic diagnosis such as
depression when analyzing US claims data, and
combin-ing another data source such as EMR may improve
accu-racy (Townsend et al.
2012
; Fiest et al.
2014
). However, in
the US, linking of data from unrelated sources that were
de-identified to meet privacy regulations is challenging
(West et al.
2014
, Li and Shen
2013
). In contrast, many
European countries have a unique person identifier that
is present on all medical data (Allebeck
2009
). The use
of complementary linked databases may also expand the
types of research questions that may be addressed.
Exam-ples of useful linkages include register population data
linked with biobank data in a study that found no
asso-ciation between markers of prenatal infection and the
risk of bipolar disorder (Mortensen et al.
2011
), and in a
study that found elevated C-reactive protein was
associ-ated with an increased risk of late-onset bipolar disorder
(Wium-Andersen et al.
2015
).
Uses for data from providers and payers
The analysis of very large databases has provided
fun-damental information about bipolar disorder
includ-ing the incidence, prevalence, decreased life expectancy
(Munk-Jørgensen et al.
2014
; Allebeck
2009
; Laursen
et al.
2007
; Chang et al.
2011
; Kessing et al.
2015c
;
Kes-sing et al.
2015d
), and trends in prescribing medication
(Baldessarini et al.
2007
; Hayes et al.
2011
; Bjorklund
et al.
2015
). Results from the analysis of large data sources
are continuously being incorporated into patient care and
research, and some key areas are discussed below.
Health policy decisions
Health policy decisions focus on outcome and cost. Big
data is fundamental to the increasing importance of
clinical guidelines, defining and measuring metrics that
reflect the quality of care delivered, and meeting
per-formance standards based on quality metrics. For the
treatment of bipolar disorder, big data studies are
help-ing to characterize problems and evaluate the results of
policy changes. Of great concern are repeated findings
of excess mortality in patients with bipolar disorder due
primarily to physical illness, and of continuing disparities
in the treatment of physical illness as compared with the
general population (Roshanaei-Moghaddam and Katon
2009
; McGinty et al.
2015
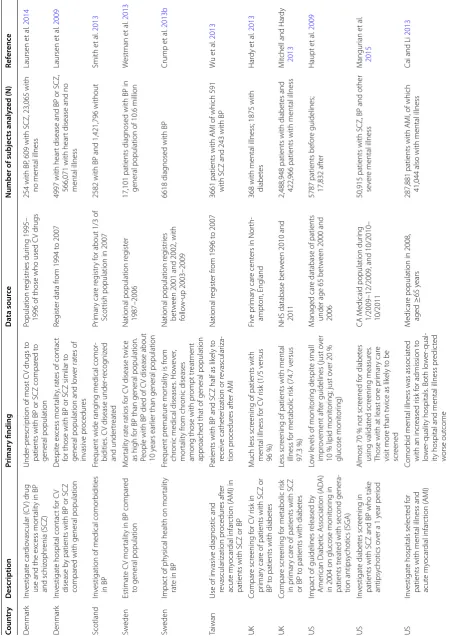
). Some examples of suboptimal
care for medical illness for people with bipolar disorder
found using big data are shown in Table
1
. In addition to
health services and physical illness, socioeconomic
fac-tors and patient behaviors contribute to excess
morbid-ity and mortalmorbid-ity in bipolar disorder (Druss et al.
2011
).
The linking of psychiatric data with other databases, such
as government financial databases, will help to clarify the
complex, cumulative impacts of diverse socioeconomic
factors, as shown in Table
2
. Examples of studies directly
related to health policy and bipolar disorder using big
data are given in Table
3
.
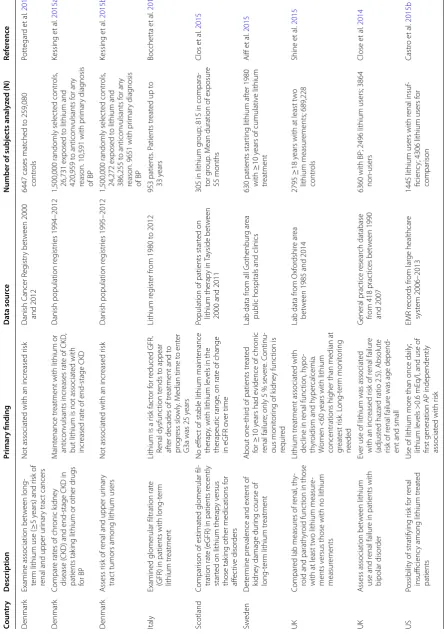
Evaluation of rare events
Big data allows the study of rare events and outcomes
that may require data from multiple sources to provide
an adequate sample size for detection. Randomized
con-trolled trials are not powered to detect rare events or
long-term effects, and case control and retrospective
cohort study designs of observational databases collected
from clinical practice are often used (Chan et al.
2015
;
Rodriguez et al.
2001
). For example, there have been
several recent large or population-based studies of renal
related events in patients who were treated with lithium,
as shown in Table
4
. Big databases are being used for
pharmacovigilance of many drugs prescribed for
bipo-lar disorder, such as studies of the potential for anti-
psychotics to increase risk of a seizure (Bloechliger et al.
2015
), pulmonary embolism (Tournier
2015
; Conti et al.
2015
), and a Torsades de pointes ventricular arrhythmia
(Poluzzi et al.
2013
).
Exploration and hypothesis generation from large
databases
Table
1
Examples of studies suggesting sub
optimal tr
ea
tmen
t of medic
al illness in bip
olar disor
der
Coun tr y Description Primar y finding Da ta sour ce Number of subjec ts analyz ed (N) Ref er enc e D enmar k In vestigat e car dio vascular ( C V ) druguse and the ex
cess mor
talit
y in BP
and schiz ophr enia (SCZ) Under ‑pr escr
iption of most C
V drugs t
o
patients with BP or SCZ compar
ed t o general population Population r eg istr ies dur ing 1995–
1996 of those who used C
V drugs
254 with BP
, 609 with SCZ, 23,065 with
no mental illness
Laursen et al . 2014 D enmar k In vestigat
e hospital contac
t f
or C
V
disease b
y patients with BP or SCZ
compar
ed with general population
D espit e ex cess mor talit y, rat
es of contac
t
for those with BP or SCZ similar t
o
general population and lo
w er rat es of in vasiv e pr ocedur es Reg ist
er data fr
om 1994 t
o 2007
4997 with hear
t disease and BP or SCZ,
566,071 with hear
t disease and no
mental illness Laursen et al . 2009 Scotland In
vestigation of medical comor
bidities
in BP
Fr
equent wide rang
ing medical comor
‑
bidities
. C
V disease under
‑r ecog niz ed and under tr eat ed Pr imar y car e r eg istr y f
or about 1/3 of
Scottish population in 2007
2582 with BP and 1,421,796 without
Smith et al . 2013 Sw eden Estimat e C V mor talit
y in BP compar
ed
to general population
M
or
talit
y rat
e ratios f
or C
V disease t
wice
as high f
or BP than general population.
People with BP died of C
V disease about
10
y
ears ear
lier than general population
National population r
eg
ist
er
1987–2006
17,101 patients diag
nosed with BP in
general population of 10.6 million
W estman et al . 2013 Sw eden Impac
t of ph
ysical health on mor
talit
y
rat
e in BP
Fr
equent pr
ematur
e mor
talit
y is fr
om
chr
onic medical diseases
. Ho w ev er , mor talit y fr om chr onic diseases
among those with pr
ompt tr
eatment
appr
oached that of general population
National population r
eg
istr
ies
bet
w
een 2001 and 2002, with
follo
w
‑up 2003–2009
6618 diag
nosed with BP
Crump et
al
.
2013b
Taiwan
Use of in
vasiv e diag nostic and re vascular ization pr ocedur es af ter acut e m yocar dial infar ction ( A MI) in
patients with SCZ or BP
Patients with BP and SCZ half as lik
ely t
o
receiv
e cathet
er
ization or r
evascular iza ‑ tion pr ocedur es af ter A MI National r eg ist er fr
om 1996 t
o 2007
3661 patients with A
MI of which 591
with SCZ and 243 with BP
W u et al . 2013 UK Compar e scr eening f or C V r isk in pr imar y car
e of patients with SCZ or
BP t
o patients with diabet
es
M
uch less scr
eening of patients with
mental illness f
or C
V r
isk (1/5 v
ersus 96 %) Fiv e pr imar y car e cent
ers in Nor
th
‑
ampt
on, England
368 with mental illness; 1875 with diabet
es Har dy et al . 2013 UK Compar e scr eening f
or metabolic r
isk
in pr
imar
y car
e of patients with SCZ
or BP t
o patients with diabet
es
Less scr
eening of patients with mental
illness f
or metabolic r
isk (74.7 v
ersus
97.3
%)
NHS database bet
w
een 2010 and
2011
2,488,948 patients with diabet
es and
422,966 patients with mental illness
M
itchell and Har
dy
2013
US
Impac
t of guidelines r
eleased b
y
Amer
ican Diabetic A
ssociation (
AD
A)
in 2004 on glucose monit
or
ing in
patients tr
eat
ed with second genera
‑
tion antipsy
chotics (SGA)
Lo
w le
vels of monit
or ing despit e small impr ov ement af
ter guidelines (
just o
ver
10
% lipid monit
or
ing; just o
ver 20 % glucose monit or ing) M anaged car
e database of patients
under age 65 bet
w
een 2000 and
2006
5787 patients bef
or e guidelines; 17,832 af ter Haupt et al . 2009 US In vestigat e diabet es scr eening in
patients with SCZ and BP who tak
e
antipsy
chotics o
ver a 1
y
ear per
iod
Almost 70
% not scr
eened f or diabet es using validat ed scr eening measur es .
Those with at least one pr
imar
y car
e
visit mor
e than t
wice as lik
ely t
o be
scr
eened
CA M
edicaid population dur
ing
1/2009–12/2009, and 10/2010– 10/2011 50,915 patients with SCZ, BP and other se
ver
e mental illness
M angur ian et al . 2015 US In vestigat
e hospitals selec
ted f
or
patients with mental illness and acut
e m yocar dial infar ction ( A MI) Comor
bid mental illness was associat
ed
with an incr
eased r
isk f
or admission t
o lo w er ‑qualit y hospitals
. Both lo
w
er
‑qual
‑
ity hospital and mental illness pr
edic ted w orse out come M edicar
e population in 2008,
aged
≥
65
y
ears
287,881 patients with A
MI, of which
41,044 also with mental illness
Cai and Li
or data-intensive experimental methods as
appropri-ate. There are many computational and statistical
chal-lenges associated with the analysis of big data related to
the number of patients, number of variables per patient,
and the quality and technical complexity of the databases
(Monteith et al.
2015
; Fan et al.
2014
; Grimes and Schulz
2002
). Both the variables included and the analytic
tech-niques used may lead to variation in the associations
detected in big data studies (Abrams et al.
2008
; Fan et al.
2014
; Patel et al.
2015a
).
Additional correlations detected include an
associa-tion between epilepsy and bipolar disorder (Wotton and
Goldacre
2014
; Clarke et al.
2012
), an increased risk of
pneumonia in patients with bipolar disorder taking anti-
psychotics (Yang et al.
2013
), an increased risk of bipolar
disorder in those with a diagnosis of autism spectrum
disorder (Selten et al.
2015
), and finding that the
prema-ture risk of cardiovascular disease in bipolar disorder is
not explained by traditional risk factors including
ciga-rette smoking, obesity, or hypertension (Goldstein et al.
2015
). In a study using medical records from 110 million
patients, new associations were found between
Mende-lian diseases and complex psychiatric diseases, including
bipolar disorder (Blair et al.
2013
).
Defining phenotypes
There is considerable interest in using EMR to automate
the process of defining phenotypic cohorts for genetic
studies of bipolar disorder, since sample sizes of tens of
thousands are needed (Pathak et al.
2013
; Potash
2015
).
In addition to the study of phenotype-genotype
relation-ships and gene-disease associations, phenotypic cohorts
will enable a wide range of clinical research. Despite
many challenges, semi-automated methods are now
being used to define phenotypes from EMR for
psychi-atric disorders, including bipolar disorder (Lyalina et al.
2013
; Castro et al.
2015a
). The methodology used to
automate phenotype detection in EMR is evolving, and
includes data mining, natural language processing,
sta-tistical techniques, and human expertise (Hripcsak and
Albers
2013
; Pathak et al.
2013
). More standardization is
expected in the future.
Predictive models
Predictive models are widely used in medicine, such
as cardiovascular risk prediction, to estimate the
pres-ence of a diagnosis or event, or if the diagnosis or event
will occur in a specific time period (Moons et al.
2012
).
The results of validated predictive models may assist the
physician and patient with decision making to mitigate
risks, and help to limit spending on unnecessary
proce-dures. Before adoption for clinical use, predictive models
require considerable testing and re-adjustment, including
internal validation, external validation with other
popu-lations, followed by determination if the validated model
provides actionable information to the clinician and
patient (Moons et al.
2012
). Most predictive models are
based on a small number of variables collected in cohort
studies such as the Framingham Heart Study (D’Agostino
et al.
2008
). In general, models used in medicine today
have limited predictive power, and access to the large
number of variables and patients in EMR and other
data-bases may improve their accuracy in the future (Berger
and Doban
2014
; de Lissovoy
2013
). With the frequent
use of heuristics in medical decision making, complex
predictive models also need practical input requirements
for routine use in clinical situations (Marewski and
Gig-erenzer
2012
).
Many technical issues impede the development of
predictive models from EMR data, including quality,
multidimensional complexity, bias, comorbidities, and
confounding medical interventions (Paxton et al.
2013
;
Wu et al.
2010
; Wang et al.
2014
). The temporal nature
of EMR data also poses a significant challenge for
predic-tion (Singh et al.
2015
; Binder and Blettner
2015
). In
con-trast to a controlled longitudinal study, data entries into
an EMR only occur when a patient initiates or a
physi-cian recommends and documents care. There are great
differences in the time between visits for one patient,
and across all patients, in the number of visits and length
of time each patient is tracked. New variables detected
in EMR data may be associated with but not predictive
of disease (Ware
2006
). A variety of machine learning,
data mining, classification algorithms, and statistical
approaches are currently being researched for the future
(Singh et al.
2015
; Wu et al.
2010
, Wang et al.
2014
).
While the primary benefits of prediction will be in
the future, in some recently developed models, bipolar
disorder is a risk factor for readmission to a psychiatric
hospital within 30 days of discharge (Vigod et al.
2015
),
readmission to a safety-net hospital within a year
(Ham-ilton et al.
2015
), and suicide by veterans (McCarthy et al.
2015
). The addition of variables relating to a diagnosis of
bipolar disorder or schizophrenia improved the accuracy
of a predictive model of cardiovascular risk for those with
these diagnoses (Osborn et al.
2015
).
Table
2
Examples of big da
ta studies of so
cio
ec
onomic fac
tors in bip
olar disor
der
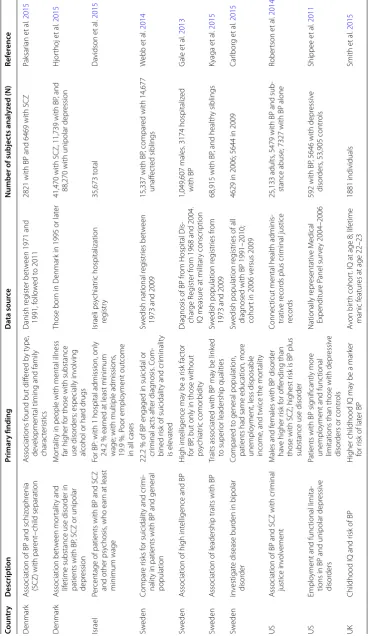
Coun tr y Description Primar y finding Da ta sour ce Number of subjec ts analyz ed (N) Ref er enc e D enmar k Association of BP and schiz
ophr
enia
(SCZ) with par
ent
–child separation
A
ssociations f
ound but diff
er ed b y t ype , de
velopmental timing and family
charac ter istics Danish r eg ist er bet w
een 1971 and
1991, f
ollo
w
ed t
o 2011
2821 with BP and 6469 with SCZ
Paksar ian et al . 2015 D enmar k A ssociation bet w een mor talit y and lif
etime substance use disor
der in
patients with BP
, SCZ or unipolar
depr
ession
M
or
talit
y in people with mental illness
far higher f
or those with substance
use disor
ders; especially in
volving
alcohol or har
d drugs
Those bor
n in D
enmar
k in 1995 or lat
er
41,470 with SCZ, 11,739 with BP
, and
88,270 with unipolar depr
ession H jor thoj et al . 2015 Israel Per
centage of patients with BP and SCZ and other psy
chosis
, who ear
n at least
minimum wage
For BP
: with 1 hospital admission, only
24.2
% ear
ned at least minimum
wage; with multiple admissions
, 19.9 %. P oor emplo yment out come
in all cases
Israeli psy chiatr ic hospitalization reg istr y 35,673 t otal Da vidson et al . 2015 Sw eden Compar e r isks f or suicidalit
y and cr
imi
‑
nalit
y in patients with BP and general
population
22.2
% of BP engaged in suicidal or
cr iminal ac ts af ter diag nosis . C om ‑ bined r
isk of suicidalit
y and cr
iminalit y is ele vat ed Sw
edish national r
eg
istr
ies bet
w
een
1973 and 2009
15,337 with BP
, compar
ed with 14,677
unaff ec ted siblings W ebb et al . 2014 Sw eden A
ssociation of high int
elligence and BP
H
igh int
elligence ma
y be a r
isk fac
tor
for BP
, but only in those without
psy chiatr ic comor bidit y Diag
nosis of BP fr
om Hospital Dis
‑ char ge R eg ist er fr
om 1968 and 2004.
IQ measur
e at militar
y conscr
iption
1,049,607 males
. 3174 hospitaliz
ed with BP G ale et al . 2013 Sw eden A
ssociation of leadership traits with BP
Traits associat
ed with BP ma
y be link
ed
to super
ior leadership qualities
Sw
edish population r
eg
istr
ies fr
om
1973 and 2009
68,915 with BP
, and health
y siblings Kyaga et al . 2015 Sw eden In vestigat
e disease bur
den in bipolar
disor
der
Compar
ed t
o general population,
patients had same education, mor
e
unemplo
yment, less disposable
income
, and t
wice the mor
talit
y
Sw
edish population r
eg
istr
ies of all
diag
nosed with BP 1991–2010;
cohor
t in 2006 v
ersus 2009
4629 in 2006; 5644 in 2009
Car lbor g et al . 2015 US A
ssociation of BP and SCZ with cr
iminal
justice in
volv
ement
M
ales and f
emales with BP disor
der
ha
ve higher r
isk f
or off
ending than
those with SCZ; highest r
isk is BP plus
substance use disor
der
Connec
ticut mental health adminis
‑
trativ
e r
ecor
ds plus cr
iminal justice
recor
ds
25,133 adults
, 5479 with BP and sub
‑
stance abuse; 7327 with BP alone
Rober tson et al . 2014 US Emplo
yment and func
tional limita
‑
tions in BP and unipolar depr
essiv
e
disor
ders
Patients with BP sig
nificantly mor
e
unemplo
yment and func
tional
limitations than those with depr
essiv
e
disor
ders or contr
ols Nationally r epr esentativ e M edical Expenditur e P anel sur ve y 2004–2006
592 with BP
, 5646 with depr
essiv
e
disor
ders
, 53,905 contr
ols Shippee et al . 2011 UK
Childhood IQ and r
isk of BP
H
igher childhood IQ ma
y be a mar
ker
for r
isk of lat
er BP
A
von bir
th cohor
t. IQ at age 8; lif
etime
manic f
eatur
es at age 22–23
1881 individuals
Smith et
al
.
Table
3
Examples of big da
ta pr
ojec
ts r
ela
ted t
o health p
olic
y f
or pa
tien
ts with bip
olar disor
der
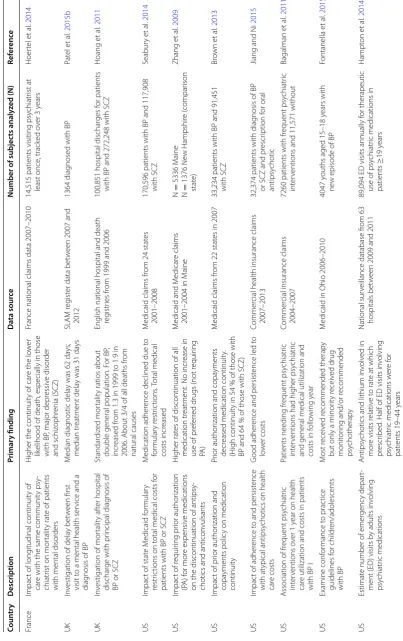
Coun tr y Description Primar y finding Da ta sour ce Number of subjec ts analyz ed (N) Ref er enc e France Impact of long
itudinal continuit
y of
car
e with the same communit
y psy
‑
chiatr
ist on mor
talit
y rat
e of patients
with mental disor
ders
H
igher the continuit
y of car
e the lo
w
er
lik
elihood of death, especially in those
with BP
, major depr
essiv e disor der and schiz ophr enia (SCZ)
France national claims data 2007–2010
14,515 patients visiting psy
chiatr ist at least once , track ed o ver 3 y ears Hoer tel et al . 2014 UK In
vestigation of dela
y bet
w
een first
visit t
o a mental health ser
vice and a
diag
nosis of BP
M
edian diag
nostic dela
y was 62
da
ys;
median tr
eatment dela
y was 31
da ys SLA M r eg ist
er data bet
w
een 2007 and
2012
1364 diag
nosed with BP
Pat el et al . 2015b UK In
vestigation of mor
talit
y af
ter hospital
dischar
ge with pr
incipal diag
nosis of
BP or SCZ
Standar
diz
ed mor
talit
y ratios about
double general population. F
or BP
,
incr
eased fr
om 1.3 in 1999 t
o 1.9 in
2006. About 3/4 of all deaths fr
om
natural causes
English national hospital and death reg
istr
ies fr
om 1999 and 2006
100,851 hospital dischar
ges f
or patients
with BP and 272,248 with SCZ
Hoang et al . 2011 US Impac
t of stat
e M edicaid f or mular y restr ic
tions on t
otal medical costs f
or
patients with BP or SCZ
M
edication adher
ence declined due t
o for mular y r estr ic tions . T otal medical costs incr eased M
edicaid claims fr
om 24 stat
es
2001–2008
170,596 patients with BP and 117,908 with SCZ
Seabur y et al . 2014 US Impac
t of r
equir ing pr ior author ization (P A) f or mor e expensiv e medications
on the discontinuation of antipsy
‑
chotics and anticon
vulsants
H
igher rat
es of discontinuation of all
medication tr
eatment. No incr
ease in
use of pr
ef
er
red drugs (not r
equir
ing
PA
)
M
edicaid and M
edicar
e claims
2001–2004 in M
aine N = 5336 M aine N = 1376 Ne w Hampshir e ( compar ison stat e) Zhang et al . 2009 US Impac
t of pr
ior author
ization and
copa
yments polic
y on medication
continuit
y
Pr
ior author
ization and copa
yments
decr
eased medication continuit
y.
(H
igh continuit
y in 54
% of those with
BP and 64
% of those with SCZ)
M
edicaid claims fr
om 22 stat
es in 2007
33,234 patients with BP and 91,451 with SCZ
Br own et al . 2013 US Impac
t of adher
ence t
o and persist
ence
with at
ypical antipsy
chotics on health
car
e costs
G
ood adher
ence and persist
ence led t
o
lo
w
er costs
Commer
cial health insurance claims
2007–2013
32,374 patients with diag
nosis of BP
or SCZ and pr
escr
iption f
or oral
antipsy
chotic
Jiang and N
i
2015
US
A
ssociation of fr
equent psy chiatr ic int er ventions o ver 1 y
ear on health
car
e utilization and costs in patients
with BP I
Patients needing fr
equent psy
chiatr
ic
int
er
ventions had higher psy
chiatr
ic
and general medical utilization and costs in f
ollo
wing y
ear
Commer
cial insurance claims
2004–2007
7260 patients with fr
equent psy
chiatr
ic
int
er
ventions and 11,571 without
Bagalman et al . 2011 US Examine conf or mance t o prac tice guidelines f or childr en/adolescents with BP M ost r eceiv ed r ecommended therap y
but only a minor
ity r
eceiv
ed drug
monit
or
ing and/or r
ecommended
psy
chotherap
y
M
edicaid in Ohio 2006–2010
4047 y
ouths aged 15–18
y
ears with
ne
w episode of BP
Fontanella et al . 2015 US Estimat
e number of emer
genc
y depar
t‑
ment (ED) visits b
y adults in
volving
psy
chiatr
ic medications
Antipsy
chotics and lithium in
volv
ed in
mor
e visits r
elativ
e t
o rat
e at which
pr
escr
ibed
. Half of ED visits in
volving
psy
chiatr
ic medications w
er e f or patients 19–44 y ears National sur
veillance database fr
om 63
hospitals bet
w
een 2009 and 2011
89,094 ED visits annually f
or therapeutic
use of psy
chiatr
ic medications in
Table
3
c
on
tinued
Coun
tr
y
Description
Primar
y finding
Da
ta sour
ce
Number of subjec
ts analyz
ed (N)
Ref
er
enc
e
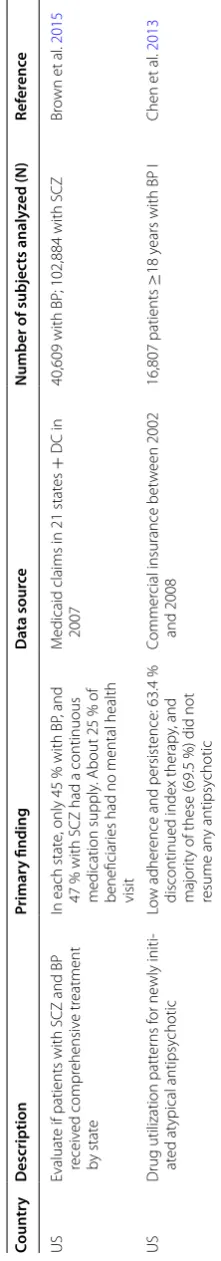
US
Evaluat
e if patients with SCZ and BP
receiv
ed compr
ehensiv
e tr
eatment
by stat
e
In each stat
e, only 45
% with BP
, and
47
% with SCZ had a continuous
medication supply
. About 25
% of
beneficiar
ies had no mental health
visit
M
edicaid claims in 21 stat
es
+
DC in
2007
40,609 with BP
; 102,884 with SCZ
Br
own et
al
.
2015
US
Drug utilization patt
er
ns f
or ne
wly initi
‑
at
ed at
ypical antipsy
chotic
Lo
w adher
ence and persist
ence: 63.4
%
discontinued index therap
y, and
major
ity of these (69.5
%) did not
resume an
y antipsy
chotic
Commer
cial insurance bet
w
een 2002
and 2008
16,807 patients
≥
18
y
ears with BP I
Chen et
al
.
Table
4
Examples of big da
ta pr
ojec
ts r
ela
ted t
o lithium and r
enal func
tion
Coun tr y Description Primar y finding Da ta sour ce Number of subjec ts analyz ed (N) Ref er enc e D enmar kExamine association bet
w
een long
‑
ter
m lithium use (
≥
5
years) and r
isk of
renal and upper ur
inar
y trac
t cancers
Not associat
ed with an incr
eased r isk Danish C ancer R eg istr y bet w een 2000 and 2012
6447 cases mat
ched t o 259,080 contr ols Pott egar d et al . 2016 D enmar k Compar e rat
es of chr
onic k
idne
y
disease (
CKD) and end
‑stage CKD in
patients tak
ing lithium or other drugs
for BP
M
aint
enance tr
eatment with lithium or
anticon
vulsants incr
eases rat
e of CKD
,
but lithium is not associat
ed with
incr
eased rat
e of end
‑stage CKD
Danish population r
eg
istr
ies 1994–2012
1,500,000 randomly selec
ted contr
ols
,
26,731 exposed t
o lithium and
420,959 t
o anticon
vulsants f
or an
y
reason. 10,591 with pr
imar y diag nosis of BP Kessing et al . 2015a D enmar k A ssess r
isk of r
enal and upper ur
inar
y
trac
t tumors among lithium users
Not associat
ed with an incr
eased r
isk
Danish population r
eg
istr
ies 1995–2012
1,500,000 randomly selec
ted contr
ols
,
24,272 exposed t
o lithium and
386,255 t
o anticon
vulsants f
or an
y
reason. 9651 with pr
imar y diag nosis of BP Kessing et al . 2015b Italy
Examined glomerular filtration rat
e
(GFR) in patients with long
‑t
er
m
lithium tr
eatment
Lithium is a r
isk fac tor f or r educed GFR. Renal dysfunc tion t ends t o appear af
ter decades of tr
eatment and t
o pr og ress slo wly . M
edian time t
o ent
er
G3a was 25
y ears Lithium r eg ist er fr
om 1980 t
o 2012
953 patients
. P
atients tr
eat
ed up t
o 33 y ears Bocchetta et al . 2015 Scotland Compar
ison of estimat
ed glomerular fil
‑
tration rat
e (
eGFR) in patients r
ecently
star
ted on lithium therap
y v
ersus
those tak
ing other medications f
or aff ec tiv e disor ders No eff ec
t of stable lithium maint
enance
therap
y, with lithium le
vels in the
therapeutic range
, on rat
e of change
in eGFR o
ver time
Population of patients star
ted on lithium therap y in Ta yside bet w een
2000 and 2011
305 in lithium g
roup; 815 in compara
‑
tor g
roup
. M
ean duration of exposur
e 55 months Clos et al . 2015 Sw eden D et er mine pr
evalence and ex
tent of
kidne
y damage dur
ing course of
long
‑t
er
m lithium tr
eatment
About one
‑thir
d of patients tr
eat ed for ≥ 10 y
ears had e
vidence of chr
onic
renal failur
e; only 5
% se ver e. C ontinu ‑ ous monit or
ing of k
idne
y func
tion is
requir
ed
Lab data fr
om all G
othenbur
g ar
ea
public hospitals and clinics
630 patients star
ting lithium af
ter 1980
with
≥
10
y
ears of cumulativ
e lithium tr eatment Aiff et al . 2015 UK Compar
ed lab measur
es of r
enal
, th
y‑
roid and parath
yr
oid func
tion in those
with at least t
w
o lithium measur
e‑
ments v
ersus those with no lithium
measur
ements
Lithium tr
eatment associat
ed with
decline in r
enal func tion, h ypo ‑ th yr
oidism and h
yper calcemia. W omen <60 y
ears with lithium
concentrations higher than median at great
est r isk . L ong ‑t er m monit or ing needed
Lab data fr
om Oxf or dshir e ar ea bet w
een 1985 and 2014
2795
≥
18
y
ears with at least t
w o lithium measur ements; 689,228 contr ols Shine et al . 2015 UK A
ssess association bet
w
een lithium
use and r
enal failur
e in patients with
bipolar disor
der
Ev
er use of lithium was associat
ed
with an incr
eased r
isk of r
enal failur
e
(adjust
ed hazar
d ratio 2.5). Absolut
e
risk of r
enal failur
e was age depend
‑
ent and small
G
eneral prac
tice r
esear
ch database
from 418 prac
tices bet
w
een 1990
and 2007
6360 with BP
; 2496 lithium users; 3864
non ‑users Close et al . 2014 US Possibilit
y of stratifying r
isk f
or r
enal
insufficienc
y among lithium tr
eat
ed
patients
Use of lithium mor
e than once daily
; lithium le vels >0.6 mE q/l
, and use of
first generation AP independently associat
ed with r
isk EMR r ecor ds fr om lar ge healthcar e syst em 2006–2013
1445 lithium users with r
enal insuf
‑
ficienc
y; 4306 lithium users f
Data actively created by patients outside of medical
settings
Many applications are available today to monitor bipolar
disorder away from medical settings that require active
patient participation. These include validated products for
mood charting such as the ChronoRecord on a computer
(Bauer et al.
2004
; Bauer et al.
2008
), the Life-Chart on a
smartphone and web site (Scharer et al.
2015
), weekly text
messaging of responses to Quick Inventory of
Depres-sive Symptomatology and Altman self-rating manic scale
(Bopp et al.
2010
), and weekly or monthly use of an
inter-active voice response (IVR) system to complete the PHQ-9
(Piette et al.
2013
). In all cases, the patients respond to
questions or prompts directly related to their illness. In
addition to clinical use, data collected from these systems
is often aggregated for research (Bauer et al.
2013a
,
2013b
;
Moore et al.
2014
). A large number of parameters may be
accumulated for each patient, such as from daily
medica-tions taken (Bauer et al.
2013a
), but data are not routinely
integrated into the EMR. Although challenges remain
regarding the interpretation of self-reported data, much
of the understanding about the long-term course of
bipo-lar disorder is due to the daily recording efforts of patients
worldwide, starting with paper-based instruments (Bauer
et al.
1991
; Kupka et al.
2007
).
Data passively created by patients outside of medical
settings
With passive monitoring, patients do not directly
pro-vide information about their illness, and much of the
data collected are non-medical. For example, data from
Internet and smartphone activities, and from sensors
in smartphones and wearable technology, are routinely
being used to monitor mental state and behavior for
non-medical purposes such as behavioral advertising (Glenn
and Monteith
2014b
; Geller
2014
; FTC
2009
). There are
a variety of passive monitoring projects for bipolar
dis-order, mostly in the pilot phase, with examples shown
in Table
5
. The implementation of routine passive
moni-toring for large numbers of patients faces many hurdles,
including patient acceptance, physician usability, and
processing large volumes of data from sensors
(Red-mond et al.
2014
; Muench
2014
). Many passive
moni-toring projects involve smartphones. Both the differing
physical characteristics of the standard devices available
to consumers such as sensor accuracy and memory size,
and methods selected for analysis may impact the
find-ings (Banaee et al.
2013
; Redmond et al.
2014
). The sales
of smartphones are flat in developed countries with
satu-ration reached, and usage patterns vary among countries
(Thomas
2014
, Waters
2015
). In the US in 2015, 64 % of
adults in the US use a smartphone with 7 % relying
pri-marily on it for Internet access (Smith
2015
).
Commercial processing of data
Provider-created data are traditionally processed by the
provider or their contractors. In contrast, commercial
firms unrelated to medicine may be involved in both
active and passive patient monitoring. Many behavioral
related apps are available for Apple and Android
smart-phones, and commercial firms may receive, store, and
analyze data using proprietary and unvalidated
algo-rithms. Any potential combination of data processed by
commercial firms with EMR data needs to be carefully
evaluated as the firms may not be covered by national
privacy regulations (Glenn and Monteith
2014b
). An
analysis of 79 mobile health apps certified as trustworthy
by the UK NHS found a multitude of privacy and security
flaws (Huckvale et al.
2015
).
Changing world of technology
Passive monitoring should be considered in the
con-text of the ongoing changes in digital technology,
espe-cially in relation to mobile devices for consumers. First,
the devices used to access the Internet will change the
online activities of the public. For example, the use of a
search engine is much lower from a smartphone than
from a computer (Arthur
2015
; MacMillan
2015
).
Sec-ond, the widespread use of mobile technology has
trig-gered a push toward developing artificial intelligence (AI)
interfaces for devices, as evidenced by the near
simulta-neous announcements of open source AI software tools
from Google, Microsoft, IBM, and Facebook (Simonite
2015
). The vision of Larry Page of Google is for Google
to tell you what you want before you ask the question
(Varian
2014
, Page
2013
). In an international survey of
6600 smartphone users by Ericsson, half of all
phone users expect AI interfaces to replace the
smart-phone screen within 5 years, and one-third want AI to
keep them company (Boulden
2015
). Messaging chatbots
(computer-generated responses based on AI) are
start-ing to replace search engines on mobile devices (Elgan
2015
). In the future, consumer mobile devices will
rou-tinely incorporate voice and gesture input, and as
hard-ware features change, the AI algorithms will also evolve.
In the background, there is an industry-wide effort to
develop AI algorithms based on massive databases to
predict behavior and emotions for uses such as for
tar-geted marketing.
Other provider data sources
MRI scans from 1710 patients with bipolar disorder and
2594 controls (Thompson et al.
2014
, Hibar et al.
2016
).
The ConLiGen Consortium identified genetic variants
associated with lithium response in a GWAS study of
2563 patients with bipolar disorder (Hou et al.
2016
). The
Psychiatric Genomics Consortium (PGC) found a new
susceptibility locus in a GWAS study of 7481
individu-als with bipolar disorder and 9250 controls (Sklar et al.
2011
). Recent technology allows large-scale comparison
of proteome profiles (Gold et al.
2010
; SomaLogic
2016
),
and findings may improve predictive models for bipolar
disorder. These data are not expected to be incorporated
into the EMR or impact the routine care of bipolar
dis-order in the near future but suggest future directions for
data integration.
General considerations
There are a wide range of anticipated and unanticipated
complications related to the use of big data in the study
of bipolar disorder some of which are mentioned briefly
below.
Privacy and confidentiality
The privacy and confidentiality of big data are a major
concern. Many technical issues affect the privacy and
confidentiality of big data related to hardware and
soft-ware implementations, mobile devices and wireless
networks, shared resources, and shared control over
monitoring systems (Ko et al.
2010
). Breaches of provider
medical data occur frequently with about 90 % of health
care providers reporting at least one data breach over
the last 2 years in an international study in 2015
(Expe-rian
2015
). The use of commercial apps for monitoring
also complicates privacy issues. Patients may incorrectly
assume that national medical privacy regulations apply
to data collected and processed by non-providers (Glenn
and Monteith
2014b
). Patient posting of private medical
data online, such as in support groups, is another
com-plication, and online data cannot really be deleted due to
the distributed and redundant storage of Internet data
(President’s Council
2014
). Preserving privacy in big data
research is particularly difficult, since this often includes
multiple international collaborators, and data are copied
and shared around the world. The legal framework for
medical privacy varies among countries (Dove and
Phil-lips
2015
).
Ethical considerations
There is disagreement about the importance of informed
consent for big data research (Rothstein
2015
), with some
wanting to ease regulations (Larson
2013
). The consent
process is of particular importance for bipolar
disor-der due to the highly sensitive information in the EMR
(Clemens
2012
), and since some patients have cognitive
impairment (Daglas et al.
2015
).
De-identification is frequently used to protect
indi-vidual privacy. De-identified data are not covered by
US federal privacy laws and are sold commercially. Yet
the general public cares about using de-identified data
without consent (McGraw
2013
), and about the
spe-cific purpose for secondary use (Grande et al.
2013
).
The released data may be vulnerable to re-identification
since current de-identification methods are inadequate
for high-dimensional data (Narayanan et al.
2016
). There
is a growing confluence of the interests of academic and
commercial organizations in big data projects, leading to
questions about ownership of the data and any benefits
created, and about disposition of data if a firm goes out of
business or is purchased.
In countries without a national health service,
predic-tive models of costs may increase coverage disparities of
vulnerable groups (Wharam and Weiner
2012
).
Predic-tive models being developed by commercial,
non-med-ical companies can create ethnon-med-ical conflicts (Glenn and
Monteith
2014a
). For example, privacy and
non-discrim-ination laws in the US that impact decisions about credit,
employment, or housing do not prohibit discrimination
against the predisposition of disabilities (Horvitz and
Mulligan
2015
).
Unreasonable expectations for predictive models
The expectations of the general public regarding
pre-dictive models may be inappropriate. People are
famil-iar with personalized recommendations from Netflix or
Amazon, search results from Google, and advertising
on Apple and Android smartphones. These predictive
models are based solely on the available data, are
uncon-nected to causal inference and underlying mechanisms,
and focus on predicting the present rather than the future
(Hand
2013
; Curtis
2014
). The validity of predictive
mod-els in business is judged by increased overall sales and
profits, not by accuracy of the prediction for individual
customers (McAfee et al.
2012
).
Physicians may also have unrealistic expectations for
models that predict behavior based on big data. Big data
is non-sampled, and from sources with a purpose other
than statistical inference (Horrigan
2013
). Data that are
created and collected by humans reflect physical place
and culture, and contain hidden biases (Pope et al.
2014
, Crawford
2013
). More data does not
Table
5
Examples of passiv
e monit
oring of pa
tien
ts with bip
olar disor
der r
ela
ted t
o smar
tphones
, I
nt
ernet ac
tivities
, or w
ear
ables
a New drug applica
tion submitt ed t o FD A b y O tsuk a phar mac
euticals and pr
ot
eus dig
ital health f
or sensor
-embedded A
bilify in S
ept ember , 2015 Technology Sensors Ai m Primar y measur es N Findings Study Ingestible a
Ingestible sensor in tablets
.
W
earable sensor on t
orso
M
easur
e medication adher
‑ ence A dher ence metr ics . L ogs dat e
and time of tablet ingestion
28
Syst
em is f
easible in
patients with BP and SCZ
Kane et al . 2013 Int er
net social media
Diff er entiat e depr ession subg roups b y language use Analyz e t
opics and linguis
‑
tic f
eatur
es in 24 online
communities int er est ed in depr ession
5000 blog posts
Fiv
e distinc
t subg
roups
,
one is BP
. F
or those with
BP
, t
opics on medications
and BP most impor
tant Nguy en et al . 2015 Int er
net social media
Explor
e language diff
er
‑
ences among 10 mental health conditions
Using public Twitt er posts 2008–2015, g roup b y classi ‑
fiers including self
‑r epor ted diag nosis >100 users/g roup; >100 posts/user
Language usage patt
er ns diff er b y condition Coppersmith et al . 2015 Smar tphone A cceler omet er , GPS D et ec
t mood stat
e
Daily mobilit
y (ph
ysical
motion), and tra
vel patt
er
ns
(number of locations visit
ed , time out doors) 12 Can det ec
t a change in
mood stat e. L ess pr ecise to det ec
t mood stat
e Gruener bl et al . 2014 Smar tphone A cceler omet er ; micr ophone D et ec
t mood stat
e
Number of apps running; app usage patt
er
ns and selec
tion. MONAR CA sof twar e 18 Patt er
ns of app usage var
y with self ‑r epor ted mood Alvar ez ‑L ozano et al . 2014 Smar tphone A cceler omet er D et ec
t mood stat
e O verall ac tivit y le vels 9
Substantial individual var
ia
‑
tion in ac
tivit
y le
vels
, both
daily and within int
er vals Osmani et al . 2013 Smar tphone D et ec
t mood stat
e
Number and duration of ingoing and out
going calls;
number of t
ex t messages . MONAR CA sof twar e 61 Patt er
ns of calls and t
ex
ts
var
y in manic and depr
es
‑
siv
e mood stat
es Faur holt ‑J epsen et al . 2015 Smar tphone M icr ophone D et ec
t mood stat
e
Phone call statistics; acoustic emotional analysis
, and social
sig
nals fr
om daily calls
12
Speak
ing length and call
length among the most impor
tant pr edic tors of mood M uar emi et al . 2014 Smar tphone Recor der f or out going speech D et ec
t mood stat
e
Voice monit
or
ing and acoustic
analysis of speech patt
er
ns
from continuously r
ecor ded out going calls 6 Can r ecog niz
e manic and
depr
essiv
e mood stat
es Karam et al . 2014 W earable ( T‑ shir ts) Elec tr
odes and sensors
int eg rat ed int o gar ment D et ec
t mood stat
e
EC
G and r
behavior patterns, and further complicate interpretation
of human behavior (NRC
2013
). Predictive models can
be wrong as shown repeatedly with Google Flu (Lazer
et al.
2014a
,
b
). Predictive models in medical and related
settings can be inconsistent and biased (Singh et al.
2014
), have little clinical impact (Hochster and
Nied-zwiecki
2016
), and may be most appropriate for health
policy and risk stratification rather than individual risk
prediction (Harris et al.
2015
; Wray et al.
2013
; Wharam
and Weiner
2012
).
Analytical challenges
In the future, data from all provider and patient sources
will be integrated, creating massive datasets for analysis.
Massive datasets have issues of scale, heterogeneity,
mul-tidimensional complexity, error handling, privacy,
prov-enance, and many types of biases (NRC
2013
; Monteith
et al.
2015
). If analysis of big data is based on the
clas-sical methods, underlying assumptions are likely to be
violated. Researchers with different backgrounds tend to
have different perspectives on data analysis, using either
statistical (model-based focus on variability) or
algo-rithmic (data mining for patterns and rules) (NRC
2013
;
Mahoney et al.
2008
) techniques. New algorithms for big
data are combining the complementary strengths of both
approaches.
Human judgment is an absolutely critical component
of big data analysis (Wyss and Stürmer
2014
; NRC
2013
).
To optimize the studies of big data for bipolar
disor-der, participation of those with expertise in psychiatry
is required throughout the analytical process, such as
for parameter selection and exclusion, interpretation of
results, and hypothesis generation. For example, just as
Captcha demonstrates the difference between human
and machine image resolution (Datta et al.
2009
),
psy-chiatrist input is needed during the development of
algorithms to interpret the use of language by those with
bipolar disorder.
Conclusions
Big data projects based on the data collected by providers
in EMR, claims, registries, and active patient
monitor-ing are providmonitor-ing valuable information on many aspects
of bipolar disorder for research and clinical care. In the
near future, data from passive patient monitoring will be
available and integrated with the EMR, and diverse data
sources from outside of medicine such as government
financial data will be linked for research. This is only the
beginning. Further on, data from genetics, other omics,
and imaging will also be integrated with the EMR, and
lead to new levels of understanding and improvement in
routine care. Many significant challenges remain for big
data projects, and the active collaboration of psychiatrists
is required throughout the analytical process. Big data
will provide the basis for transforming the understanding
and management of bipolar disorder.
Authors’ contributions
Authors SM and TG were involved in the draft manuscript. All authors contributed to the final manuscript. All authors read and approved the final manuscript.
Author details
1 Michigan State University College of Human Medicine, Traverse City Campus, 1400 Medical Campus Drive, Traverse City, MI 49684, USA. 2 ChronoRecord Association, Inc, Fullerton, CA 92834, USA. 3 Department of Psychiatry, Warneford Hospital, University of Oxford, Oxford OX3 7JX, UK. 4 Department of Psychiatry and Biobehavioral Sciences, Semel Institute for Neuroscience and Human Behavior University of California Los Angeles (UCLA), 300 UCLA Medical Plaza, Los Angeles, CA 90095, USA. 5 Department of Psychiatry and Psychotherapy, Universitätsklinikum Carl Gustav Carus, Technische Univer‑ sität Dresden, Fetscherstr. 74, 01307 Dresden, Germany.
Competing interests
The authors declare that they have no competing interests.
Received: 12 February 2016 Accepted: 23 March 2016
References
Abrams TE, Vaughan‑Sarrazin M, Rosenthal GE. Variations in the associations between psychiatric comorbidity and hospital mortality according to the method of identifying psychiatric diagnoses. J Gen Intern Med. 2008;23:317–22.
Aiff H, Attman PO, Aurell M, Bendz H, Ramsauer B, Schön S, et al. Effects of 10–30 years of lithium treatment on kidney function. J Psychopharma‑ col. 2015;29:608–14.
Allebeck P. The use of population based registers in psychiatric research. Acta Psychiatr Scand. 2009;120:386–91.
Alvarez‑Lozano J, Osmani V, Mayora O, Frost M, Bardram J, Faurholt‑Jepsen M, et al. Tell me your apps and I will tell you your mood: correlation of apps usage with bipolar disorder state. In: ACM Proceedings of the 7th international conference on pervasive technologies related to assistive environments. New York: ACM; 2014. p. 19.
Arthur C. Google’s growing problem: 50 % of people do zero searches per day on mobile. 2015. https://www.theoverspill.wordpress.com/2015/10/19/ searches‑average‑mobile‑google‑problem/. Accessed 19 Jan 2016. Bagalman E, Muser E, Choi JC, Durden E, Macfadden W, Haskins JT, et al. Health
care resource utilization and costs in a commercially insured popula‑ tion of patients with bipolar disorder type I and frequent psychiatric interventions. Clin Ther. 2011;33:1381–90.
Baldessarini RJ, Leahy L, Arcona S, Gause D, Zhang W, Hennen J. Patterns of psychotropic drug prescription for U.S. patients with diagnoses of bipolar disorders. Psychiatr Serv. 2007;58:85–91.
Banaee H, Ahmed MU, Loutfi A. Data mining for wearable sensors in health monitoring systems: a review of recent trends and challenges. Sensors (Basel). 2013;13:17472–500.
Bauer MS, Crits‑Christoph P, Ball WA, Dewees E, McAllister T, Alahi P, et al. Inde‑ pendent assessment of manic and depressive symptoms by self‑rating. Scale characteristics and implications for the study of mania. Arch Gen Psychiatry. 1991;48:807–12.
Bauer M, Grof P, Gyulai L, Rasgon N, Glenn T, Whybrow PC. Using technology to improve longitudinal studies: self‑reporting with ChronoRecord in bipolar disorder. Bipolar Disord. 2004;6:67–74.
Bauer M, Wilson T, Neuhaus K, Sasse J, Pfennig A, Lewitzka U, et al. Self‑ reporting software for bipolar disorder: validation of ChronoRecord by patients with mania. Psychiatry Res. 2008;159:359–66.
Bauer M, Glenn T, Alda M, Sagduyu K, Marsh W, Grof P, Munoz R, et al. Drug treatment patterns in bipolar disorder: analysis of long‑term self‑ reported data. Int J Bipolar Disord. 2013b;1:5.
Bayley KB, Belnap T, Savitz L, Masica AL, Shah N, Fleming NS. Challenges in using electronic health record data for CER: experience of four learning organi‑ zations and solutions applied. Med Care. 2013;51(8 Suppl 3):S80–6. Berger ML, Doban V. Big data, advanced analytics and the future of compara‑
tive effectiveness research. J Comp Eff Res. 2014;3:167–76. Bilton N. Data without context tells a misleading story. The New York Times.
2013. http://www.bits.blogs.nytimes.com/2013/02/24/disruptions‑ google‑flu‑trends‑shows‑problems‑of‑big‑data‑without‑context/?_ r=0. Accessed 19 Jan 2016.
Binder H, Blettner M. Big data in medical science–a biostatistical view. Dtsch Arztebl Int. 2015;112:137–42.
Bjørklund L, Horsdal HT, Mors O, Østergaard SD, Gasse C. Trends in the psychopharmacological treatment of bipolar disorder: a nationwide register‑based study. Acta Neuropsychiatr. 2015;11:1–10.
Blair DR, Lyttle CS, Mortensen JM, Bearden CF, Jensen AB, Khiabanian H, et al. A nondegenerate code of deleterious variants in Mendelian loci contrib‑ utes to complex disease risk. Cell. 2013;155:70–80.
Bloechliger M, Rüegg S, Jick SS, Meier CR, Bodmer M. Antipsychotic drug use and the risk of seizures: follow‑up study with a nested case‑control analysis. CNS Drugs. 2015;29:591–603.
Bocchetta A, Ardau R, Fanni T, Sardu C, Piras D, Pani A, et al. Renal function during long‑term lithium treatment: a cross‑sectional and longitudinal study. BMC Med. 2015;13:12.
Bopp JM, Miklowitz DJ, Goodwin GM, Stevens W, Rendell JM, Geddes JR. The longitudinal course of bipolar disorder as revealed through weekly text messaging: a feasibility study. Bipolar Disord. 2010;12:327–34. Boulden, J. Will artificial intelligence kill the smartphone? CNN Mon