R E S E A R C H
Open Access
Real time detection system for rail surface
defects based on machine vision
Yongzhi Min
*, Benyu Xiao, Jianwu Dang, Biao Yue and Tiandong Cheng
Abstract
The detection of rail surface defects is an important part of railway daily inspection, according to the requirements of modern railway automatic detection technology on real-time detection and adaptability. This paper presents a method for real-time detection of rail surface defects based on machine vision. According to the basic principle of machine vision, an image acquisition device equipped with LED auxiliary light source and shading box has been designed and the portable testing model is designed to carry on the field experiment. In view of the real-time requirement, the method of extracting the target area from the original image is carried out without image pre-processing. The surface defects of the rail are optimized based on morphological process and the characteristics of the defects are obtained by tracking the direction chain code. It is demonstrated that the maximum positioning time of this proposed method is 4.65 ms and its maximum positioning failure rate is 5%. The real-time detection speed of this proposed method can reach 2 m/s, which can carry out real-time detection of artificial hand walking. The time of processing each picture is up to 245.61 ms, which ensures the real-time performance of the portable track defect vision inspection system. To a certain extent, the system can replace manual inspection and carry out the digital management of track defects.
Keywords:Machine vision, Defects detection image enhancement, Morphological processing, Direction chain code
1 Introduction
The railway track, including rail, sleeper, and fastener, is the most important infrastructure of the railway. Due to the long-term impact of the train and the natural envir-onment on the railway, a variety of defects will be formed on the rail, which will jeopardize the safety of the railway, such as the deformed rail and broken sleeper [1]. These changes on the surface of the railway are caused by defects and can be directly seen by the
worker’s eyes; therefore, the patrol inspection method by
sight can be used for first detecting the defects of the railway. At present, the track surface defect detection mainly relies on manual inspection, but this method is labor-intensive, has lower efficiency, and influences re-sults easily; it cannot meet the needs of daily inspection of the modern railway, especially the China High-speed Railway (CRH). As the daily inspecting time of CRH is always scheduled quickly and at night to avoid disrupt-ing the regular operation of the train, there is not
enough light and the workers tire easily so that it is hard
to get a creditable inspection result from workers’eyes.
Therefore, it is urgent to find faster and more efficient automatic detection equipment to carry out the
real-time detection of the track in the operation line [2–4].
The research mainly aims at the common rail surface defects, such as cracks, peeling, scratches, folds, broken rails, scars, and other forms [5].
In recent years, much research on the automatic de-tection of railway faults have been launched in major universities and railway institutes. A method to achieve the direct extraction of the surface defects of rail by the improved value of minimizing the maximum between class variance has been proposed by Mao et al., but the accuracy of the suggested method needs to be improved [6]. Tang et al. used gray level projection to realize rapid segmentation of the rail surface region, but the algo-rithm has poor adaptability [7]. Yuan et al. use the im-proved Ostu algorithm to segment the rail image and obtains the rail surface area, but the threshold selection of this method is not universal [8]. He et al. used the mean background subtraction algorithm to extract the * Correspondence:[email protected]
School of Automation and Electrical Engineering, Lanzhou Jiaotong University, Lanzhou 730070, China
rail surface defects, but the robustness of the algorithm was weak [9].
Guo et al. studied the position correction method of the detection equipment in the long line, which mainly used the track of the track mark image to carry on the position through the linear search [10]. According to the characteristics of uneven illumination, occlusion, and complicated environment, Li et al. established the sparse representation model of the defect image [11].
The existing research mainly focuses on the accuracy of the surface defect detection system. However, accord-ing to the requirements of the system in field applica-tion, it is necessary to reduce the computational cost of the algorithm as much as possible, making the algorithm with better real-time detection and adaptability [12].
This paper presents a method based on machine vision for real-time detection of track surface defects and a basis system of machine vision detection. First, the system can ensure access to high-quality images from a stable light source environment by adding the hoods and LED auxiliary light source in the image acquisition equipment. Then, the H value of the color image is used to directly extract the original image, which can shorten the time of image pre-processing and is good for a target area with a small range. Based on morphological processing, the interference of a large amount of redun-dant information is removed and the contour of the direction chain code is used to quickly extract the defect shape feature to carry out the defect type identification. In order to ensure the adaptability of the system in a complex environment, the issues of adaptive dual threshold selection in edge detection combined with the histogram concavity analysis have been solved.
2 Rail surface defect detection system
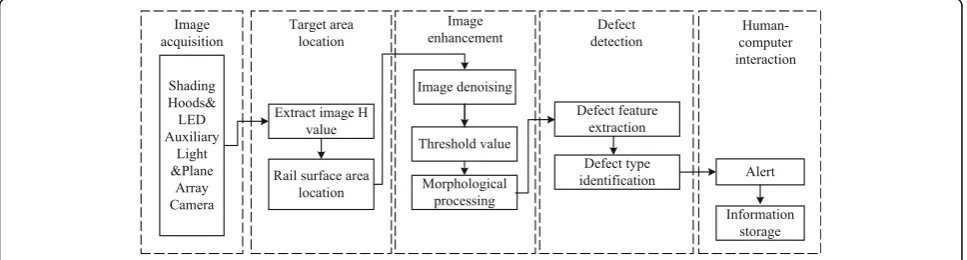
The track surface defect detection model is shown in Fig. 1; it includes five parts: image acquisition; target area location; image enhancement; defect detection; and
human–computer interaction [13]. In the image
acquisition part, in order to reduce the influence of the external complex illumination condition on the track surface defect detection system, the shading hoods and the auxiliary LED light source were added to provide a stable light environment for image capture. The function of the target area location part was to rapidly locate the target area in the captured image so that it can save image processing time later. The image enhancement part was mostly to enhance the character of the target area. The defect detection part uses lower complexity operation methods for rapid detection of the defective
track. The human–computer interaction part displays
the real-time result, recording the detected result and giving an effective alert. These parts combine a whole device for fast detection of the defects of a railway track.
3 Rail area rapid locating method
In actual defect detection, the track defects are de-tected in real-time and the system has strict require-ments for the detection time. Therefore, in the detection system, first, the rail area is quickly located from the detected image, thus saving time for subse-quent processing. This paper proposes a method by using the target area hue mutation to rapidly located target areas in the detecting image.
Hue, saturation, and lightness (HSL) are a standard of color in the industry, including all the colors that human vision can perceive. Red/green/blue (RGB) color models in cylindrical coordinates is one method, where H (Hue, hue) is the first feature of color and is the most accurate criterion for distinguishing different colors. The hue characteristic is stable and varies lit-tle with the illumination condition. Under certain illumination condition, this feature can be considered as unaffected by the external illumination. The H (Hue, Hue) value in the HSL color space is easily cal-culated by using the RGB space in the color image. The conversion of RGB color space to HSL color space can be realized by Eq. 1 [14]:
H¼
arccos
R−G
ð Þ þðR−BÞ
½
2
ffiffiffiffiffiffiffiffiffiffiffiffiffiffiffiffiffiffiffiffiffiffiffiffiffiffiffiffiffiffiffiffiffiffiffiffiffiffiffiffiffiffiffiffiffiffi
R−G ð Þ2þ
R−G ð ÞðR−BÞ
q 8 > > > > < > > > > : 9 > > > > = > > > > ;
B>G
2π−arccos
R−G
ð Þ þðR−BÞ
½
2
ffiffiffiffiffiffiffiffiffiffiffiffiffiffiffiffiffiffiffiffiffiffiffiffiffiffiffiffiffiffiffiffiffiffiffiffiffiffiffiffiffiffiffiffiffiffi
R−G ð Þ2þ
R−G ð ÞðR−BÞ
q 8 > > > > < > > > > : 9 > > > > = > > > > ;
B≤G
8 > > > > > > > > > > > > > > < > > > > > > > > > > > > > > :
ð1Þ
3.1 Track image feature analysis
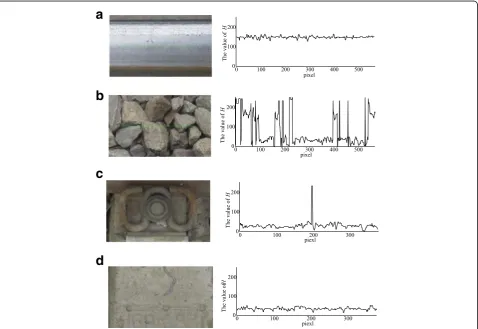
The track area usually consists of rail, ballast, sleeper, and fasteners; their characteristics and H values are different in the detecting image, as shown in Fig. 2.
(1)In Fig.2a, the value of H in the rail surface area is high as a whole and has small mutations.
(2)In Fig.2b, the value of H has a larger mutation in the stone ballast area.
(3)In Fig.2c, the H value curve of the elastic strip area is not stable and has large mutations. In addition, the H values in this area are generally small.
(4)In Fig.2d, the H value curve of the sleeper area is small and smooth.
It is easy to see from above that the mutation of the H value curve of the rail itself can be used as the basis of judgment of the rail surface area.
3.2 Target region location algorithm based on H value feature
Assuming that the geometric position of each point in the track space corresponds to each pixel in the detected image, the track space is completely mapped to the pixel space of the detected image, assuming the camera is calibrated and normalized. The actual width of the rail can be expressed and calculated by the pixel number of the rail image.
First, the image coordinate systemOxyis established and
the lower-left corner of the image is taken as the
coordinate origin O; the two sides of the image are the
x-axis and they-axis, respectively, as shown in Fig. 3. If the
image size isu*v, and (x,y) is used to represent a certain
pixel in the image, the range of values ofxandyare {x|0≤
x≤u,x∈N+} and {y|0≤y≤v,y∈N+}, so that the H value
in the HSL space of the corresponding point ish(x,y).
a
b
c
d
If all the characteristics of the H value curve in each column of the whole image are analyzed, it has lower ef-ficiency and is not conducive to judge the rail surface boundary. To this end, the captured images are divided
vertically along the positive direction of the x-axis and
the H value mutation points on the bisector are searched
in the positive direction of the y-axis to reduce the
search workload and improve the efficiency.
Then, definenas the number that an image be equally
divided and the H value h(xp,y) of the point (xp, y) on
thep-line. We usetto represent mutation of H value in
an image; the value oftis defined as Eq. 2.
t¼0; h xp;y−h x p;y−1≤h xp;y
þh xp;y−1
2 ; p0≤p≤n;p∈N
þ
j
f g
t¼1; h x p;y−h xp;y−1>h xp;y
þh xp;y−1
2 ; pj0≤p≤n;p∈N
þ
8 > > > > < > > > > :
ð2Þ
In the case oft= 1, it is recorded as a mutation point
on thep-th bisection line. If the p-th bisection line
can-not find any mutation point, it is assumed that the unit
step is d¼ uc
n25 (where uc is the camera horizontal
pixel). To re-determine the mutation point, use one of the ten lines which are parallel to the bisection line in the range of about five steps on the left and right sides. When the entire straight line is judged and the mutation point of H value is found, the search for other lines in the set range is stopped. If we still cannot find the muta-tion point, in order to avoid falling into the search di-lemma, set the sub-line point of the mutation point as
(xp, 0); it will be directly removed in the follow-up
discrimination.
Due to the limited view field of the camera and the curvature of the turning train being far greater than the view field, the edge of the rail can be considered as a straight line in the camera view field and without
considering the change in the relative position of the camera and the rail when the train turns.
Next, assume the mutation points of the two adjacent
H value in the p-line are (xp,yq) and (xp,yq+ 1).
Com-parison of the pixel width of the rail with the mutation points are shown in Eq. 3.
yqþ1−yq
≤wr ð3Þ
In Eq. 3,wris the amount of the pixels of rail width in
the detecting image. If (xp,yq) and (xp,yq+ 1) satisfy the
determination of the rail boundary points in Eq. 3, the (xp,
yq) is the lower boundary point of the rail surface and the
(xp,yq+ 1) is the upper boundary point of the rail.
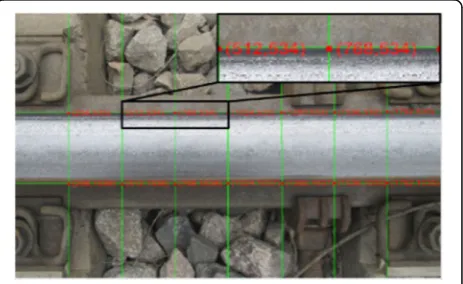
Through linear fitting of the n boundary points, it is easy to obtain the upper and lower edges of the rails so that the rail area in the image can be quickly deter-mined, as shown in Fig. 4.
4 Rail surface defect detection 4.1 Rail surface area image enhancement
In the process of image acquisition, it is easy to interfere with the influence of external light, foreign body occlu-sion, car body shaking, and other factors, the noise will inevitably exist in the original image [15]. The noise will directly or indirectly affect the detection effect of the al-gorithm, so it is necessary to filter the image.
Median filtering is used to sort the gray values of each pixel in the filter window and select the median to filter noise [16]. Since median filtering requires a large amount of sorting and long computation time [17], a weighted fast median filtering method is adopted in this paper. The filtering process of this method is as follows.
Assuming the median filter window moves along the
column direction, the pixel gray values ofc1,c2, andc3are
removed from the filter window and the pixel gray values
of d1, d2, and d3are moved into the filter window. The
schematic diagram of filtering process is shown as Fig. 5.
Fig. 4Sketch of boundary fitting results
The gray level series and the correlation of adjacent pixels are shown in Eq. 4:
c1¼d1
c2¼d2
c3¼d3
8 <
: ð4Þ
(1)If Eq.4is established, the output value is unchanged; if the equation is not established, then the next step is to be carried out.
(2)The mean and the median of all pixels in the current window are f1(x, y) and f2(x, y),
respectively.
(3)Give different weights to f1(x, y) and f2(x, y), and
the gray update value of the central pixel of the filtering window can get through Eq. 5:
f0ðx;yÞ ¼f1ðx;yÞ 0:7þf2ðx;yÞ 0:3 ð5Þ
(4)Filtering window center to move to (x,y+ 1) for the next round of computing.
By using the method of weighted fast filter, the rail surface area can be quickly filtered to remove noise, which can improve the operation speed of compared
with the median filter 76.4–79.7% [16].
4.2 Morphological processing based on stroke coding Experts in cognitive psychology, human contour fea-tures are more sensitive than the color and texture features; the stability and robustness of the recogni-tion is high [18]. So, we first use the canny algorithm to convert the image into a binary image and get the image contour. However, when the image is processed
a b
Fig. 5Schematic diagram of filtering process.aPosition relation before filtering.bPosition relation after filtering
into a binary image, the edge of track defect is prone to burrs and edges [19]. This seriously affects the de-tection accuracy of the portable track defect vision inspection system [20].
In the process of morphological transformation of a binary image, the closed operation can fill the smooth contours of the gap [21]. This is due to the fact that closed operations are essentially dilation operations and then etching operations. Therefore, the closed operation can be used to fill the fracture in the contour line, elim-inate the isolated small holes in the target feature, and smooth the protrusion on the edge. But the expansion and corrosion of the closed operation need to analyze each pixel, so it needs to occupy a large amount of com-puting time and memory. So, the optimization of the closed operation process is the key to improve the speed of the image processing algorithm. In this paper, a mor-phological processing method based on stroke coding is used to eliminate the burr and the growth line break (as shown in Fig. 6) and to avoid the processing of a large amount of redundant information.
A set of pixels with the same gray level in each row is called a stroke and each stroke only records the gray level and the pixel length. Therefore, run length encod-ing can be used to compile the key information region of image. By using the range coding to compress the gray level region effectively, the intersection and union of the key information areas will be simplified.
Meanwhile, morphological dilation operations can be regarded as transposed structural elements applied to the operation of Minkowski addition [22] and the correspond-ing expansion image region is obtained by calculation. In this way, the optimization process of morphological closed operation can be realized by using the intersection and
union operations of run length encoding and the commu-tative law and distributive law of Minkowski addition, thus improving the processing speed of morphological closed operation.
According to the experimental results, it is indicated
that the morphological processing based on the
optimization of stroke coding can be applied to a real-time detection system. After the optimization of the image processing, the broken line and the edge burr of the rail defects are eliminated completely, and a smooth and con-nected track defect region is obtained, as shown in Fig. 7.
4.3 Directional chain code contour tracking
By optimizing the edge details of the defect region, the contour of the target becomes obvious. Based on the rela-tionship between the defect region and the boundary, it is convenient to follow up the measurement by using the chain code to track the contour information [23]. This paper uses the direction chain code tracking algorithm to extract the contour information of the defect region.
This method is based on contour point information tracking, which can avoid searching the whole image, improving the efficiency of the algorithm. The chain code tracking process is as follows:
(1)The center pixelLis encoded in an anti-clockwise direction, which is coded to eight adjacent points, as shown in Fig.8.
Fig. 8The direction chain code of pixel L
Fig. 7Morphological processing results based on stroke coding
a
b c
Fig. 9Rail surface defect profile screenshot.aDefect A.bDefect B. cDefect C
Table 1Defect feature description parameters
Features Physical meaning Descriptive meaning
Area The total number of pixels in the boundary and the inner area of the boundary
Express the size of defect
Rectangularity The ratio of the area of the defect area to the area of the minimum external moment
Express the degree of fullness of the defect region in the outer rectangle
Length–width ratio
The ratio of the length and width of the minimum circumscribed rectangle
Reflect the shape of the defect region
Density The ratio of the square of the perimeter to the area
(2)The rail surface area image is scanned; when a contour point is obtained, the line scan is stopped and the coordinates of the point (x1,y1) recorded.
(3)According to the direction of chain code tracking, (x1,y1) is the center and the adjacent points are
scanned. If the defect contour point (x2,y2) is
scanned, tracking is stopped and the recording point (x1,y1) of the direction of chain code value for the
scan to the outline of the code, and then continue to step 3; if the contour points are not scanned, the contour tracking is stopped.
(4)With the background color filling point (x1,y1),
point (x2,y2) as the center, carry out step 2.
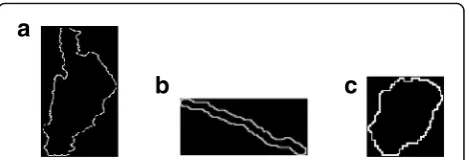
The above steps will get all chain code sequences of the contour defect, realizing the accurate extraction of the rail surface defect area and the sequence of contour lines is helpful for subsequent processing and measure-ment. Some obtained contours of rail surface area defect are shown as Fig. 9.
Because of the complex shape of rail surface defect, the single feature description parameter cannot describe the defect exactly and comprehensively. For this reason, the defects are described and recorded considering the
combination of various parameters [24]. The description parameters of the defect features are shown in Table 1.
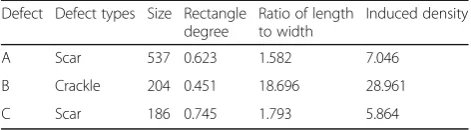
Different types of defects have different effects on the composition of track performance. In the process of re-cording the characteristic information of defects, it can be simply classified so as to predict the influence of de-fects. In this paper, the defect categories are divided into two categories [25], scar and crackle, according to the aspect ratio. The classification of defects and the record-ing of characteristic information are shown in Table 2.
5 Experimental discussion and results 5.1 System implementation
According to the track defect detection method based on machine vision, this paper designs a portable vision inspection system for track defects and develops a port-able track defect vision inspection prototype, as shown in Fig. 10. The prototype components can be quickly as-sembled and disasas-sembled; the daily inspection and re-cording work of the rail surface defects can be completed by single hand push mode.
The device of defect detecting consists of shading hoods, auxiliary lights, cameras, computer, battery, and portable trolley, as shown in Fig. 11. The camera works in trigger mode with LED light. The image processing algorithms can be generalized to two steps, namely image enhancement and image analysis. Image enhancement is used to pre-process the original image and segment the image to highlight the feature information, and to weaken or eliminate the interfer-ence of background information. In image analysis, by extracting the features (statistical features, shape Table 2Defect characteristic information
Defect Defect types Size Rectangle degree
Ratio of length to width
Induced density
A Scar 537 0.623 1.582 7.046
B Crackle 204 0.451 18.696 28.961
C Scar 186 0.745 1.793 5.864
features, geometric features, texture features, etc.) of the object under test, the process of decision-making is obtained by using the default criterion. In practical applications, image enhancement usually takes up a large proportion of system processing time and im-proved image enhancement can reduce the computing time of the vision detection system.
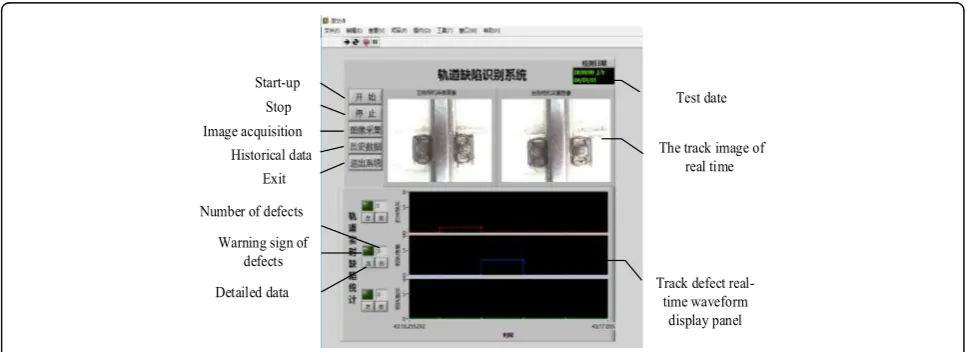
In this paper, we used LabVIEW to write the software system; the track defect recognition system interface is shown in Fig. 12. The system for the real-time display of an image picture, in the form of text to display the current picture detection demerit, curve form record test results. The track defect recognition system can continuously collect, process the image and record, save the detection results, the original text data format con-tains the measuring time, the number of image defects, and historical data. The horizontal coordinate of the data curve is the measuring time and the measuring data change dynamically with the measuring time.
5.2 Target location experiment
In order to analyze the influence of different equal values
ofnon the recognition speed and recognition failure rate,
and test the influence of changing condition of large span illumination intensity on test result, we carried out experi-ments with the fast recognition algorithm for rail surface area. These experiments were carried out under ideal con-ditions (light intensity suitable, uniform illumination),
with the acquisition of 100 track images, taking differentn
values to locate, calculating the average processing time and extraction failure rate of each group of pictures. The statistical results are shown in Fig. 13.
By measuring the location time and the failure rate,
whenn= 8, the best effect can be achieved, the location
time is 4.65 ms, and the failure rate is 5%.
Whether the target area can be extracted accurately is very important to the detection system and because the portable track defect visual inspection system is mainly used for outdoor rail inspection. Therefore, it is necessary
Fig. 11Track surface fault inspection system
to have a strong adaptability to the change of illumination intensity. In order to verify the validity of the proposed al-gorithm under different light intensity and verify the dif-ference between the performance of the algorithm based on H value and the traditional Otsu method, a compara-tive experiment is set up: considering three groups of light intensity range corresponding to night,
morning/after-noon, and morning/after-noon, respectively (500–1000 lx, 1000–10,000
lx, 10,000–100,000 lx), and two types of track were
col-lected (wood, concrete sleeper). The result of extraction failure rate and extraction time is shown in Fig. 14.
It can be seen from Fig. 14 that the location algorithm based on H value is better than the location algorithm based on the maximum interclass difference method in
the two parameters of the extraction failure rate and the extraction time; in different light conditions, the posi-tioning method based on H value has good adaptability. The experimental results show that the algorithm can be applied to track inspection in complex environment and lay a good detection foundation for the portable track defect visual inspection system.
5.3 Testing experiment of rail surface defect
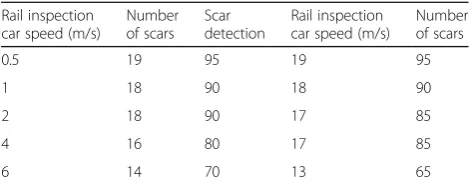
Due to the lack of an existing rail line that contains continuous scars and crack defects, select different lines, respectively, at different speeds through the de-fect area, to detect the accuracy of statistics. Among them, 20 of the scar defects and 20 crack defects
Fig. 13The testing results of different n
a
b
were tested by 0.5 m/s, 1 m/s, 2 m/s, 4 m/s, and 6 m/s to get the best detection speed and the detection accuracy of the rail surface defects.
The experimental results (are shown in Table 3) show that the portable track defect vision detection system can work under the speed of 2 m/s (that is consistent with the people normal walking speed of 5 km/h), realiz-ing the real-time detection of track defects.
6 Conclusion
This paper proposes a rail surface real-time visual detec-tion method, focusing on the target locadetec-tion and rail sur-face defects contour extraction, to achieve the detection requirements through the use of the structural charac-teristics of the existing target to simplify the calculation. LabVIEW was used to write the algorithm program to achieve a portable track defect visual inspection system, based on the machine vision of the portable track inspec-tion car to carry out the field experiment. Through the test of the target area location under the different sub-value, the best value of the target area location algorithm is determined. Using the image acquisition site and part of the manual synthesis, defect images verify the effective-ness of rail surface defects detection and detection time meets the requirements of real-time detection, can be in a certain extent instead of manual inspection. Due to the limited time, the portable track defect visual inspection system is only a preliminary realization of the track defect detection automation. Further research is needed: mea-sures for preventing the influence of the uneven light on
the rail surface on the defects of the rail and the station’s
throat area and rapid discrimination of the occlusion; measures to complete the whole line real-time detection and other issues under the existing train speed; and mea-sures to better facilitate the application of real-time detec-tion of existing lines.
Funding
The authors would like to thank the National Natural Science Fund (No. 61663022 and No. 61461023), the Program of Innovation team development plan of Ministry of education (IRT_16R36), the Program for Excellent Team of Scientific Research in Lanzhou Jiaotong University (201701), and the Open Subject of the Program of Key Laboratory of high altitude traffic information engineering and control in Gansu Province (No. 201702) for financial support.
Availability of data and materials
The datasets used and/or analyzed during the current study are available from the corresponding author on reasonable request.
Authors’contributions
YM did the major part of the work. Other authors give the data and related experiments. All authors read and approved the final manuscript.
Authors’information
Yongzhi Min was born in Shaanxi, China in 1975. He received the B.S. degree in Electrical Engineering and Automation from Shaanxi Institute of Technology, Hanzhong, China in 1992 and the M.S. degree in Measurement Technology and Instrument from Wuhan University, Wuhan, China in 2004. He received his Ph.D. in Traffic Information Engineering and Control from Lanzhou Jiaotong University, Lanzhou, China in 2014. He is currently an Assistant Professor with the Department of Electrical and Computer Engineering, Lanzhou Jiaotong University, Lanzhou, China. His current research interests include electrical engineering, computer vision, and intelligent detection with imaging.
Benyu Xiao was born in Hunan, China in 1993. He received the B.S. degree in Electrical Engineering and Automation from Lanzhou Jiao Tong University, Lanzhou, China in 2015. He is currently pursuing the M.S. degree in Lanzhou Jiao Tong University, Lanzhou, China. His current research interests include machine vision and intelligent detection.
Jianwu Dang was born in Shaanxi, China in 1963. He received a Bachelors degree in the Lanzhou Railway Institute in June 1986, received a Masters degree in Southwest Jiaotong University in 1992, and obtained his Ph.D. from Southwest Jiaotong University in 1996. He is a Professor at the School of Electronic & Information Engineering, Lanzhou Jiaotong University. He mainly engages in software engineering, neural network, and computer applications.
Biao Yue was born in Gansu, China in 1993. He received a B.S. degree in Electrical Engineering and Automation from Lanzhou Jiao Tong University, Lanzhou, China in 2015. He is currently pursuing the M.S. degree in Lanzhou Jiao Tong University, Lanzhou, China. His current research interests include intelligent detection and image processing.
Tiandong Cheng was born in Shaanxi, China in 1991. He received the B.S. degree from the School of Physics and Electrical Engineering at Weinan Normal University, Weinan, China in 2014. He is currently pursuing the M.S. degree in Lanzhou Jiaotong University, Lanzhou, China. His current research interests include digital image processing and pattern recognition.
Ethics approval and consent to participate Not applicable.
Consent for publication Not applicable.
Competing interests
These no potential competing interests in our paper. And all authors have seen the manuscript and approved to submit to your journal. We confirm that the content of the manuscript has not been published or submitted for publication elsewhere.
Publisher’s Note
Springer Nature remains neutral with regard to jurisdictional claims in published maps and institutional affiliations.
Received: 28 June 2017 Accepted: 18 December 2017
References
1. Q Li, S Ren, A visual detection system for rail surface defects. IEEE Trans. Syst. Man. Cybern. Part C.6, 1531–1542 (2012)
2. M. Singh, S. Singh, J. Jaiswal, et al., inComputational Intelligence for Homeland Security and Personal Safety, Proceedings of the 2006 IEEE International Conference on. Autonomous rail track inspection using vision based system[a] (2006), pp. 56–59
3. D Zhan, L Yu, J Xiao, et al., Study on track wear cross-section measurement utilizing laser-photogrammetric technique. J. China Railway.36, 32–37 (2014) Table 3Rail surface defect detection results
Rail inspection car speed (m/s)
Number of scars
Scar detection
Rail inspection car speed (m/s)
Number of scars
0.5 19 95 19 95
1 18 90 18 90
2 18 90 17 85
4 16 80 17 85
4. G Tian, B Gao, Y Gao, et al., Review of railway rail defect non-destructive testing and monitoring. Chin. J. Sci. Instrum37(8), 1763–1780 (2016) 5. L Xing,Research on Defect Characteristics and Classification of Higher Speed
Rails(China Academy of Railway Sciences, Beijing, 2008)
6. Z Mao, F Wu, Visual detection algorithm for rail surface defects based on image sensor. Transducer Microsystem Technol.34, 141–144 (2015) 7. X Tang, Y Wang, Visual inspection and classification algorithm of rail surface
defect. Comput. Eng.39(3), 25–30 (2013)
8. X Yuan, L Wu, H Chen, Rail image segmentation based on Otsu threshold method. Opt. Precis. Eng.24(7), 1772–1781 (2016)
9. Z He, Y Wang, J Liu, et al., Background differencing-based high-speed rail surface defect image segmentation. Chin. J. Sci. Instrum.37(3), 640–649 (2016) 10. B Guo, L Zhu, H Shi, et al., Research on track inspection car position correction
method by use of single image. J. China Railway.33, 72–77 (2011) 11. Q Li, Z Liang, Y Huang, et al., Sparseness representation model for defect
detection and its application. J. Comput. Res. Dev51, 1929–1935 (2014) 12. J Lu, Z Ye, Huber fractal image coding based on a fitting plane. IEEE Trans.
Image Process.22(1), 134–145 (2013)
13. M Sonka, V Hlavac,Image Processing, Analysis, and Machine Vision (Tsinghua) (University Press, Beijing, 2011)
14. AR Weeks, HR Myler, Edge detection of color images using the HSL color space. Proc. SPIE–Int. Soc. Opt. Eng.2424, 291–301 (1995)
15. J Lu, L Shen, C Xu, et al., Multiplicative noise removal in imaging: An exp-model and its fixed-point proximity algorithm. Applied and Computational Harmonic Analysis.41(2), 518–539 (2016)
16. G Zhao, L Zhang, F Wu, Application of improved median filtering algorithm to image de-noising. J. Appl. Opt.32, 678–682 (2011)
17. BL Zhu A fast median filtering algorithm. Signal Process. (2008) 18. X Xu, S Ding, Z Shi, et al., New theories and meth-ods of image
segmentation. Acta Electron. Sin.38(2A), 76–82 (2010)
19. S Zhang, MA Karim, A new impulse detector for switching median filters. IEEE Signal Processing Letters11, 360–363 (2002)
20. X Zhang, Y Li, L Li, et al., A new line boundary detection algorithm based histogram of gradient’s direction. Opt. Tech.06, 824–826 (2006) 21. Z Cui, H Zhang, A study on contour extraction method in computer vision
measurement technology. Acta Metrologica Sin.1, 004 (2007)
22. IK Lee, MS Kim, G Elber, Polynomial/rational approximation of Minkowski sum boundary curves[J]. Graphical Model. Image Process.60(2), 136–165 (1998) 23. Y Min, F Kang, J Dang, et al., Study on application of run length encoding
in track visual inspection system. Comput. Eng. Appl.19, 169–172 (2015) 24. M Kim, H Sohn, C Chang, Localization and quantification of concrete surface
defects using terrestrial laser scanning. J. Comput. Civ. Eng., 04014086 (2015) 25. SC Radopoulou, I Brilakis, Automated detection of multiple pavement