ORIGINAL ARTICLE
Olav Høibø · Anders Q. Nyrud
Consumer perception of wood surfaces: the relationship between stated
preferences and visual homogeneity
Abstract Information about people’s preferences as to
wood products is of relevance to several decision makers in the forest sector. Studies revealing consumer preference provide information that can be used for marketing and manufacturing of wood products, but these also provide information of relevance to designers and decision makers involved in building design and construction processes. Pre-vious studies show that the overall harmony of the visual surface is correlated with preference. In this study, per-ceived visual homogeneity is modeled for fi ve copper-impregnated and fi ve organic biocide-copper-impregnated decking materials with different visual quality. The models are based on visual variables. Homogeneity is a function of material-dependent variables (dry knots, knot shape, and splay knot), production-dependent variables (stain), and surplus color, which is a combination of both wood property and treatment. The results imply that homogeneity is infl u-enced by both wood properties and treatment. Producers of decking should, while maintaining a focus on using high-quality raw material, also focus on producing a product with an unstained appearance.
Key words Sawnwood · Preservative treatment · Consumer
preference · Sensory analysis · Homogeneity
Introduction
Studies that reveal consumers’ preferences provide relevant information to decision makers in the forest sector, with respect both to the manufacturing and the marketing of
O. Høibø (*)
Department of Ecology and Natural Resource Management, Norwegian University of Life Sciences, P.O. Box 5003, NO-1432 Aas, Norway
Tel. +47-64-96-5800; Fax +47-64-96-5801 e-mail: [email protected]
A.Q. Nyrud
Norwegian Institute of Wood Technology, NO-0314 Oslo, Norway
wood products and to building design and construction. More knowledge about the appearance of wood can provide competitive advantages for the forest industry and will also, if applied to the development of new products in accor-dance with consumers’ needs and requirements, improve consumer satisfaction and welfare. Preference studies are also relevant from a psychological point of view.
Results from previous preference studies indicate that people’s preferences are affected by product attributes. Brandt and Shook1 conducted a comprehensive review of previous attribute research on forest products and con-cluded that consumers’ quality attributions with respect to forest products can usually be ascribed to the visual and tactile, i.e., tangible, properties of the wood. A few studies had also evaluated the importance of intangible attributes, such as service and environmental impact. Furthermore, Brandt and Shook1
found only a few published articles that had studied end-consumers’ preferences.
A few studies have investigated the relationship between preferences and physical wood properties. In general, these studies have concluded that homogeneous visual proper-ties, for example, wood surfaces with few and evenly dis-persed knots and an even growth ring pattern, are preferred by consumers.2–5
Preference studies are relevant to the industry because they reveal consumers’ taste and prefer-ences, but results from analytical models are particularly important because these studies can be used to predict con-sumer preferences.
An important aspect with respect to consumer prefer-ence is the relationship between wood properties and the aesthetic properties of the material. There is evidence that architects and construction designers choose wooden build-ing materials because wood is perceived as aesthetically appealing,6 but there is little knowledge concerning which wood properties of the wood are related to aesthetic char-acteristics and how they are related. A model developed by Broman3
provides insights into the formation of preference for solid wood products, but so far it has not been empiri-cally validated. Broman claimed that there were three
prop-erties of wood that infl uenced consumer preference:
harmony, activity, and social status. In this article, the
tionship between consumer preferences and perceived homogeneity is modeled.
The present study evaluates consumers’ preferences for wooden decking products. Wooden decking and other outdoor wood applications are usually made from preser-vative-treated wood or naturally durable wood (e.g., heart-wood from pine or oak). Preservative-treated heart-wood is usually pressure-treated using water-based or petroleum-based preservatives, but in recent years modifi ed wood products have also been commercially available, for example, heat-treated wood, acetylated wood, and furfury-lated wood. In the present study, two pressure-treated decking materials were included: Cu-treated wood, for which a traditional copper treatment was used, and wood subjected to metal-free treatment, a new product without toxic metal preservatives.
Both wood properties and product properties affected by the manufacturing process are studied and modeled after the concept of harmony.3
Thus, this study provides new information about how raw material properties relate to end products, how they affect consumer preferences, and how treatment and manufacturing processes infl uence con-sumer preferences. Results from the study can be used to improve products made from treated wood, and they also provide information of relevance to the product develop-ment and innovation processes.
Materials and methods
Ten material samples were evaluated by a sensory panel consisting of trained sensory assessors and approximately 120 potential consumers. Thus, two data sets were available for analysis: (1) descriptive sensory data and (2) stated pref-erence from potential customers. Two wooden decking products, made of Scots pine (Pinus sylvestris), that had been subjected to two different pressure treatments, were used: copper treatment (Wolmanit) and organic biocide treatment (Metal Free). The material samples that were evaluated by the sensory profi lers and customers were made to resemble outdoor residential decks. These sample decks were rectangular, measuring 1000 × 62 × 0 mm, and con-sisted of fi ve parallel boards, each measuring 1000 × 120 × 28 mm, fastened to two perpendicular boards on the
under-side of the deck. The pith under-side of the boards faced up. Five material samples were made for each decking product.
Both decking products were from pressure-treated wood, but because of the treatment method the visual prop-erties of the sample deckings differed. Treatment method affects wood properties such as color and wood density. The wood properties of the raw material used to produce pre-servative-treated products can infl uence the visual proper-ties of the fi nal products; hence, the boards selected for the sample deckings were sorted according to wood quality. Wood properties differ with the quality of the sawnwood used as raw material. Pressure-treated wood products are usually made from sawnwood with a large share of sapwood, which infl uences the quality. The ten material samples are described in Table 1. Figure 1 shows photographs of the different samples.
Sensory analysis
Sensory analysis is a method for identifi cation and measure-ment of product attributes perceived by sight, sound, smell, taste, and touch.7
Sensory methods are classifi ed according to their primary use; usually a distinction is drawn between analytical methods, with the purpose of providing objective descriptions of products (analytical sensory profi ling), and hedonic methods, in which the purpose is to retrieve infor-mation about consumers’ preferences and attitudes toward products (hedonic profi ling).8
Previous experience indicates that sensory analysis can be applied to wood products.5,9,10
The sensory panel consisted of 11 assessors (judges) who were trained in defi ning, understanding, and evaluating product attributes in general. In a discussion with the asses-sors taking different Nordic visual grading rules into account, a list of 23 attributes was chosen. It was empha-sized that the different attributes should be possible to judge by means of a scale from 1 to 9. The method was used by Nyrud et al.5
Before the study, all the assessors were screened for their ability to discriminate between wood samples with small variations in the intensity of the given attribute. All members of the panel were allowed to evalu-ate the samples at individual speed, and the results were recorded on a 15-cm nonstructured scale. The left side of the nonstructured scale corresponded to the lowest inten-sity and had a score equal to 1. The rightmost side of the
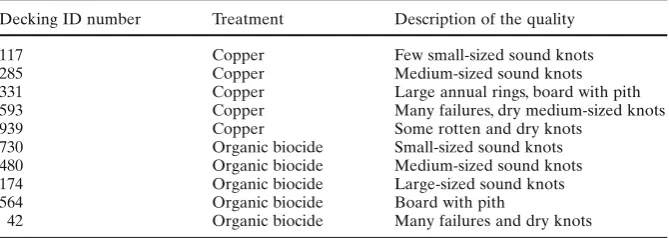
Table 1. Description of material samples
Decking ID number Treatment Description of the quality
117 Copper Few small-sized sound knots
285 Copper Medium-sized sound knots
331 Copper Large annual rings, board with pith
593 Copper Many failures, dry medium-sized knots
939 Copper Some rotten and dry knots
730 Organic biocide Small-sized sound knots
480 Organic biocide Medium-sized sound knots
174 Organic biocide Large-sized sound knots
564 Organic biocide Board with pith
42 Organic biocide Many failures and dry knots
ID, identifi cation
scale had a score equal to 9. The samples were evaluated under identical lighting conditions (ISO 1988). The sensory panel identifi ed 23 attributes for each of the ten decks. The different attributes are described in Table 2.
Hedonic study
Data for the hedonic study were collected during a house and garden fair in the Oslo region in Norway. Material samples were displayed on a stand, and visitors passing the stand were invited to participate in the study. One group of consumers evaluated fi ve decking samples made from cop-per-treated wood (n = 102) and one group evaluated the
decking samples made from wood treated with biocide (n = 119). The respondents were asked to rate their prefer-ence for the samples on a nine-point scale: from 1 (“dislike very much”) to 9 (“like very much”). The respondents were allowed to complete the questionnaire at individual speed. Demographic information was also collected for all respon-dents, i.e., sex, age, living situation (one-family house/row house, apartment, cabin, owners, or renters), education, annual income, experience in woodwork, and plans for remodeling. Descriptive statistics for both groups of respon-dents are provided in Table 3.
Partial least squares regression (PLSR), using The Unscrambler,11
and logistic regression, using JMP,12 was Fig. 1. Photographs of the
deckings investigated, which are described by the numbers in Table 1
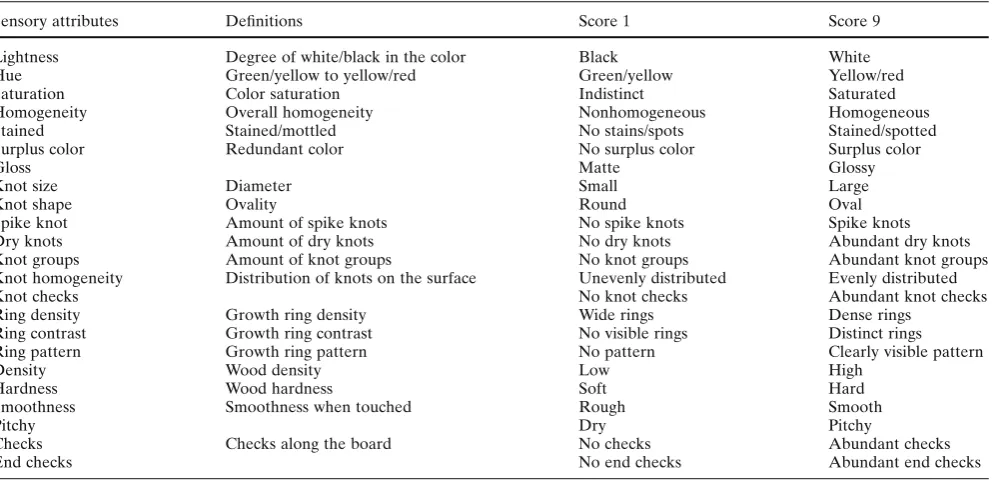
Table 2. Sensory attributes identifi ed by the sensory panel
Sensory attributes Defi nitions Score 1 Score 9
Lightness Degree of white/black in the color Black White
Hue Green/yellow to yellow/red Green/yellow Yellow/red
Saturation Color saturation Indistinct Saturated
Homogeneity Overall homogeneity Nonhomogeneous Homogeneous
Stained Stained/mottled No stains/spots Stained/spotted
Surplus color Redundant color No surplus color Surplus color
Gloss Matte Glossy
Knot size Diameter Small Large
Knot shape Ovality Round Oval
Spike knot Amount of spike knots No spike knots Spike knots
Dry knots Amount of dry knots No dry knots Abundant dry knots
Knot groups Amount of knot groups No knot groups Abundant knot groups
Knot homogeneity Distribution of knots on the surface Unevenly distributed Evenly distributed
Knot checks No knot checks Abundant knot checks
Ring density Growth ring density Wide rings Dense rings
Ring contrast Growth ring contrast No visible rings Distinct rings
Ring pattern Growth ring pattern No pattern Clearly visible pattern
Density Wood density Low High
Hardness Wood hardness Soft Hard
Smoothness Smoothness when touched Rough Smooth
Pitchy Dry Pitchy
Checks Checks along the board No checks Abundant checks
used to analyze the sensory data and the data from the hedonic study. In addition, Tukey–Kramer tests, using JMP,12
were used to test whether the different attributes differed between the different decks.
Results
Results from the sensory evaluation are presented below. Tukey–Kramer tests were applied to determine whether the sensory scores differed between the sample deckings and to provide information concerning which sensory scores are determined by wood quality. Identical superscripts in the tables indicate that there is no statistical difference between the sample deckings. Results for the fi ve copper-treated material samples are reported in Table 4; results for the fi ve biocide-treated material samples are reported in Table 5.
According to the Tukey–Kramer test, sample deckings made from copper-treated wood differed signifi cantly
for ten sensory attributes: homogeneity, surplus color, ring contrast, ring density, checks, knot groups, dry knots, spike knots, knot shape, and knot size (see Table 4).
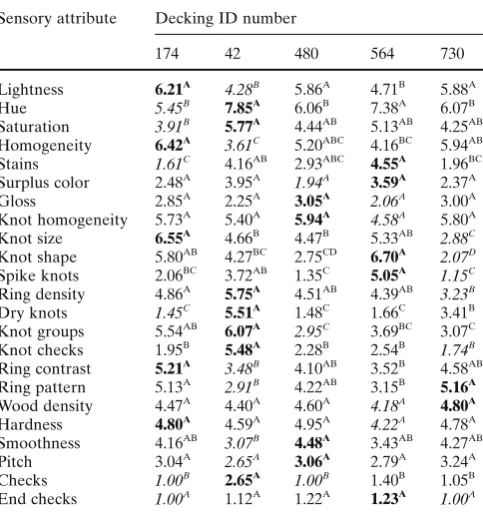
According to the Tukey–Kramer test, sample deckings made from biocide-treated wood differed signifi cantly for 16 sensory attributes: lightness, hue, saturation, homogene-ity, stain, ring denshomogene-ity, ring contrast, ring pattern, smooth-ness, checks, knot groups, dry knots, spike knots, knot shape, knot size, and knot checks (see Table 5).
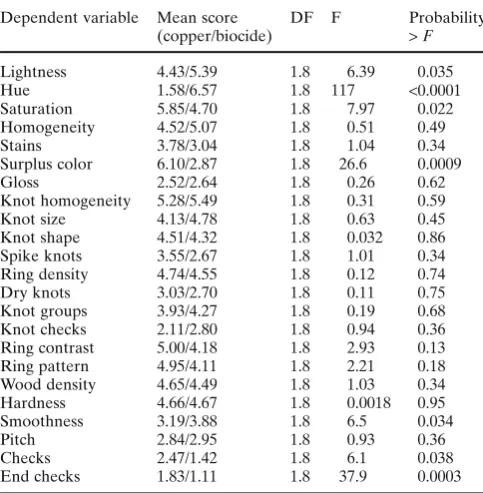
Differences between the copper-treated sample deckings and the biocide-treated sample deckings were also evalu-ated using mean scores for each deck as the basis (Table 6). The copper-treated sample deckings had signifi cantly lower scores for hue compared to the sample deckings from bio-cide-treated wood. The copper-treated sample deckings were somewhat more saturated, somewhat darker, and had more surplus color. The copper-treated sample deckings also had somewhat more checks. Knot properties did not differ signifi cantly between the copper-treated and the bio-cide-treated sample deckings (see Table 6).
Table 3. Respondents and descriptive statistics
Copper-treated material samples
Biocide-treated material samples
Number of respondents 102 119
Sex (% women/men) 54/47 64/55
Age (years) (% 16–35/36–55/>56) 34/49/16 13/42/45
Previous experience (professional or do-it-yourself projects) (%)
56 61
Table 4. Sensory attributes and mean scores for copper-treated sample deckings
Sensory attribute Decking ID number
117 285 331 593 939
Lightness 4.42A 4.47A 4.60A 4.24A 4.41A
Hue 1.70A 1.51A 1.36A 1.45A 1.89A
Saturation 5.55A 5.65A 6.75A 5.87A 5.45A
Homogeneity 5.23AB 4.35BC 6.22A 3.12C 3.69C
Stains 2.65A 4.64A 2.82A 4.25A 4.56A
Surplus color 6.03AB 6.65A 4.41B 7.43A 6.00AB
Gloss 2.55A 2.52A 2.47A 2.15A 2.93A
Knot homogeneity 5.65A 5.51A 4.37A 6.01A 4.85A Knot size 2.55C 3.82BC 6.09A 4.23B 3.95BC Knot shape 2.59C 4.00BC 6.57A 5.35AB 4.05B Spike knots 2.06B 3.46AB 4.45A 4.56A 3.20AB Ring density 3.73C 4.86ABC 4.03BC 5.84A 5.25AB Dry knots 2.75AB 2.25B 1.44B 4.22A 4.46A Knot groups 3.07B 3.87AB 5.37A 4.34AB 2.98B
Knot checks 2.06A 2.23A 1.66A 2.64A 1.98A Ring contrast 5.57A 4.63AB 5.72A
3.83B 5.24AB Ring pattern 5.51A 4.75A 5.49A 3.89A 5.11A Wood density 4.61A 4.77A 4.29A 4.57A 5.00A Hardness 4.79A 4.93A 4.31A 4.49A 4.79A Smoothness 3.20A 3.05A 3.23A 3.13A 3.32A
Pitch 2.80A 2.71A 2.82A 3.06A 2.80A
Checks 2.74AB 3.01A 1.51B 2.93A 2.18AB End checks 2.06A 1.66A 1.56A 1.78A 2.09A
Identical superscripts indicate no statistical difference in sensory score (Tukey–Kramer test, P < 0.05)
Maximum score in bold; minimum score in italic
Table 5. Sensory attributes and mean scores for biocide-treated sample deckings
Sensory attribute Decking ID number
174 42 480 564 730
Lightness 6.21A 4.28B 5.86A 4.71B 5.88A
Hue 5.45B 7.85A 6.06B 7.38A 6.07B
Saturation 3.91B 5.77A 4.44AB 5.13AB 4.25AB Homogeneity 6.42A 3.61C 5.20ABC 4.16BC 5.94AB Stains 1.61C 4.16AB 2.93ABC 4.55A 1.96BC Surplus color 2.48A 3.95A 1.94A 3.59A 2.37A
Gloss 2.85A 2.25A 3.05A 2.06A 3.00A
Knot homogeneity 5.73A 5.40A 5.94A 4.58A 5.80A Knot size 6.55A 4.66B 4.47B 5.33AB 2.88C
Knot shape 5.80AB 4.27BC 2.75CD 6.70A 2.07D
Spike knots 2.06BC 3.72AB 1.35C 5.05A 1.15C
Ring density 4.86A 5.75A 4.51AB 4.39AB 3.23B
Dry knots 1.45C 5.51A 1.48C 1.66C 3.41B Knot groups 5.54AB 6.07A 2.95C 3.69BC 3.07C Knot checks 1.95B 5.48A 2.28B 2.54B 1.74B
Ring contrast 5.21A
3.48B 4.10AB 3.52B 4.58AB Ring pattern 5.13A 2.91B 4.22AB 3.15B 5.16A Wood density 4.47A 4.40A 4.60A 4.18A 4.80A Hardness 4.80A 4.59A 4.95A 4.22A 4.78A Smoothness 4.16AB 3.07B 4.48A 3.43AB 4.27AB
Pitch 3.04A 2.65A 3.06A 2.79A 3.24A
Checks 1.00B 2.65A 1.00B 1.40B 1.05B
End checks 1.00A 1.12A 1.22A 1.23A 1.00A
Identical superscripts indicate no statistical difference in sensory score (Tukey–Kramer test, P < 0.05)
Loadings from the PLS1 (partial least squares regression model to set a single dependent variable) analysis are plotted in Fig. 2. Both samples from copper-treated sample deckings and biocide-treated sample deckings are included. Visual inspection indicates that the loadings for homogene-ity are close to the consumer preferences for PC1 (principal component 1, the only principal component in this analy-sis), compared with most of the other sensory attributes. The loadings in a PLS plot map the positional relationship of the different sensory attributes. The result indicates that the sensory attribute homogeneity (i.e., overall visual texture and evenness) is correlated with the respondent’s preferences through the other sensory attributes important for homogeneity. Results from the sensory study concluded that the mean value for homogeneity varied between 3.12
and 6.22 for the copper-treated sample deckings (see Table 4) and between 3.61 and 6.42 for the biocide-treated sample deckings (see Table 5). The variables with loadings farthest away from the consumer preference (preference) were dry knots, surplus color, ring density, stains, and knot homoge-neity (see Fig. 2).
Results from an ordinal logistic regression between stated consumer preferences and mean sensory homogene-ity (mean score for the judgment of the 11 assessors) for each of the ten sample decking materials are presented in Fig. 3. The relationship between homogeneity (overall visual texture and evenness) and the stated preference was positive and statistically signifi cant (n = 221, DF = 1, χ2= 28.9, P < 0.0001) for both the copper- and the biocide-treated sample deckings. Probability for preference scores 1, 2, and 3 (“do not like”) was high when the homogeneity score was low, and the probability for preference scores 7, 8, and 9 (“like the sample decking”) increased with increas-ing overall homogeneity (Fig. 3).
The signifi cant relationship between homogeneity and preference data indicates that consumer preferences can be predicted from the homogeneity of the surface of the samples. A model for homogeneity was estimated by the means of PLS1: homogeneity was the dependent variable and the remaining sensory attributes were independent variables. The PLS1 regression was performed on data for all sample deckings.
Departing from a full model, including all 22 sensory attributes, a recursive modeling procedure was used to achieve a parsimonious model. Irrelevant sensory variables were discarded based on the loading values and warnings given by the statistical software Unscrambler. The fi nal model is presented in Fig. 4. The model included six explan-atory variables (dry knots, splay knots, knot checks, knot shape, stains, and surplus color) and two principal components.
Surplus color and stains are related to the manufacturing process of the decking products. All remaining sensory attributes were related to knots, indicating that properties Table 6. Comparison of mean scores for copper-treated sample
deck-ings and biocide-treated sample deckdeck-ings using F tests
Dependent variable Mean score (copper/biocide)
DF F Probability
> F
Lightness 4.43/5.39 1.8 6.39 0.035
Hue 1.58/6.57 1.8 117 <0.0001
Saturation 5.85/4.70 1.8 7.97 0.022
Homogeneity 4.52/5.07 1.8 0.51 0.49
Stains 3.78/3.04 1.8 1.04 0.34
Surplus color 6.10/2.87 1.8 26.6 0.0009
Gloss 2.52/2.64 1.8 0.26 0.62
Knot homogeneity 5.28/5.49 1.8 0.31 0.59
Knot size 4.13/4.78 1.8 0.63 0.45
Knot shape 4.51/4.32 1.8 0.032 0.86
Spike knots 3.55/2.67 1.8 1.01 0.34
Ring density 4.74/4.55 1.8 0.12 0.74
Dry knots 3.03/2.70 1.8 0.11 0.75
Knot groups 3.93/4.27 1.8 0.19 0.68
Knot checks 2.11/2.80 1.8 0.94 0.36
Ring contrast 5.00/4.18 1.8 2.93 0.13
Ring pattern 4.95/4.11 1.8 2.21 0.18
Wood density 4.65/4.49 1.8 1.03 0.34
Hardness 4.66/4.67 1.8 0.0018 0.95
Smoothness 3.19/3.88 1.8 6.5 0.034
Pitch 2.84/2.95 1.8 0.93 0.36
Checks 2.47/1.42 1.8 6.1 0.038
End checks 1.83/1.11 1.8 37.9 0.0003
-0.5 0 0.5
-0.5 0 0.5
X- and Y-loadings
Dry knot Surplus colour Ring density Stain
Knot homogeneity Checks Knot checks Spike knot
End checks Knot shape
Knot group Knot size
Ring pattern Ring contrast
Preference
Homogeneity
PC1 PC1
Fig. 2. Partial least squares (PLS)1 plot (one dimension, only one principal component, PC1). Loadings for the different sensory attri-butes (independent variables) for the ten decks and the consumer preference (dependent variable, italic bold)
Probability
0,00 0,25 0,50 0,75 1,00
3 4 5 6
Homogeneity (1-9)
1 2 3 4 5 6 7 8 9
Preference (1-9)
lyzing the same relationship with a multiple regression, spike knot contributed signifi cantly (P = 0.008), whereas dry knot and knot checks received P values of 0.06 and 0.05, respectively. The P value for knot shape was as low as 0.15.
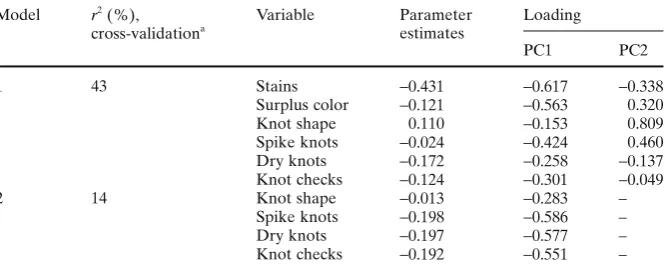
Parameter estimates and loadings for both PLS1 models are reported in Table 7. All parameter estimates are nega-tive, except knot shape in model 1, implying that increased intensity of the variables has a negative effect on homoge-neity. The effect of knot shape is ambiguous because the parameter estimates have opposite signs in model 1 and model 2 (Table 7). Also, in model 2 the parameter estimate for knot shape is close to zero. Because all the independent variables have the same range (values from 1 to 9), the size of the regression coeffi cients implies the relative impor-tance of the variables in the regression model. Furthermore, the loadings give information about the relative importance of each variable on the dependent variable. Independent variables with loadings that differ substantially from the loading of the dependent variable are of more importance than loadings close to the dependent variable. The r2
values in Table 7 are the coeffi cients of determination from the cross-validation of the models (The Unscrambler).
Discussion
The study explores the concept of visual homogeneity, which has been identifi ed in various previous studies but has not been subject to elaborate investigation. Further-more, the study presents an empirical model for surface homogeneity of wood surfaces made from pressure-treated pine. Results from previous empirical studies indicate that there is a close relationship between the visual impression of wood surfaces and stated preference for wood prod-ucts.3–5
Broman3
analyzed aesthetic features of wood and identifi ed a set of key concepts that described respondents’ attitudes toward wood products. According to his results, the most important feature of a wooden surface is the per-ceived harmony of the surface. Nyrud et al.5
provided empirical evidence that Broman’s concept of harmony is related to the degree of homogeneity in the surface of wood
-0.6 -0.3 0 0.3 0.6 0.9
-0.6 -0.4 -0.2 0 0.2 0.4 X- and Y-loadings
Stain Surplus colour
Spike knot
Knot shape
Dry knot Knot checks
Homogeneity
PC1 PC2
Fig. 4. PLS1 analysis: loadings from model 1 (dependent variable in
italic bold)
-0.6 -0.3 0 0.3 0.6
-0.6 -0.4 -0.2 0 0.2 0.4
X- and Y-loadings
Spike knotDry knot Knot checks
Knot shape
Homogeneity
PC1
PC1
Fig. 5. PLS1 analysis: loadings from model 2 (dependent variable in
italic bold)
Table 7. Partial least squares (PLS)1 models predicting surface homogeneity of sample deckings, loadings, and parameter estimates: model 1 refers to Fig. 4 and model 2 refers to Fig. 5
Model r2 (%), cross-validationa
Variable Parameter
estimates
Loading
PC1 PC2
1 43 Stains −0.431 −0.617 −0.338
Surplus color −0.121 −0.563 0.320
Knot shape 0.110 −0.153 0.809
Spike knots −0.024 −0.424 0.460
Dry knots −0.172 −0.258 −0.137
Knot checks −0.124 −0.301 −0.049
2 14 Knot shape −0.013 −0.283 –
Spike knots −0.198 −0.586 –
Dry knots −0.197 −0.577 –
Knot checks −0.192 −0.551 –
PC, principal component
a The r2 values are the coeffi cients of determination from the cross-validation of the models (The
Unscrambler)
ana-products. Therefore, harmony can be identifi ed with homo-geneous visual texture (homogeneity).
Results from multivariate statistics and logistic regres-sion indicate that consumers’ stated preference for wood products is closely related to the sensory attribute homoge-neity. This attribute is subsequently modeled based on the remaining sensory attributes measured by the sensory panel. The results imply that measurements of visual wood properties can be used to model the visual homogeneity of a wooden surface and that the perceived harmony of a surface can successfully be modeled from data about wood features such as knot properties. The result corresponds to previous research and implies that subjective evaluation of wood surfaces, such as preference, can be modeled using wood properties.
The results demonstrate that surface homogeneity is infl uenced by visual wood properties. According to the results from the statistical model, surface homogeneity can be modeled as a function of knot shape and knot defects as well as residual color from the pressure treatment. It is concluded that homogeneity can be given as a parsimonious model with only six independent variables (stains, surplus color, knot shape, dry knots, spike knots, and knot checks). The results therefore indicate that surface homogeneity is determined by wood quality and by properties related to treatment method and the manufacturing process.
Focusing on wood quality, a second model was estimated using only wood properties (i.e., knot shape, dry knots, spike knots, and knot checks). The explanatory power of this second model is inferior to the previous model, but it still provides suffi cient results for predicting surface homo-geneity, and Broman’s3
concept of visual harmony can therefore be modeled using information about the wood quality of a given product. Thus, it is likely that surface homogeneity can be modeled using wood properties for all types of visual wood products.
From the models, it is evident that knot properties infl u-ence the visual homogeneity of, and thus the preferu-ence for, wood surfaces. The results coincide with previous research conducted in Japan. Nakamura and Kondo13
examined why knots are perceived to be a poor visual characteristic of the wood surface; they compared the number of knots in wood panels with subjective perception of knots. The results revealed that there was a clear linear relationship between the number of knots in the wood and the subjective percep-tion of the knots. Nakamura and Kondo concluded that clear wood leads to more relaxed eye patterns than knotty wood. This opinion corresponds with the results reached in the present study and in Broman’s previous studies.3
Most consumers have no experience in evaluating wood products and are, in particular, less experienced with dif-ferentiating wood material samples according to quality compared to professional graders. In particular, persons with little or no experience can have diffi culties detecting small variations in quality, as was the case in the present study; the quality difference between some of the sample decking materials was fairly small. Furthermore, discrete variables, such as the nine-point scale, usually exhibit larger measurement error than continuous variables. Because
preference is a subjective matter, the dependent variable will exhibit considerable variation for all values of the independent variables. Because of this, the diagnostic sta-tistics (P values and r2
values) from PLS1 models and the multiple regressions were low (see Table 7). The models explaining product homogeneity had plausible parameter estimates.
In general, the results should be relevant for decision makers involved in forest product sales and marketing as well as architects and professionals in building design and construction. Raw material quality is important with respect to providing a harmonious surface property; wood qualities with few knots and an even knot structure should be preferred for visual products. However, the results indi-cate that it is equally important to avoid production defects. The wood processing industry should therefore take care to choose appropriate raw material quality as well as conduct manufacturing and treatment properly to avoid color stains.
Architects and professionals in building design and con-struction should take into account the results from the present study when using visual wood products. To exploit possible benefi cial effects of wood surfaces and create a pleasant, harmonious visual atmosphere, the wood used should exhibit homogeneous surface properties. Results obtained from the model indicate that homogeneous surface properties are wood properties with few knots and/or even knot structure. Visual defects such as dry knots should be avoided. In addition, surface-treated wood should not exhibit visual defects from the manufacturing process such as stains or cracks.
Future research should evaluate the relationship between surface homogeneity and consumer preferences for other wood products. The results discussed here are probably relevant for other visual wood products, but this relationship should also be established through research. Furthermore, the relationship between surface homogene-ity and Broman’s concept of harmony should be elabo-rated. Previous research indicates that there is a relationship between the use of building materials from wood and the well-being of the building’s inhabitants.14,15
The present study is of relevance in this respect as the benefi cial effects of wood will probably be strengthened by using wood sur-faces that have advantageous visual characteristics, i.e., when the surface has a homogeneous, harmonious appear-ance. It is likely that the perceived harmony of a visual wood product has benefi cial psychological effects on the consumer’s environment, but there may also be a reverse effect of disharmonious wood surfaces. For visual wood products used in outdoor environments, the effects of weathering should also be investigated. Exposure to outdoor climate affects the appearance of wood products, and such weathering effects will probably infl uence peo-ple’s preferences as well.
References
1. Brandt JP, Shook SR (2005) Attribute elicitation: implications in the research context. Wood Fiber Sci 37:127–146
2. Bigsby H, Rai C, Ozanne L (2005) Determining consumer prefer-ence for furniture timber. J For Prod Bus Res 2(2)
3. Broman NO (2000) Means to measure the aesthetic properties of wood. Doctoral thesis 2000:26. Luleå University of Technology, Luleå
4. Marchal R, Mothe F (1994) Appreciation of oak wood for the French consumer and wood professionals. Ann Sci Forestières 51:213–232
5. Nyrud AQ, Roos A, Rødbotten M (2008) Product attributes affect-ing consumer preference for residential deck materials. Can J For Res 38:1385–1396
6. Masuda M (2004) Why wood is excellent for interior design? From vision physical point of view. In: Proceedings of the 8th World Conference on Timber Engineering, Lahti, Finland, pp 101–106 7. Lawless H, Heymann H (1998) Sensory evaluation of food:
prin-ciples and practices. Chapman & Hall, New York
8. Evin E, Siekierski E (2002) Sensory evaluation of heating and air conditioning systems. Energy Build 34:647–651
9. Obata Y, Takeuchi K, Furuta Y, Kanayama K (2005) Research on better use of wood for sustainable development: quantitative eval-uation of good tactile warmth of wood. Energy 30:1317–1328 10. Wang S-Y, Lin F-C, Lin M-Y (2001) Thermal properties of interior
decorating material and the sensation of cold/warm by contact. II: The relations among heat fl ux, temperature change of material, and sensation of cold/warm by contact. J Wood Sci 47:109–114 11. The Unscrambler, Version 9.7 (1986–2007) CAMO Software ASA,
Oslo, Norway
12. JMP, Version 7.02. SAS Institute Inc., Cary, NC
13. Nakamura M, Kondo T (2008) Quantifi cation of visual inducement of knots by eye-tracking. J Wood Sci 54:22–27
14. Rice J, Kozak RA, Meitner MJ, Cohen DH (2006) Appearance wood products and psychological well-being. Wood Fiber Sci 38:644–659