http://www.sciencepublishinggroup.com/j/mcs doi: 10.11648/j.mcs.20190406.16
ISSN: 2575-6036 (Print); ISSN: 2575-6028 (Online)
A Tanker Port Positioning Method of Quantitative Loading
Automation
Wenliang Zhu
1, Yanzhe Ni
1, *, Tingbo Huang
2, Jiahao Han
31School of Mechanical and Ocean Engineering, Jiangsu Ocean University, Lianyungang, China 2
Jiangsu Spacecraft Co., Ltd., Taizhou, China 3Lianyungang Technical College, Lianyungang, China
Email address:
*
Corresponding author
To cite this article:
Wenliang Zhu, Yanzhe Ni, Tingbo Huang, Jiahao Han. A Tanker Port Positioning Method of Quantitative Loading Automation. Mathematics and Computer Science. Vol. 4, No. 6, 2019, pp. 142-148. doi: 10.11648/j.mcs.20190406.16
Received: November 12, 2019; Accepted: December 13, 2019; Published: December 30, 2019
Abstract:
Laser scanning ranging radar is an important tool for machines to perceive the surrounding environment and is widely used in the power, forestry, surveying and mapping industries. At present, the loading of oil and grain oil in our country generally adopts the way of manual loading. The loading arm is inserted into the tank of the tanker for refueling, and the loading operation is very frequent. In order to realize automatic control of grain and oil loading, radar is needed to assist the robot to locate the oil port of the tanker. In this paper, a 360-degree laser scanning ranging radar is used to collect characteristic data of oil hole of tanker for the first time in simulated environment. Cubic spline interpolation was used to smooth and correct the radar scan data. Based on the feature that the distance data of oil port will change rapidly, an edge feature recognition algorithm is proposed to screen and calculate the target point, and then convert it to cartesian coordinate point, which can be used as the positioning target of the robot unit of quantitative loading system. The experimental results show that the method can locate the center of the circle accurately and meet the requirement of feature recognition accuracy.Keywords:
Laser Radar, Spline Interpolation, Center Positioning1. Introduction
Machine vision is an important boost for automation in various industrial manufacturing fields in the future. Laser scanning ranging radar is an important part of machine vision and an important means for machine perception of the surrounding environment. In the driverless industry, laser radar is used to identify road boundaries [1]; in the power industry, laser radar can be used to obtain coordinate data of electric towers and terrain surfaces, and inspection circuits [2, 3]; in forestry, laser radar It is used to simulate vegetation density, generate digital terrain, etc. [4-6]; Laser radar is also widely used in highways, waterways, railway surveys, digital model generation, etc. [7-10].
Now, China's oil and grain oil loading is generally carried out by means of manual loading. The loading arm is inserted into the oil tank of the tanker to refuel, and the loading operation is very frequent, and the degree of automation is
not high, which affects the high efficiency of production [11]. Although the quantitative loading system realizes the interactive integration of information and the manpower saving in many aspects, the operation of inserting the loading arm into the tank of the tanker still requires manual intervention, so that the whole system can only achieve semi-automatic control. In order to improve the safety, speed and accuracy of loading, and save manpower in this aspect, it is necessary to add robots instead of manual operation to realize full automation of loading. The robot positioning function is realized by radar.
features [18]; Du S combined features based on points and grids to identify buildings [19]; Michael J successfully screened rough wood debris using height thresholds [20]; Yadav M used the Hough transform to identify the power line [21].
Since the laser scanning ranging radar data are discrete, the smoothing correction of the laser scanning ranging radar data by cubic spline interpolation is used to fill the vacancy data reasonably, which is more in line with the practical feasibility [22, 23]. Dingxuan Z used cubic spline interpolation to fit the blank road information data [24]; Chen Hao used the cubic spline interpolation method to fit the variation trend of the time-series data of the laser scanning ranging radar to complete the interpolation of blank data between time-series data of a laser scanning ranging radar [22].
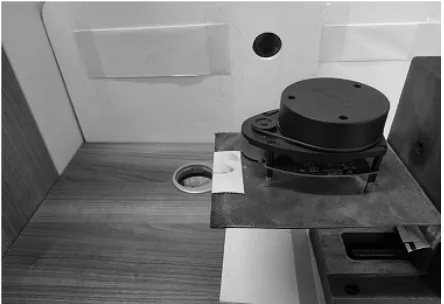
At present, combining with the actual tank port environment grain and oil industry, as shown in Figure 1, this paper mainly focuses on the characteristics of the tank hole to establish a simulation environment. 360-degree laser scanning ranging radar was used in the simulation environment which is used for scanning, feature recognition, and center positioning to collect data. The collected angle and distance data were smoothed by cubic spline interpolation firstly. This paper proposes a feature recognition algorithm, which uses the abrupt change of the distance data in the target area to screen the target points and obtain the positioning data of the center of the hole. It is
converted into cartesian coordinate point, which can be used as the positioning target of the robot unit of the quantitative loading system to realize the automatic operation of the quantitative loading system.
Figure 1. Actual tank truck port.
2. Data Acquisition and Data Processing
The laser scanning ranging radar used is the low-cost 360-degree laser scanning ranging radar RPLIDAR A1 of SLAMTEC, and its performance data table 1 is as follows.
Table 1. Laser scanning ranging radar RPLIDAR A1 performance table.
Project unit Typical value Remarks
Measuring range Meter 0.15-6 Measured based on white highly reflective objects Scanning angle Degree 0-360
Ranging resolution Millimeter (mm) <actual distance 1% Within the full measurement range Angle resolution Degree (Deg) ≤1 5.5Hz scanning
Single ranging time Milliseconds (ms) 0.125 Measuring frequency Hertz (Hz) ≥8000 scanning frequency Hertz (Hz) 1-10
As shown in Figure 2, the slide table used is a vertical two-axis cross slider with a longitudinal stroke of 100 mm, a lateral stroke of 110 mm, and a total height of the slide table of 250 mm. The slider moves 2mm in its direction every time the handle rotates.
Figure 2. Data collection environment.
The construction of the experimental environment is shown in Figure 2. The tabletop corner is the origin of the world coordinate system, the vertical direction is the Z-axis, the axis toward the circular hole is the X-axis, and the axis away from the circular hole is the Y-axis. A horizontal table was added to the Z-axis slider of the cross slider to mount the laser scanning ranging radar on the horizontal table and fix it, and move the slider to the middle position in the horizontal direction. For the first data collection, place the slider in front of the hole being measured, the distance from the YZ plane of the hole is 302 mm, and the distance from the XZ plane is 305 mm. By controlling the movement of the slider in the z-axis direction by 2 mm each time, continuous measurements were made from the height of about 144mm to the height of 200mm, and 29 sets of laser-scanned ranging radar measurements were collected. Then, the slider was moved 50mm in the negative direction and 50mm in the positive direction on the Y-axis, and the measurement was made again to obtain two sets of data.
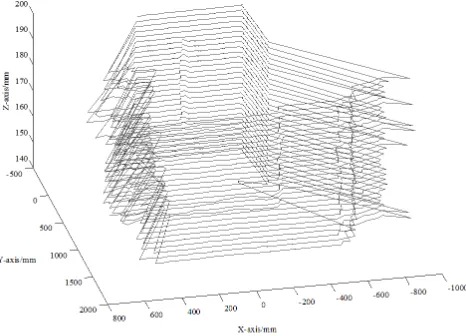
sampling frequency of 6.9 to 7.2 Hz and collected 5 sets of data at the same position. The X-axis coordinate of the target circular hole is 305mm, Y-axis coordinate is 0mm, z-axis coordinate is 170mm, and the radius of the circular hole is 20mm. Each radar data consists of the angle, distance, and height of the radar location. For the data that has been collected, a group of 5 sets of the same position height was randomly selected as the basic data for the test. First, the group that collected the data in front of the hole carried out the experiment, and the processing of the experimental data was completed on the MATLAB platform, and the original data construction map was obtained first, as shown in Figures 3 and 4.
In the process of scanning the surrounding environment, the laser radar can not obtain the feedback data on the boundary of the target circular hole, which is prone to data loss.
Figure 3. Original data construction diagram.
Figure 4. Original data construction diagram.
Because of the ratio of the angular resolution of the laser radar and the size of the circular hole and the distance between the radar and the circular hole, the data collected by the laser scanning ranging radar cannot construct a circular hole. From the construction of the original data, the data in the Z-axis direction are closer to the size of the real circular hole. So firstly, it is first necessary to obtain two target sections in the
Z-axis direction.
Considering the final practical application, the target hole is static and will appear within a certain angle of the radar scan. Therefore, the collected data were first filtered by the actual effective angle.
Since the angle values of each round of data collected by the laser scanning ranging radar are different and unevenly distributed, and the phenomenon of angle loss is easy to occur, it was decided to adopt cubic spline interpolation to fit the obtained data, so as to obtain a smoother curves and evenly distributed data
Because the data collected by the laser scanning ranging radar is orderly, it is arranged according to the positive change of the angle, and the data are divided into each section by its characteristics.
The two factors in the fitting interpolation are angles and distances. Based on the relationship between them, each degree was selected as a data coordinate for one node. At the height H, the m observation data formed, the angle α and the distance d are obtained by actual radar data acquisition, and
j=α1<α2<...<αm<k is selected as a division on [j, k]. Td(α) is a cubic spline interpolation function defined on this interval. In the arbitrary interval α∈[αi, αi+1] (i=1, 2,... m), all the interpolation data are: Td=aα3+bα2+cα+d, the expression is
( )
(
) (
)
{
}
( )
(
) (
)
{
}
( )
(
)
{
}
( )
(
)
{
}
( )
2 1 3
2
1 1
3
2 1 2
2
1 1
3
T
1
2 F
1
2 F
1
( ) T
1
( ) T
d
i i i d i
i
i i i d i
i
i i d i
i
i i d i
i
h h
h h
h
h
α
α α α α α
α α α α α
α α α α α
α α α α α
+
+ +
+
+ +
= + − −
+ + − −
′
+ − −
′
+ − −
(1)
Where: hi = αi +1 - αi, Fd (αi) = Td (αi) is a function value when αi [23].
After processing, the data obtained is between 242 degrees and 298 degrees, and the data is evenly distributed, with one data per degree on each section. 57 data are obtained and stored in the matrix W. 29 sets of data from 242 degrees to 298 degrees were processed. Then for the data between 170° and 190°, with an interval of 0.25°, the matrix S is obtained by fitting to supplement data again
3. Data Processing Edge Feature
Recognition
In order to obtain the boundary of the circular hole, the boundary point is first selected from the Z-axis direction. When the laser radar scans to the boundary of the circular hole, the front-back distance data will change drastically. This is the most intuitive feature, and it is also evident in the model established by the data. Through this feature, the screening is performed on each layer of cross-section data, but in the cyclic screening, the feature points that meet the conditions of the large change in the distance are not only the feature points on the target boundary. For the feature points being processed, the relationship of distance data between the points of the same angle on the upper layer section or the next layer section of the section being processed and the surrounding points needs to be additionally judged. If the corresponding point of the upper layer or the next layer does not change drastically, it can be judged that the feature point is the required feature point in the Z-axis direction, and the angle value and the distance value of the point are recorded. Otherwise, they are not the target points needed.
(a)
(b)
(c)
(d)
Figure 5. (a), (c) before data fitting (b), (d) after data fitting.
Figure 6. Interpolation completed and integrated diagram.
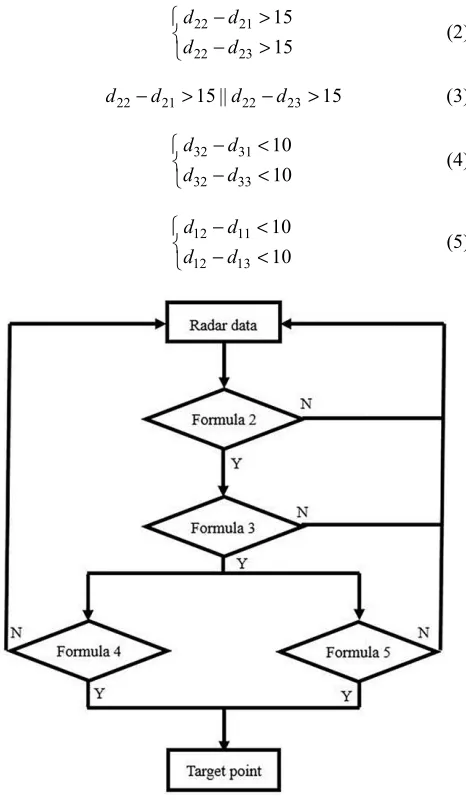
The main judgment condition is the change of the distance d
previous point d21 and the latter point d23 which is in the same section by the formula (2) to determine the size relationship. After the condition is satisfied, the distance change between the detection point and the corresponding point of the upper layer section or the corresponding point of the next layer section is compared by the formula (3). The filter point can be determined by formula (4) or formula (5) that the point is on the boundary, and record the data of the corresponding point
d12 on the previous layer or the corresponding point d32 on the next layer.
22 21
22 23
15 15
d d
d d
− >
− >
(2)
22 21 15 || 22 23 15
d −d > d −d > (3)
32 31
32 33
10 10
d d
d d
− <
− <
(4)
12 11
12 13
10 10
d d
d d
− <
− <
(5)
Figure 7. The first round of data screening process.
In the process of screening, when the laser scanning ranging radar scans into a circular hole, due to the relationship between the distance, the size of the circular hole and the resolution of the radar angle, there may be two or more scanning points in the target circular hole on the target section. The judgment of the point distance change needs to be discussed in a variety of situations. From the original data of the simulated experimental environment, there are about one scan point or two scanning points in the target hole of the target section. It means that there are one or two angle in the hole. In order to cope with the change in the number of
effective angles caused by the change in the size of the circular hole, a certain degree of judgment condition of a plurality of angular points was added to select.
The condition for the first round screening of data features is that a point produces a large distance change to the surrounding point, and after determining whether it is a point on the boundary, its coordinate data are saved. If no two points satisfying the condition are found, a second data screening is performed. In the second round, the two points condition are judged, and the above judgment process is repeated. If the first target point has been obtained, the coordinate data will be recorded, and in the subsequent screening, only the feature points at the other end of the circle will be judged. By analogy, two or three scan points in the round hole are used as the screening criteria, or even four scan points in the round hole. In the case of successfully obtaining two scan points that satisfy the condition, the screening is stopped by itself. The points data of the upper layer or the next layer of the scan point recorded are placed in the matrix W.
The matrix W contains the angle α, the distance Q, and the height U data of the two points. For the characteristics of the circle, the line connecting these two points can be considered to be close to or even passing through the center of the circle. It can be approximated that the distance between the two points is the diameter of the circle, so that the average height of the two points is close to the height of the target center. The average value of the X-axis and Y-axis coordinates of the two points is also approximated to the coordinate value of the center of the circle, thereby obtaining an approximation of the target center, which is the coordinates of the center of the circle in the laser scanning ranging radar coordinate system.
(6)
(
1 2)
/ 2d
P = Q +Q (7)
(
1 2)
/ 2H= U +U (8) Then the angular coordinates (Pα, Pd, 0) are obtained to convert the angular coordinates into Cartesian coordinates, then the Cartesian coordinates (Kα, Kd, 0) are obtained. The center coordinates of the circle in the laser scanning ranging radar coordinate system need to be converted to the world coordinate system and completed by the homogeneous transformation of the matrix. The pose of the laser-scanning ranging radar needs to know its position coordinates and the angle at which the laser scanning ranging radar's coordinate system is offset from the world coordinate system.
The data of the laser scanning ranging radar are based on the coordinate system of the laser scanning ranging radar, which is the relative distance and angle value and does not represent its position in the world coordinate system.
The X-axis coordinate of the laser radar is Xα, the coordinate of the Y-axis is Yα, the coordinates of the laser-scanning ranging radar are (Xα, Yα, H), and H is the calculated coordinate value of the height of the center of the circle, and the coordinate system of the laser scanning ranging
(
1 2)
/ 2a
radar The position array is [Xα Yα H 1]T. Because the laser scanning ranging radar may have a certain angular deviation during the installation process, the angle between the laser scanning ranging radar coordinate system and the world coordinate system is obtained by the relationship between the laser scanning ranging radar and the XZ plane. The angle corresponding to the shortest distance of the laser scanning ranging radar collected by the laser scanning ranging radar to the XZ plane and the corresponding angle in the ideal state can be approximated as the angle of deviation between the coordinate system of the laser scanning ranging radar and the world coordinate system.
The height data H in the matrix S are filtered to obtain the minimum distance dis to obtain the corresponding angle value
β, and the deflection angle θ is obtained by the equation (9). In this experiment, the ideal angle is 180 degrees. The actual shortest distance corresponds to an angle of 182.5 degrees, which means the laser scanning ranging radar coordinate system is deflected by 2.5 degrees in the counterclockwise direction relative to the world coordinate system. Then, in the point of the laser scanning ranging radar coordinate system, the coordinates in the world coordinate system can be obtained by the homogeneous rotation transformation and the homogeneous translation transformation.
180
θ β
= − (9)cos -sin 0 0
sin cos 0 0
0 0 1 0
0 0 0 1
θ θ θ θ
(a) Homogeneous rotation transformation matrix
1 0 0
0 1 0
0 0 1
0 0 0 1
a a X Y H
(b) Homogeneous translation transformation matrix
Since they are all transformed relative to a fixed coordinate system, the coordinate transformation operator should be left-multiplied.
(
) (
)
a d a a a a a d K K M=Trans X , Y , H Rot Z, -θ0 1
1 0 0 X cosθ -sinθ 0 0 K
0 1 0 Y sinθ cosθ 0 0 K
0 0 1 H 0 0 1 0 0
0 0 0 1 0 0 0 1 1
= (10)
The matrix M of the final Cartesian coordinates is obtained, and experiments at the other two positions are performed.
4. Results Analysis
The coordinates of the center of the circle calculated by the homogeneous matrix transformation are (307.5846, 9.8332, 171), and the deviation from the actual center (305, 0, 170) is within an acceptable range. The results obtained by the algorithm collected by the other two locations are (312.8808, 8.2293, 171) and (305.3776, 9.4684, 171).
The goal of the experiment was to find the center of the circle in the XZ plane, the X-axis and Z-axis coordinates. v is the error distance between the final point and the actual point on the XZ plane. In order to verify the effectiveness of the proposed algorithm, the error is calculated on the XZ plane, and the mean absolute error (MAE), relative mean error (MRE) and root mean square error (RMSE) are selected as the error evaluation index [23].
1 1 MAE n i i i v v
n = ′
=
∑
− (11)( )
2 1 1 MSE n i i i v vn = ′
=
∑
− (12)( )
21 1 RMSE n i i i v v
n = ′
=
∑
− (13)The experimental results are MAE=3.9281, MSE=23.9766, and RMSE=4.8966, respectively. According to the actual application requirements, the experimental error meets the requirements.
The causes of error mainly has three aspects: Firstly, the laser scanning ranging radar itself has insufficient scanning precision and low angular resolution. Therefore, when the collected data form a three-dimensional figure, the characteristics of the circular hole cannot be accurately expressed. As a result, the final coordinates obtained during the data processing are subject to errors. Secondly, the installation accuracy of the laser scanning ranging radar also has a large error. In the simulation environment, the horizontal degree is inevitably tilted, resulting in a high degree of error and further amplification under the increase of the distance. Third, the reflection of the laser at the port is difficult to be received by the radar, resulting in the loss of radar data, which further leads to errors in interpolation.
5. Conclusion
In this paper, a 360-degree laser scanning ranging radar is used to scan the round hole by simulating the oil port of the tanker. This method was first applied in the field of grain and oil loading in China.
is transformed into the world coordinate system. The reliability of the algorithm is verified by measuring the data at three different locations, and its error range satisfies the actual user requirements.
In subsequent research the laser scanning ranging radar will be used to scan the oil tank port data, analyze the data, and change the algorithm screening conditions according to the site conditions to meet the actual needs in the project. In order to further improve the positioning accuracy, this goal is achieved through replacing the laser scanning ranging radar with the higher angular resolution for data acquisition and making better the algorithm in practical applications.
Acknowledgements
This study was supported by the Postgraduate Research &Practice Innovation Program of Jiangsu Province (KYCX18_2598).
References
[1] W. Y Wang. Research on Self-tracking of Driverless Vehicle Based on Lidar [D]. Hunan: Chang'an University, 2018, unpublished.
[2] J. S. Peng, J. Xu, J. Li. Application of UAV Airborne LiDAR Technology to Electric Power Industry [J]. Bulletin of Surveying and Mapping, 2018, 493 (04): 152-154.
[3] L. Chen, C. X. Xu, W. T. Gao, et al. Laser SLAM based obstacle avoidance technology of UAV for cable trench inspection [J]. High Voltage Apparatus, 2018, 54 (09): 209-213+220.
[4] S. Qu, X. L. Zhang, C. H. Zhu, et al. Design and test of airborne LiDAR system for forest resources survey [J]. Journal of Northwest Forestry University, 2018, 33 (04): 175-182. [5] M. J Campbell, P. E. Dennison, A. T. Hudak, et al. Quantifying
understory vegetation density using small-footprint airborne lidar [J]. Remote Sensing of Environment, 2018, 215: 330-342. [6] B. BIGDELI, H. A. AMIRKOLAEE, P. PAHLAVANI. DTM extraction under forest canopy using LiDAR data and a modified invasive weed optimization algorithm [J]. Remote Sensing of Environment, 2018, 216: 289-300.
[7] C. C Zheng, Y. L. Liang. Application Analysis of LiDAR Data Based on UAV in the Highway Survey [J]. Geomatics & Spatial Information Technology, 2018, 41 (09): 216-218.
[8] J. Roelens, S. Dondeyne, J. V. Orshoven, et al. Extracting cross sections and water levels of vegetated ditches from LiDAR point clouds [J]. International Journal of Applied Earth Observation and Geoinformation, 2016, 53: 64-75.
[9] A. Sánchez-Rodríguez, B. Riveiro, M. Soilán, et al. Automated detection and decomposition of railway tunnels from Mobile Laser Scanning Datasets [J]. Automation in Construction, 2018, 96: 171-179.
[10] N. Polat, M. Uysal, A. S. Toprak An investigation of DEM generation process based on LiDAR data filtering, decimation,
and interpolation methods for an urban area [J]. Measurement, 2015, 75: 50-56.
[11] H. S. Zhang. The oil tanker loading facilities and dispatching system for petrochemical refinery [J]. Petrochemical Automation, 2016, 52 (03): 1-9.
[12] G. T. Wang, K. Cao, H. Liu. SLAM method based on lidar and visual information fusion [J]. Journal of Shandong University of Technology: Natural Science Edition, 2019 (1): 9-13. [13] G. S. Ge, Z. L Li, K. Yang, et al. Research on robot particle
filtering localization technology based on laser scanning ranging [J]. Journal of Sensors and Microsystems, 2017, 36 (12): 36-39.
[14] J. W. Wang, L. H. Yang, S. D Shi, et al. Indoor integrated navigation algorithm based on workshop measurement positioning system and lidar [J]. Laser & Optoelectronics Progress, 2018, 55 (10): 172-178.
[15] J. Cao, B. Zeng, J. Liu, et al. A novel relocation method for simultaneous localization and mapping based on deep learning algorithm [J]. Computers & Electrical Engineering, 2017, 63: 79-90.
[16] E. Javanmardi, Y. Gu, M. Javanmardi, et al. Autonomous vehicle self-localization based on abstract map and multi-channel LiDAR in urban area [J]. IATSS Research, 2019, 43 (1): 1-13.
[17] J. Roelens, B. Höfle, S. Dondeyne, et al. Drainage ditch extraction from airborne LiDAR point clouds [J]. ISPRS Journal of Photogrammetry and Remote Sensing, 2018, 146: 409-420.
[18] Jia. Wang, L. Y. Zhang, C. D. Lü, et al. Tree species identification methods based on point cloud data using ground-based LiDAR [J]. Transactions of the Chinese Society of Agricultural Machinery, 2018, 49 (11): 180-188.
[19] S. Du, Y. Zhang, Z. Zou, et al. Automatic building extraction from LiDAR data fusion of point and grid-based features [J]. ISPRS Journal of Photogrammetry and Remote Sensing, 2017, 130: 294-307.
[20] J. Michael, D. John, A. Barry, et al. Detection of coarse woody debris using airborne light detection and ranging (LiDAR) [J]. Forest Ecology and Management, 2019, 433, 678-689. [21] M. Yadav, C. G. Charudatta. Extraction of power lines using
mobile LiDAR data of roadway environment [J]. Remote Sensing Applications: Society and Environment, 2017, 8: 258-265.
[22] H. Chen, D. X. Hua, Y. K. Zhang, et al. Interpolation method for lidar data visualization based on cubic spline function [J]. Chinese Journal of Scientific Instrument, 2013, 34 (04): 831-837.
[23] H. Chen, D. X. Hua, Y. K. Zhang, et al. A method of vertical and horizontal plus cubic spline interp olation for Mie scattering lidar profile data [J]. Acta Phys. Sinica, 2014, 63 (15): 167-174.