Proposed model for strength analysis
of HSC eccentrically loaded slender columns
Mahmoud Abdel-Karim
Assistant lecturer, Faculty of Engineering, Shoubra, Benha University, Cairo, Egypt
Gamal T. Abdel-Rahman
Associate professor, Faculty of Engineering, Shoubra, Benha University, Cairo, Egypt
Mohamed Said
Associate professor, Faculty of Engineering, Shoubra, Benha University, Cairo, Egypt
Ibrahim G. Shaaban
Visiting professor, University of Liverpool (on sabbatical from Faculty of Engineering, Benha University), Liverpool, UK (corresponding author: [email protected])
A model for the strength analysis of high-strength concrete (HSC) columns subjected to eccentric loading is proposed. The model is based on a stability analysis of pin-ended columns using the theoretical sinusoidal equation for the deflected shape of the column. The reduction in column stiffness as the axial load increases, representing the basic characteristic of the inelastic response of columns, is considered subject to equilibrium conditions, compatibility requirements, and constitutive relationships for the concrete and reinforcement. The tension-stiffening effect was taken into consideration. The column integrity is limited by either the material or the instability mode of failure. The method was applied to a wide range of experimental data and was compared with the Egyptian, European, and American building codes of practice. The ultimate strength predicted by the proposed model showed excellent agreement with the test results and was in good agreement with the codes of practice. The mean predicted-to-experimental ultimate load ratio was 0·94, with a coefficient of variation of 10·8%.
Notation
Astx,Asty total cross-sectional areas of transverse bars perpendicular tox- andy-axes, respectively Cm end effect factor
c factor depending on the curvature distribution cx,cy dimensions of the concrete core parallel to the
x- andy-axes, respectively Ec elastic modulus of concrete Es secant modulus of concrete EI flexural rigidity of column section e initial eccentricity of applied load,P
fc′ ultimate compressive strength of plain concrete obtained from standard cylinder test
fc stress in concrete
fcc confined concrete compressive strength based onfc fco assumed to be 85% off′c
fh stress in transverse reinforcement at maximum strength of confined concrete
fhy yield strength of ties
fie effective confinement pressure applied on concrete core ft tensile strength of concrete
h side length of column in buckling direction Ie confinement index (=fie/f′c)
Ie50 effective confinement index
i radius of gyration of column cross-section k initial slope and curvature of ascending branch ke confinement effectiveness coefficient, depending on
the proportions of the column cross-section and the amount and configuration of reinforcement
l effective column length
MED total design bending moment of non-sway slender reinforced concrete columns
MOED first-order moment n = (P/EI)1/2
P ultimate load on column (π2EI/l2) Pc Euler elastic critical buckling load
Pp/Pt predicted-to-experimental ultimate load ratio (1/r) curvature calculated based on empirical equations
taking into consideration the level of axial load and creep effects
s centre-to-centre spacing between stirrups sc clear spacing between stirrups
x l/2, wherelis the column length
y deflection of column
β factor depending on the distribution of first- and second-order moments
Δ deflection, independent of the load characteristics
δ moment magnifier factor
εc strain in concrete
εcc,εco axial strains in confined and unconfined concrete, respectively
εc50c post-peak axial strain in confined concrete εc50u axial strain in unconfined concrete
νcc secant Poisson coefficient at maximum peak stress ρc longitudinal reinforcement ratio in core section ρs longitudinal reinforcement ratio
Introduction
The use of high-strength concrete (HSC) in reinforced concrete columns reduces the column proportions, heightening the adverse effects of the slenderness and potential instability on the column capacity. The significance of slenderness effects in HSC columns has caused concern regarding the applicability of current building code requirements for the design of HSC slender columns. The methods available in the literature for the strength analysis of slender columns are generally based on a simplified non-linear analysis that approximates the column deflection to a sine wave function with either constant (Chuang and Kong, 1998; Kuzmanovic, 2014; Lloyd and Rangan, 1996) or variable (Bažant and Xiang, 1997; Mendis, 2000) wavelength (effective length of the column). The beneficial influence of confinement of the concrete core on the column response (Galeota et al., 1992) (i.e. deformation and strength) has generally been ignored. Commonly, the available methods adopt stress–strain models for unconfined concrete. Probabilistic analyses of the modelling errors of various methods for strength analysis of slender columns (Zhou and Hong, 2001) have indicated that modelling errors are sensitive to the adopted concrete stress–strain relationship.
Based on extensive investigation of the response of HSC columns, Légeron and Paultre (2003) developed a stress–strain model for confined HSC that considers the effects of concrete strength and transverse and longitudinal reinforcement parameters on the significance of confinement. The strength of confined concrete is determined based on an effective confine-ment pressure that depends on the stress of transverse reinforcement at the peak strength of concrete and on the con-figuration of the restrained concrete core. The results of non-linear finite-element analysis of slender columns under eccentric loads (Claeson and Johansson, 1999; Kim and Yang, 1995; Kottbet al., 2015) evince the efficiency of the model in assessing the significance of confinement. Experimental and theoretical models for strength analysis of normal-strength and HSC columns taking the confinement to the core concrete into consideration have also been reported (Elchalakani et al., 2017; Maet al., 2014; Niu and Cao, 2015). Ignoring confine-ment effects was shown to result in an overly conservative post-peak behaviour for the columns.
This research forms a part of a larger project in the study of the theoretical behaviour of HSC columns (Abdel-Karim, 2016; Abdel-Karim et al., 2016). A method for the strength analysis of braced HSC columns is presented in this paper. The method is based on a stability analysis of pin-ended columns, representing an‘equivalent’column condition, sub-jected to eccentric loading. In this method, the deflection response of the column is determined by solving for the deflec-tion at the column at mid-height as the load is incremented, considering equilibrium conditions, compatibility requirements and constitutive relationships for both the concrete and the reinforcement. The stress–strain model developed by Légeron
and Paultre (2003) for confined HSC was adopted. The peak of the load–deflection curve is considered to define the load-carrying capacity of the column. Inherently, the method accepts flexural patterns and inelastic buckling as possible flexural modes of column failure (tension or compression). Two load eccentricities were used in this method, e1 and e2 (initial eccentricity at top and bottom of the column). The method considered the column curvature as a single curvature with equal eccentricities. The effect of different end-conditions was studied earlier by Afefy and El-Tony (2016) for normal-strength concrete columns considering virtual column lengths.
The proposed model was applied to relevant test data from the literature to determine its level of accuracy in dealing with any combination of column parameters. The comparison of the results involved the column capacity and the load–deflection characteristics. In addition, the applicability of current building codes ECP-203 (HRBC, 2007), Eurocode 2 (EC2) (BSI, 2004) and ACI 318 (ACI, 2014) to the strength analysis of HSC columns was examined with respect to the proposed model.
Code provisions
The design of slender columns is based on the straining actions resulting from a second-order analysis of the structure, taking into account the effects of material and geometrical non-linearities including creep effects. For the sake of simplicity, the codes specify two alternative methods to account for the second-order bending moment.
The first method, based on nominal stiffness, is EC2-1 or the so-called moment magnifier method. EC2 (BSI, 2004) specifies the total design bending moment of non-sway slender reinforced concrete columns (MED) to be
1: MED¼MOED 1þ β
ðPc=PÞ 1
ACI 318 (ACI, 2014) employs a moment magnifier factor,δ, to account for second-order effects assuming implicitly a half-wave sinusoidal shape for the deflection curve of the column
2: δ¼ Cm
1 ðP=PcÞ
10
Both EC2 and ACI 318 specify empirical equations for deter-mination of theEI value, allowing for the effects of cracking, creep, and non-linearity of the stress–strain relationship of the concrete.
second-order bending moment is calculated assuming the deflectionΔto be
3: Δ¼l
2
c
1
r
The solution for the ultimate load in these equations requires an iterative procedure. On the other hand, the Egyptian code ECP-203 (HRBC, 2007) considers the second-order effects through an additional load eccentricity, Δ, specified to be independent of the load characteristics. The additional eccen-tricity for rectangular columns is defined as
4: Δ¼hð03l=iÞ2=2000; l=i 50
Overall, it can be seen that no refinement of the codes’design methods is feasible without implementing information on the characteristics of concrete as a material.
Proposed method of analysis
A method for the strength analysis of eccentrically loaded pin-ended braced columns was developed based on stability criteria. The method considers equilibrium and compatibility requirements and the material properties at the critical section of the column. The method is applicable to short to extremely slender columns, accepting that the column integrity is limited by material and/or instability modes of failure.
Column deflection model
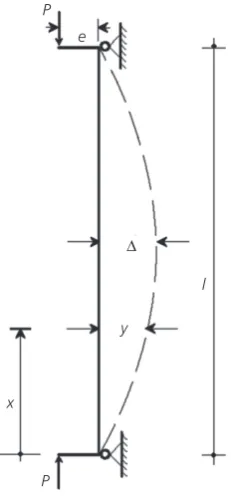
Even though the column response is inelastic, a good approxi-mation may be obtained utilising the elastic deflection equation of the column, although with an appropriate flexural rigidity. According to Kim and Yang (1995), a suitable model for flexural rigidity is essential to assess the actual column response. Referring to Figure 1, the second-order differential equation for a column with pinned ends and subjected to eccentric load is
5: d
2y
dx2¼ n 2ðyþeÞ
The solution of this equation is given in texts on the mechanics of materials (Hearn, 1997) as
6: ðyþeÞ ¼etanðnl=2Þsinnxþecosnx
It is clear that the deflection curve is sinusoidal. Thus, the deflection is maximum at the column mid-height,x=l/2, and is given as
7: Δ¼e½secðnl=2Þ 1
The termnl/2 may be expressed in terms of the critical buck-ling load as follows.
8: n¼
ffiffiffiffiffiffiffiffiffiffiffiffiffi P EI s
9: Pc¼π2EI=l2
Then
10: nl=2¼ ðπ=2Þ ffiffiffiffiffiffiffiffiffiffiffiP=Pc
p
The termnl/2 indicates that the column deflection is dependent on the eccentricity, the level of applied load and the buckling load. Incidentally, the equation given in ACI 318 (ACI, 2014) for the moment magnifier factor (Equation 2) is an approxi-mate version of Equation 7 (Park and Paulay, 1975). In non-linear analysis, the flexural rigidity is variable, depending on the cracking intensity that, in turn, depends on the load level (cracked section modelling). Therefore the exact equation includes, via the buckling load, the flexural rigidity of the column section as a variable that is dependent on the load level. It is worth mentioning that the flexural rigidity varies along the column length. The buckling load was assumed to be subject to the tangent flexural rigidity of the effective section at the column mid-height. It is formulated by dividing the critical section into steel and concrete layers through its depth. This layering approach permits a variation in strain and
P e
Δ
l
y
x
P
stress resultants across the section depth. Strain compatibility across the section depth is based on the assumption that plane sections remain plane after bending. The membrane actions of the layers are integrated through the depth to obtain the flexural rigidity.
Material model
Modelling of concrete
Reported data demonstrate the necessity of considering two models for concrete under compression in a column cross-section – one for the unconfined cover and the other for the confined core. Otherwise, an overly conservative post-peak behaviour is expected (Claeson and Johansson, 1999). The material model adopted for concrete in compression is based on the model suggested by Légeron and Paultre (2003), which is an update of the model presented by Cusson and Paultre (1995). Figure 2 shows the stress–strain relationships for unconfined and confined concrete, respectively representing the concrete cover and the core of the column section. The ascending branch of the stress–strain relationship of confined concrete is based on a relationship originally proposed by Popovics (1973).
11: fc¼fcc
kðεc=εccÞ
k1þ ðεc=εccÞk
" #
in which
12: fcc¼fco 10þ24ðIeÞ07
h i
13: εcc¼εco 10þ35ðIeÞ12
h i
14: k¼ Ec
Ec ðfcc=εccÞ
The descending branch is based on the model proposed by Fafitis and Shah (1985)
15: fc¼fccexp k1ðεc=εccÞk2
h i
in which
16: k1¼lnð05Þ=ðεc50c=εccÞk2
17: k2¼1þ25=ðIe50Þ2
18: εc50c¼εc50uþ ð1þ60Ie50Þ
where the coefficientsk1and k2control the general slope and the curvature of the descending branch, respectively. Referring to Figure 2,εc50candεc50uare the axial strains in confined and unconfined concrete at which the stress drops to 0·5fcc and 0·5fco, respectively. Herein,εc50uwas taken as 0·004. The effec-tive confinement index, Ie50, is evaluated at the post-peak strain (εc50c) assuming the reinforcement bars are yielded.
The aforementioned constitutive model is shown to depend in essence on the effective confinement pressure, fie. Accepting
that the confinement pressure developed by transverse
reinforcement is non-uniform, Légeron and Paultre (2003) assumed the effective confinement pressure to be
19: fie¼
kefh
s
AstxþAsty cxþcy
where
20: ke¼
1 ðPðwiÞ2=6cxcyÞ
h i
1 ðsc=2cxÞ
½ 1 ðsc=2cyÞ
ð1ρcÞ
There are two alternatives to compute the stress in the trans-verse reinforcement,fh, at peak strength of confined concrete. The first alternative is the iterative approach suggested by Cusson and Paultre (1995) in which the corresponding strain, εh, needs to be estimated as
21: εh¼νccεccð
1νccÞfie
ðfcc=εccÞ
considering the secant Poisson’s coefficient at maximum peak stresses (νcc) to be equal to 0·43. On the other hand, the direct
fcc
fco
0·5fcc
εco εcc εc50u εc50c 0·5fco
Concr
ete axial str
ess
Concrete axial strain
Confined concrete
Unconfined concrete
approach suggested by Légeron and Paultre (2003), based on a wide range of tested columns, assumes thatfh is equal to the yield strength of the ties,fhy, ifηreaches a value of 10 where
22: η¼ sf
0
c
keEsεco
cxþcy AstxþAsty
otherwise
Regarding the material model for concrete in tension, this is assumed to be a bilinear stress–strain relationship. A linear ascending branch of the stress–strain relationship was assumed for uncracked concrete with a gradient equal to the initial elastic modulus of concrete in compression, whereas a linear descending softening branch was used to account for the tension-stiffening effect for cracked concrete. The tensile strength of cracked concrete was assumed to vanish at a peak tensile strain equal to ten times the peak tensile strain. Razvi (1995) recommends the tensile strength of the concrete to be
24: ft¼062
ffiffiffiffiffi f0c
p
MPa
Modelling of reinforcement
The stress–strain relationship for the longitudinal reinforce-ment was modelled by an elastic–perfectly plastic approxi-mation identical in tension and compression. Perfect bond between the reinforcing bars and concrete was assumed.
Analysis procedure
The deflection response of the column, including the post-peak response, is determined by solving for the deflection
condition(s) as the load is incremented. For a given load level, the solution for the deflection involves an iterative procedure to comply with the equilibrium and compatibility requirements along with the constitutive relationships for concrete and reinforcement at the critical section of the column. The procedure begins by estimating the strain profile at the critical section and proceeds to consider the resultant stress condition to solve for the column deflection using Equation 7. Then, the conditions of equilibrium of the internal and external forces are examined and the estimated strain profile is adjusted accordingly until convergence is achieved. The convergence criterion was based on un-balanced forces with a convergence tolerance of 0·005. The
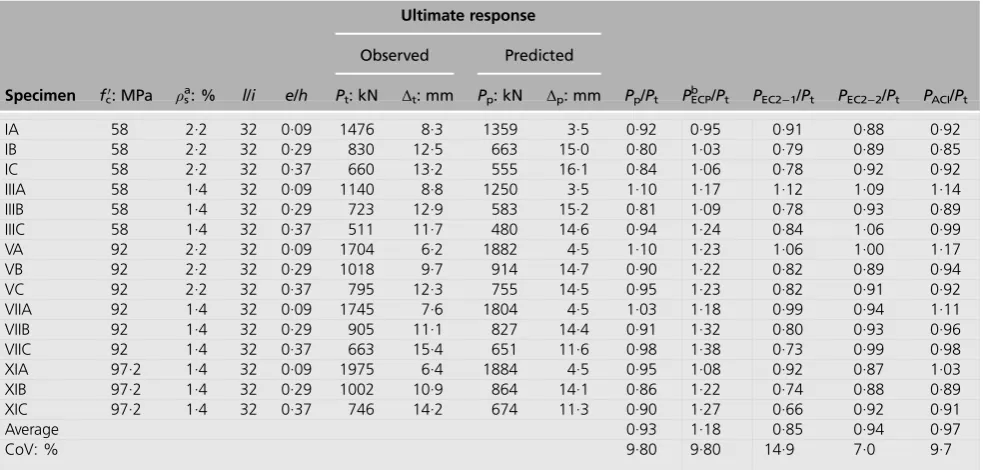
Table 1. Column specimens tested by Lloyd and Rangan (1996)–details and ultimate response
Specimen fc0: MPa ρsa: % l/i e/h
Ultimate response
Pp/Pt PECPb /Pt PEC2−1/Pt PEC2−2/Pt PACI/Pt Observed Predicted
Pt: kN Δt: mm Pp: kN Δp: mm
IA 58 2·2 32 0·09 1476 8·3 1359 3·5 0·92 0·95 0·91 0·88 0·92
IB 58 2·2 32 0·29 830 12·5 663 15·0 0·80 1·03 0·79 0·89 0·85
IC 58 2·2 32 0·37 660 13·2 555 16·1 0·84 1·06 0·78 0·92 0·92
IIIA 58 1·4 32 0·09 1140 8·8 1250 3·5 1·10 1·17 1·12 1·09 1·14
IIIB 58 1·4 32 0·29 723 12·9 583 15·2 0·81 1·09 0·78 0·93 0·89
IIIC 58 1·4 32 0·37 511 11·7 480 14·6 0·94 1·24 0·84 1·06 0·99
VA 92 2·2 32 0·09 1704 6·2 1882 4·5 1·10 1·23 1·06 1·00 1·17
VB 92 2·2 32 0·29 1018 9·7 914 14·7 0·90 1·22 0·82 0·89 0·94
VC 92 2·2 32 0·37 795 12·3 755 14·5 0·95 1·23 0·82 0·91 0·92
VIIA 92 1·4 32 0·09 1745 7·6 1804 4·5 1·03 1·18 0·99 0·94 1·11
VIIB 92 1·4 32 0·29 905 11·1 827 14·4 0·91 1·32 0·80 0·93 0·96
VIIC 92 1·4 32 0·37 663 15·4 651 11·6 0·98 1·38 0·73 0·99 0·98
XIA 97·2 1·4 32 0·09 1975 6·4 1884 4·5 0·95 1·08 0·92 0·87 1·03
XIB 97·2 1·4 32 0·29 1002 10·9 864 14·1 0·86 1·22 0·74 0·88 0·89
XIC 97·2 1·4 32 0·37 746 14·2 674 11·3 0·90 1·27 0·66 0·92 0·91
Average 0·93 1·18 0·85 0·94 0·97
CoV: % 9·80 9·80 14·9 7·0 9·7
aThe yield strength of longitudinal reinforcement was 430 MPa bThe cube strength of concrete was taken as 1·25f′
c
23: fh¼
025f0c
ðke=sÞ ðcxþcyÞ=ðAstxþAstyÞ
load level beyond which convergence was not fulfilled was considered the ultimate load of the column. Note that the analysis of slender columns using the methods specified by EC2 and ACI 318 entails a trial-and-error procedure to determine the ultimate load.
Experimental verification
The proposed method was applied to extensive test data from the literature to examine its credibility in predicting the response of HSC columns. Of particular interest were the load-carrying capacity of the column and the load–deflection characteristics. The ultimate load predictions were also com-pared with the results following the ECP-203, EC2 and ACI 318 code provisions for columns under uniaxial eccentric compression. The strength reduction factors specified by the codes were adopted as unity.
Specimens investigated by Lloyd and Rangan (1996)
The behaviour of HSC columns under eccentric compression was extensively investigated by Lloyd and Rangan (1996). The column parameters were the concrete compressive strength, longitudinal reinforcement ratio, load eccentricity and column cross-section. Five series were chosen for analysis. The volu-metric ratio of transverse reinforcement was 0·46% and its yield strength was 450 MPa. The analytical results are compared with the experimental results in Table 1.
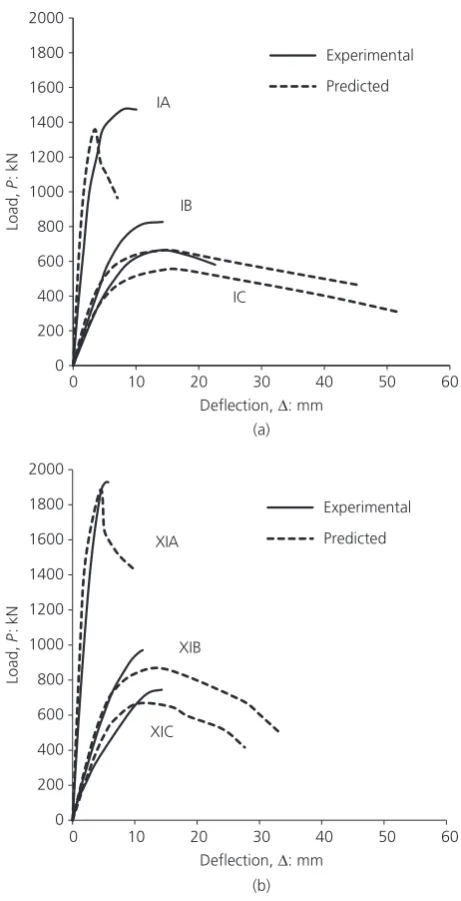
Referring to Table 1, excellent agreement was achieved between the predicted and observed ultimate responses. The analysis reflected the essence of the test results that an increase in the initial eccentricity ratio (e/h, wheree is the eccentricity and h is the length of column’s cross-section) resulted in a decrease in the ultimate load and an increase in the column deflection at failure. The mean predicted-to-experimental ulti-mate load ratioPp/Ptwas 0·93, with a coefficient of variation (CoV) of 9·80%. The predictions of the column’s deflection compare well with the experimental results, not only at the ulti-mate load level but also throughout the loading range, as revealed by the load–deflection responses shown in Figure 3. There is a tendency, however, to overestimate the post-cracking deflections for specimens withe/h≥0·30. The tension-stiffening effect may be underestimated in the present analysis, resulting in a decrease in the column stiffness and consequently an increase in the post-cracking deformations; however, it becomes more influential ase/hincreases. For specimens with
e/h= 0·10, the analytical load–deflection response was found to be satisfactory.
The ultimate load predicted by EC2-2 (the method based on nominal curvature) was closer to the experimental value than the ECP-203 results. The meanPEC2-2/Ptratio was 0·94, with a CoV of 7·0% whereas the meanPECP/Pt ratio was 1·18 with a CoV of 9·80%. It should be noted that the stress–strain relationship provided by EC2 accounts for HSC of compressive
strength up to 100 MPa. Besides, ECP-203 neglects the additional eccentricity for specimens with l/i< 50. EC2-1 (the method based on nominal stiffness) tended to underestimate the ultimate loads for columns with e/h≥0·3, while the ACI 318 procedure slightly overestimated the ultimate loads for columns with e/h≤0·1. This may be attributed to the methods proposed for assessing the column flexure rigidity. The mean PEC2-1/Pt ratio was 0·85 with a CoV of 14·9% whereas the meanPACI/Ptratio was 0·97 with a CoV of 9·70%. In practice, such a discrepancy in the results of the building codes is expected to yield a non-uniform safety margin in column design.
(a)
(b) 0
200 400 600 800 1000 1200 1400 1600 1800 2000
0 10 20 30 40 50 60
Load,
P
: k
N
Load,
P
: k
N
Deflection, Δ: mm
0 10 20 30 40 50 60
Deflection, Δ: mm
Experimental
Predicted IA
IB
IC
0 200 400 600 800 1000 1200 1400 1600 1800 2000
Experimental
Predicted XIA
XIB
XIC
Figure 3. Load–deflection response for column specimens tested by Lloyd and Rangan (1996): (a) specimens withfc′= 58·0 MPa;
Specimens tested by Kim and Yang (1995)
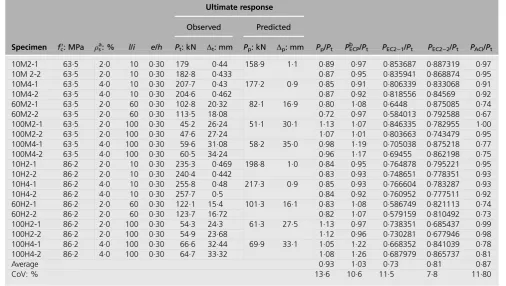
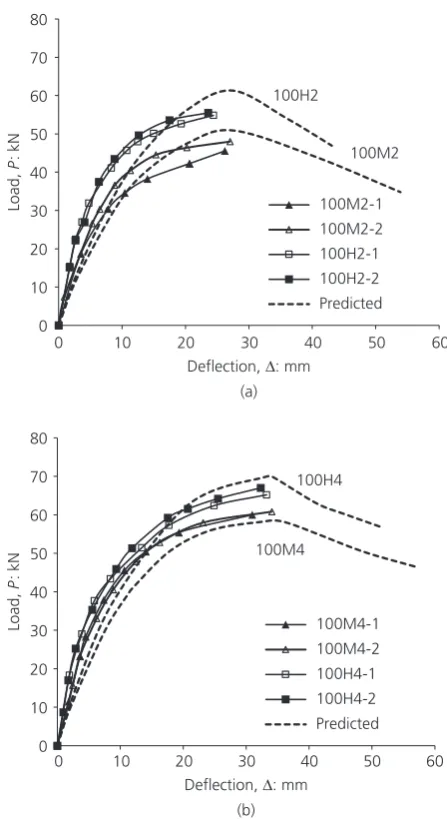
Kim and Yang (1995) reported test results on 30 tied columns of 80 mm square cross-section and slenderness ratios of 10, 60 and 100. The initial eccentricity of the applied load was 24 mm. Three strengths of concrete (25·5, 63·5 and 86·2 MPa) and two ratios of longitudinal steel (2·0% and 4·0%) were used. The volumetric ratio of transverse reinforcement was 0·44% and its yield strength was 250 MPa. As shown in Table 2, only HSC specimens were considered in the analysis.
Table 2 shows that the correlation with ultimate load predic-tions was satisfactory, with a mean value ofPp/Ptof 0·93 and a CoV of 13·6%. The rather high variation in thePp/Ptratio is attributed in part to the discrepancy in the experimental results of identical specimens. Table 2 also shows that the significance of test deflections at failure was adequately predicted, particu-larly for columns with a slenderness ratio≥60. Figure 4 shows that the load–deflection responses for specimens withl/i= 100 were in close agreement with the test results. The analysis once again slightly overestimated the post-cracking deflections due to an underestimation of the tension-stiffening effect of cracked concrete. The deviation in the results vanished for all column specimens prior to failure, indicating that the tension-stiffening effect had no influence on the ultimate response of the specimens.
As far as the building codes are concerned, ECP-203 over-estimated the ultimate loads, particularly for columns with
l/i= 100 and a longitudinal reinforcement ratio of 4%. The mean
PECP/Ptratio was 1·03 with a CoV of 10·6%. Except for ECP-203, the iterative process in all the procedures adjusts the neutral axis position as it decreases by increasing the longitudinal reinforcement content, resulting in higher mid-height deflections. On the other hand, the methods based on nominal stiffness (EC2-1 and ACI 318) significantly underestimated the predicted ultimate loads for columns with l/i= 100 and a longitudinal reinforcement ratio of 4%. However, excellent results were obtained using the proposed method. The tension-stiffening effect appears to be significant in affecting eccentric columns, particularly when the bending moment is dominant. The pro-visions set by EC2-2 and ACI 318 yielded better predictions than the other methods for the entire range of columns analysed. The mean PEC2-2/Pt and PACI/Pt ratios were 0·81 and 0·87, respectively, with CoVs of 7·8% and 11·8%, respectively.
Specimens investigated by Lee and Son (2000)
Lee and Son (2000) carried out extensive experimental work on well-confined square column specimens to investigate their structural behaviour under eccentric loading. The main vari-ables included were concrete compressive strength, longitudinal reinforcement ratio, load eccentricity and slenderness ratio.
Table 2. Column specimens tested by Kim and Yang (1995)–details and ultimate response
Specimen fc0: MPa ρsa: % l/i e/h
Ultimate response
Pp/Pt PECPb /Pt PEC2−1/Pt PEC2−2/Pt PACI/Pt Observed Predicted
Pt: kN Δt: mm Pp: kN Δp: mm
10M2-1 63·5 2·0 10 0·30 179 0·44 158·9 1·1 0·89 0·97 0·853687 0·887319 0·97
10M 2-2 63·5 2·0 10 0·30 182·8 0·433 0·87 0·95 0·835941 0·868874 0·95
10M4-1 63·5 4·0 10 0·30 207·7 0·43 177·2 0·9 0·85 0·91 0·806339 0·833068 0·91
10M4-2 63·5 4·0 10 0·30 204·6 0·462 0·87 0·92 0·818556 0·84569 0·92
60M2-1 63·5 2·0 60 0·30 102·8 20·32 82·1 16·9 0·80 1·08 0·6448 0·875085 0·74
60M2-2 63·5 2·0 60 0·30 113·5 18·08 0·72 0·97 0·584013 0·792588 0·67
100M2-1 63·5 2·0 100 0·30 45·2 26·24 51·1 30·1 1·13 1·07 0·846335 0·782955 1·00
100M2-2 63·5 2·0 100 0·30 47·6 27·24 1·07 1·01 0·803663 0·743479 0·95
100M4-1 63·5 4·0 100 0·30 59·6 31·08 58·2 35·0 0·98 1·19 0·705038 0·875218 0·77
100M4-2 63·5 4·0 100 0·30 60·5 34·24 0·96 1·17 0·69455 0·862198 0·75
10H2-1 86·2 2·0 10 0·30 235·3 0·469 198·8 1·0 0·84 0·95 0·764878 0·795221 0·95
10H2-2 86·2 2·0 10 0·30 240·4 0·442 0·83 0·93 0·748651 0·778351 0·93
10H4-1 86·2 4·0 10 0·30 255·8 0·48 217·3 0·9 0·85 0·93 0·766604 0·783287 0·93
10H4-2 86·2 4·0 10 0·30 257·7 0·5 0·84 0·92 0·760952 0·777511 0·92
60H2-1 86·2 2·0 60 0·30 122·1 15·4 101·3 16·1 0·83 1·08 0·586749 0·821113 0·74
60H2-2 86·2 2·0 60 0·30 123·7 16·72 0·82 1·07 0·579159 0·810492 0·73
100H2-1 86·2 2·0 100 0·30 54·3 24·3 61·3 27·5 1·13 0·97 0·738351 0·685437 0·99
100H2-2 86·2 2·0 100 0·30 54·9 23·68 1·12 0·96 0·730281 0·677946 0·98
100H4-1 86·2 4·0 100 0·30 66·6 32·44 69·9 33·1 1·05 1·22 0·668352 0·841039 0·78
100H4-2 86·2 4·0 100 0·30 64·7 33·32 1·08 1·26 0·687979 0·865737 0·81
Average 0·93 1·03 0·73 0·81 0·87
CoV: % 13·6 10·6 11·5 7·8 11·80
aThe yield strength of longitudinal reinforcement was 387 MPa bThe cube strength of concrete was taken as 1·25f′
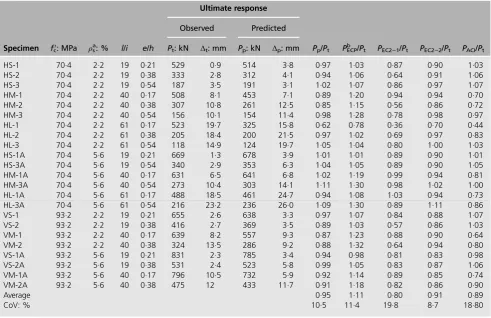
A high volumetric ratio of lateral reinforcement of 2·04% was used with a yield strength of 340 MPa. The concrete strengths were 34·9, 41·8, 70·4 and 93·2 MPa. The analysis was per-formed for HSC column specimens. The specimen details and results are summarised in Table 3.
Table 3 shows excellent correlation of the ultimate load results, with a mean predicted-to-experimental ultimate load ratio of 0·95 and a CoV of 10·5%, thus indicating the credibility of the confinement model adopted. The confined concrete strength,
fcc, for test specimens was shown to range from 1·14 to 1·21 of the unconfined concrete strength,fco. Furthermore, satisfactory predictions of the columns’deflection at failure were realised.
ECP-203 tended to overestimate the column capacity, particu-larly for specimens with l/i= 40. The recorded deflection for
these specimens was as high as 53% of the initial eccentricity. It is apparent that overlooking second-order effects in the analysis of HSC short specimens with l/i ratios close to the limiting value of 50 is inaccurate. The upper limit of the slenderness ratio set by ACI 318 for short braced columns bent in single curvature was 22. This may justify the superior results shown in Table 3 for ACI 318 compared with those of ECP-203. Reliance of the additional load eccentricity con-sidered in the ACI 318 analysis on the initial eccentricity is an added factor. ACI 318 implicitly adopts an almost linear stress–strain relationship for HSC, in agreement with the experimental evidence. The mean value of the ultimate load ratio was 1·11 with a CoV of 11·4% for the ECP-203 predic-tions compared with 0·89 and 18·8% for the ACI 318 results.
On the other hand, the EC2 slenderness limit for short braced columns bent in single curvature is dependent on the axial load level, the mechanical reinforcement ratio and the creep coefficient. The upper limit of the slenderness ratio for short braced columns is a maximum of 10·78, justifying the con-servativeness of the EC2 results shown in Table 3. Specifically, the EC2-2 procedure yielded the least ultimate load variation (the meanPEC2-2/Pt ratio was 0·91 with a CoV of 8·7%). The methods based on nominal stiffness indicated higher CoVs (18·8% and 19·8% for ACI 318 and EC2-1, respectively). It should be noted that the mid-height deflection estimated by EC2-2 was mainly dependent on the slenderness ratio, similar to the ECP-203 procedure. It is believed that the overestima-tion of the ECP-203 method for columns having practical reinforcement ratios up to 2% is due to the use of a stress– strain relationship for normal-strength concrete and to the upper limit of the slenderness ratio for short braced columns (l/i= 50).
Conclusions
The proposed model for the strength analysis of eccentrically loaded pin-ended braced HSC columns assumes that column deflection is dependent on the initial eccentricity, the level of applied load and a buckling load based on variable column stiffness. The model accepts material failure and instability as possible modes of column failure. The model was verified by comparing its results with experimental results of 58 column specimens taken from the literature with different variables (i.e. slenderness ratios, concrete compressive strengths, volu-metric ratios of transverse reinforcement and longitudinal reinforcement ratios). The columns were tested under eccentric loading with initial eccentricity ratios (e/h) ranging between 0·09 and 0·54. In addition, the model results were also com-pared with those of current building codes. The following con-clusions can be drawn from the results of this study.
(a) The predicted behaviour (load-carrying capacity and load–deflection characteristics) was in excellent agreement 0
10 20 30 40 50 60 70 80
100M2-1 100M2-2 100H2-1 100H2-2 Predicted 100H2
100M2
0 10 20 30 40 50 60 70 80
100M4-1 100M4-2 100H4-1 100H4-2 Predicted 100H4
100M4
Load,
P
: k
N
Load,
P
: k
N
(a)
0 10 20 30 40 50 60
Deflection, Δ: mm
(b)
0 10 20 30 40 50 60
Deflection, Δ: mm
Figure 4. Load–deflection response for slender specimens tested by Kim and Yang (1995): (a) specimens withfc′= 63·5 MPa;
with the test results. The mean predicted-to-experimental ultimate load ratio was 0·94 with a CoV of 10·8%. (b) Conservative predictions of the ultimate behaviour were
obtained using the EC2 (BSI, 2004) procedures. The results following the nominal curvature procedure (EC2-2) were superior compared to those based on the nominal stiffness procedure (EC2-1).
(c) Contrary to the ACI 318 (ACI, 2014) code results, the strength predictions based on the ECP-203 code provisions were generally not conservative. The significance of second-order effects in ECP-203 (HRBC, 2007) is subject to the load eccentricity ratio,e/h. Moreover, the upper limit of the slenderness ratio for short braced columns (l/i≈50) needs to be lowered.
(d) Neglecting the tension-stiffening effect resulted in an underestimated load-carrying capacity, particularly when the bending moment was dominant. (e) The mid-height deflection predicted by ECP-203
was found to be independent on the neutral axis position, causing overestimation of the load-carrying capacity for columns with high longitudinal
reinforcement content.
Acknowledgement
Dr S. Jones, University of Liverpool, is acknowledged for proofreading the manuscript.
REFERENCES
Abdel-Karim M(2016)Behavior of Confined HSC Columns under
Centric and Eccentric Loading. MSc thesis submitted to faculty of Engineering, Benha University, Cairo, Egypt.
Abdel-Karim M, Abdel-Rahman GT, Shaaban IG and Said M(2016)
Strength of HSC Slender Columns–A Method of Analysis.
ERJ–Faculty of Engineering, Shoubra, Internal Report.
ACI (American Concrete Institute)(2014) ACI 318-14: Building code
requirements for reinforced concrete. ACI, Farmington Hills, MI, USA.
Afefy HM and El-Tony ETM(2016) Simplified design procedure for
reinforced concrete columns based on equivalent column concept.
International Journal of Concrete Structures and Materials10(3): 393–406.
Bažant ZP and Xiang Y(1997) Inelastic buckling of concrete column in
braced frame.ASCE Journal of Structural Engineering123(5):
634–642.
BSI(2004) BS EN 1992-1-1:2004: Eurocode 2: Design of concrete
structures. BSI, London, UK.
Chuang PH and Kong SK(1998) Strength of slender reinforced concrete
columns.ASCE Journal of Structural Engineering124(9): 992–998.
Table 3. Column specimens tested by Lee and Son (2000)–details and ultimate response
Specimen fc0: MPa ρsa: % l/i e/h
Ultimate response
Pp/Pt PECPb /Pt PEC2−1/Pt PEC2−2/Pt PACI/Pt Observed Predicted
Pt: kN Δt: mm Pp: kN Δp: mm
HS-1 70·4 2·2 19 0·21 529 0·9 514 3·8 0·97 1·03 0·87 0·90 1·03
HS-2 70·4 2·2 19 0·38 333 2·8 312 4·1 0·94 1·06 0·64 0·91 1·06
HS-3 70·4 2·2 19 0·54 187 3·5 191 3·1 1·02 1·07 0·86 0·97 1·07
HM-1 70·4 2·2 40 0·17 508 8·1 453 7·1 0·89 1·20 0·94 0·94 0·70
HM-2 70·4 2·2 40 0·38 307 10·8 261 12·5 0·85 1·15 0·56 0·86 0·72
HM-3 70·4 2·2 40 0·54 156 10·1 154 11·4 0·98 1·28 0·78 0·98 0·97
HL-1 70·4 2·2 61 0·17 523 19·7 325 15·8 0·62 0·78 0·36 0·70 0·44
HL-2 70·4 2·2 61 0·38 205 18·4 200 21·5 0·97 1·02 0·69 0·97 0·83
HL-3 70·4 2·2 61 0·54 118 14·9 124 19·7 1·05 1·04 0·80 1·00 1·03
HS-1A 70·4 5·6 19 0·21 669 1·3 678 3·9 1·01 1·01 0·89 0·90 1·01
HS-3A 70·4 5·6 19 0·54 340 2·9 353 6·3 1·04 1·05 0·89 0·90 1·05
HM-1A 70·4 5·6 40 0·17 631 6·5 641 6·8 1·02 1·19 0·99 0·94 0·81
HM-3A 70·4 5·6 40 0·54 273 10·4 303 14·1 1·11 1·30 0·98 1·02 1·00
HL-1A 70·4 5·6 61 0·17 488 18·5 461 24·7 0·94 1·08 1·03 0·94 0·73
HL-3A 70·4 5·6 61 0·54 216 23·2 236 26·0 1·09 1·30 0·89 1·11 0·86
VS-1 93·2 2·2 19 0·21 655 2·6 638 3·3 0·97 1·07 0·84 0·88 1·07
VS-2 93·2 2·2 19 0·38 416 2·7 369 3·5 0·89 1·03 0·57 0·86 1·03
VM-1 93·2 2·2 40 0·17 639 8·2 557 9·3 0·87 1·23 0·88 0·90 0·64
VM-2 93·2 2·2 40 0·38 324 13·5 286 9·2 0·88 1·32 0·64 0·94 0·80
VS-1A 93·2 5·6 19 0·21 831 2·3 785 3·4 0·94 0·98 0·81 0·83 0·98
VS-2A 93·2 5·6 19 0·38 531 2·4 523 5·8 0·99 1·05 0·83 0·87 1·06
VM-1A 93·2 5·6 40 0·17 796 10·5 732 5·9 0·92 1·14 0·89 0·85 0·74
VM-2A 93·2 5·6 40 0·38 475 12 433 11·7 0·91 1·18 0·82 0·86 0·90
Average 0·95 1·11 0·80 0·91 0·89
CoV: % 10·5 11·4 19·8 8·7 18·80
aThe yield strength of longitudinal reinforcement was 319–397 MPa bThe cube strength of concrete was taken as 1·25f′
Claeson C and Johansson M(1999) Finite element analysis of confined
concrete columns.Proceedings of 5th International Symposium on
Utilization of High-Strength/High-Performance Concrete, Sandefjord, Norway, pp. 194–202.
Cusson D and Paultre P(1995) Stress–strain model for confined
high-strength concrete.ASCE Journal of Structural Engineering
121(3): 468–477.
Elchalakani M, Aslani F, Ma G and Duan W(2017) Design of
GFRP-reinforced rectangular concrete columns under eccentric
axial loading.Magazine of Concrete Research69(17): 865–877,
http://dx.doi.org/10.1680/jmacr.16.00437.
Fafitis A and Shah SP(1985)Lateral Reinforcement for High-strength
Concrete Columns. American Concrete Institute, Farmington Hills,
MI, USA, ACI SP 87-12, pp. 213–232.
Galeota D, Giammatteo MM and Marino R(1992) Strength and ductility
of confined high-strength concrete.Proceedings of 10th World
Conference on Earthquake Engineering, Madrid, Spain. Balkema,
Rotterdam, the Netherlands, pp. 2609–2613.
Hearn EJ(1997)Mechanics of Materials: An Introduction to the
Mechanics of Elastic and Plastic Deformation of Solids and Structural Components, 3rd edn. Pergamon Press, Oxford, UK.
HRBC (Housing and Building National Research Center)(2007)
ECP-203:2007: Egyptian code for design and construction of concrete structures. Housing and Building National Research Center, Cairo, Egypt.
Kim JK and Yang JK(1995) Buckling behaviour of slender high-strength
concrete columns.Engineering Structures17(1): 39–51.
Kottb HA, El-Shafey N and Torkey A(2015) Behavior of high strength
concrete columns under eccentric loads.HBRC Journal11(1):
22–34.
Kuzmanovic A(2014)Preliminary Design of Slender Reinforced
Concrete Highway Bridge Pier Systems. Department of Civil Engineering, University of Toronto, Toronto, ON, Canada.
Lee JH and Son HS(2000) Failure and strength of high-strength
concrete columns subjected to eccentric loads.ACI Structural
Journal97(1): 75–85.
Légeron F and Paultre P(2003) Uniaxial confinement model for
normal- and high-strength concrete columns.ASCE Journal of
Structural Engineering129(2): 241–252.
Lloyd NA and Rangan BV(1996) Studies on high-strength concrete
columns under eccentric compression.ACI Structural Journal
93(6): 631–638.
Ma CK, Omar W and Awang AZ(2014) New theoretical model for
SSTT-confined HSC columns.Magazine of Concrete Research
66(13): 674–684, http://dx.doi.org/10.1680/macr.13.00230.
Mendis PA(2000) Behavior of slender high-strength concrete columns.
ACI Structural Journal97(6): 895–901.
Niu H and Cao W(2015) Full-scale testing of high-strength RACFST
columns subjected to axial compression.Magazine of Concrete
Research67(5): 257–270, http://dx.doi.org/10.1680/macr.14.00198.
Park R and Paulay T(1975)Reinforced Concrete Structures. J Wiley and
Son, New York, NY, USA.
Popovics S(1973) A numerical approach to the complete stress–strain
curve of concrete.Cement and Concrete Research3(5):
583–599.
Razvi SR(1995)Confinement of Normal and High-Strength Concrete
Columns. UMI, Ann Arbor, MI, USA.
Zhou W and Hong HP(2001) Statistical analyses of strength of slender
RC columns.ASCE Journal of Structural Engineering127(1):
21–27.