REVIEW
Characterizing phosphorus forms
in cropland soils with solution
31
P‑NMR:
past studies and future research needs
Barbara J. Cade‑Menun
*Abstract
Understanding the forms and dynamics of soil phosphorus (P) is essential to maintain agricultural productivity while minimizing environmental risks. Since it was first used on soil extracts in 1980, 31P‑nuclear magnetic resonance spec‑ troscopy (P‑NMR) has emerged as the leading technique to characterize extractable soil organic P forms. However, it is still underutilized in agriculture; of the more than 200 soil P‑NMR papers published to date, only 44 have been con‑ ducted in non‑pasture soils used for the production of annual or perennial crops, and only nine of those have linked identified P forms to agronomic parameters such as yield. This paper reviews these prior studies, suggesting gaps in research with respect to cropping systems and geographical regions. In particular, there have been few recent P‑NMR studies that have fully identified P forms in African soils, and few studies of permanent crops such as orchards and vineyards. There is a need to link future P‑NMR studies of cropping systems to agronomic parameters, and combine P‑NMR with other techniques to fully capture P dynamics in cropping systems.
Keywords: Phosphorus, NMR, Soil, Cropland
© Crown Copyright 2017. This article is distributed under the terms of the Creative Commons Attribution 4.0 International License (http://creativecommons.org/licenses/by/4.0/), which permits unrestricted use, distribution, and reproduction in any medium, provided you give appropriate credit to the original author(s) and the source, provide a link to the Creative Commons license, and indicate if changes were made. The Creative Commons Public Domain Dedication waiver (http://creativecommons.
org/publicdomain/zero/1.0/) applies to the data made available in this article, unless otherwise stated.
Introduction
Phosphorus (P) is an essential element for all organisms, and is needed for energy transfer through adenosine triphosphate (ATP), cell membrane structure (phospho-lipids and lipoteichoic acids), cell reproduction [deoxyri-bonucleic acid (DNA)] and gene expression [ri[deoxyri-bonucleic acid (RNA)]. Phosphorus is classified as a macronutri-ent for plant growth, and is a limiting nutrimacronutri-ent in many
soils [1, 2]. Unlike nitrogen (N), P cannot be fixed from
atmospheric sources; it can only be obtained by uptake
from soil via plant roots as orthophosphate (HPO42− or
H2PO4− depending on soil pH) [3].
In soil, P originates from the weathering of apatites, which are primary P minerals containing calcium (Ca). The orthophosphate released from weathering will move to the soil solution, where it can precipitate as second-ary minerals that are generally associated with Ca,
magnesium (Mg), iron (Fe) and aluminum (Al); sorb to soil particles; or be taken up by plants and microbes and converted to organic P forms (immobilization)
[3]. Organic P forms can be returned to the soil, where
they can sorb to soil particles or be mineralized back to orthophosphate for plant uptake from the soil solution.
Organic P can comprise 35–65% of soil P [4]. Soil
organic P forms are grouped into broad compound classes, each of which can contain a number of P forms
[4]. Orthophosphate esters are subdivided based on the
number of ester linkages. Orthophosphate monoesters have one ester linkage per phosphate, and include sugar phosphates (e.g. glucose 6-phosphate), mononucleotides (e.g. adenosine monophosphate) and inositol phosphates. Inositol phosphates identified in soils include the plant
P storage compound phytate (myo-inositol
hexaphos-phate, myo-IHP) and several of its stereoisomers (scyllo-,
d-chiro- and neo-IHP) [5–7]. Orthophosphate diesters
have two esters per phosphate, and include phospho-lipids, lipoteichoic acids, RNA and DNA. Phospho-nates have a carbon (C)–P bond, and include natural compounds such as ciliatine (2-aminoethyl phosphonic
Open Access
acid) and agricultural chemicals such as glyphosate
[N-(phosphonomethyl) glycine]. Orthophosphate
anhy-drides are linear chains of orthophosphate, linked with energy-rich phosphoanhydride bonds. These can include inorganic and organic compounds, all of which are gener-ally included with organic P due to similarities in dynam-ics and analysis. Organic orthophosphate anhydrides include ATP; inorganic compounds include polyphos-phates, which are chains of two (pyrophosphate) or more orthophosphates. More details on all of these compounds
can be found in Condron et al. [4].
The P that is available for plant uptake from the soil solution can be deficient in many regions, requiring
fer-tilization for optimal crop growth [2, 8]. Animal manure
(AM) and other biochemically stabilized organic wastes have been applied as fertilizers for centuries; chemical inorganic P fertilizers (CF) were introduced in the late 1800s, and their use has significantly expanded globally
since the 1950s [8]. The widespread application of P
ferti-lizers, both AM and CF, has led to concerns with respect to water quality and eutrophication due to excess P from soil that is transferred to water through erosion and runoff
[8, 9]. Additionally, CF is produced from rock phosphate,
and the long-term sustainability of this non-renewable
resource is uncertain [1, 2, 8]. In light of these concerns,
there is a need to improve P use efficiency in agriculture, to minimize the need for P fertilizer application.
Many methods have been proposed to improve P use efficiency in crop production. These include targeted
fertilization [8], plant breeding for traits such as rooting
form, and production of phosphatase and organic acids
[1, 2], and enhanced microbial P cycling in the
rhizos-phere [1, 2]. Key to all of these is an understanding of soil
P dynamics, especially those of organic P forms [9, 10].
Historically, organic P forms have received less attention than inorganic P forms, in part because they are more
difficult to study [4]. As such, a detailed understanding
of the organic P forms contributed to soils from plants, microbes and organic amendments, and the pathways by which these are recycled to plant-available P forms, is lacking relative to that for inorganic P. Advanced spec-troscopic tools are required to characterize P forms, the
most widely used of which is solution 31P nuclear
mag-netic resonance spectroscopy (P-NMR). Since its first use
in soil science in 1980 by Newman and Tate [11], more
than 200 papers have been published that have used P-NMR to characterize soil P forms. However, relatively few of these have studied cropping systems (defined here as non-pasture systems used for annual or perennial crops), and even fewer of these have linked P forms to management practices or to agronomic indicators such as yield or P balance (the difference between fertilizer inputs and crop removal). This has limited the usefulness
of P-NMR studies to guide agricultural practices to improve P use efficiency, including the role of organic P forms in soil fertility. In order to connect P cycling in soil to sustainable management in agriculture, the knowledge gained from past studies needs to be evaluated and used to direct future research. As such, the objectives of this manuscript are (1) to review prior studies using P-NMR to investigate soil P forms and dynamics in field studies of non-pasture cropping systems; and (2) to identify knowl-edge gaps and suggest directions for future research.
Review
Solution 31P‑NMR spectroscopy
It is not my intention to review the principles of NMR spectroscopy in this manuscript, because that
informa-tion can be obtained elsewhere [e.g. 12, 13]. It is also not
my intention to give extensive information related to the use of P-NMR in soil and environmental science, as that
has been covered in several other review papers [14–17].
However, a brief overview is needed to help understand the strengths and weaknesses of the studies discussed below.
Solid-state P-NMR is rarely used for soil studies; instead, solution (liquid-state) P-NMR is preferred for
the improved spectral resolution [14, 15]. Soil total P
concentrations are generally in the mg kg−1 range; thus,
concentrating soil extracts increases the P concen-tration per NMR sample, significantly improving the NMR response. In the early years of soil P-NMR work, a number of different extractants were used, with little
standardization among research groups [14, 15],
mak-ing it difficult to compare results. In 1996, Cade-Menun
and Preston [18] introduced the use of 0.25 M sodium
hydroxide (NaOH) + 0.05 M disodium
ethylenediami-netetraacetic acid (Na2EDTA) as an extractant, based
on a method to measure total soil organic P [19]. Once
extracted, solutions are lyophilized to concentrate P. This is now the most widely used extraction procedure
for soil and other environmental samples [17]. However,
as discussed in detail elsewhere [17], other
dissimilari-ties exist among groups with respect to sample extrac-tion (e.g. soil:extractant ratios), dissoluextrac-tion of lyophilized extracts for NMR analysis, NMR acquisition parameters, and methods to identify and quantify specific P forms. In some early studies, research groups concentrated their
extracts with dialysis [e.g. 20, 21]. While this improved
The early soil P-NMR work produced spectra that were often very broad, with little resolution of indi-vidual peaks. As such, P forms were identified as com-pound classes only (e.g. orthophosphate, orthophosphate
monoesters) [11, 20–28]. There were few attempts to
identify specific P forms, and the identification of some
compounds such as choline phosphate [23] has since
been shown to be incorrect [29]. Advances over time
now allow the majority of peaks to be identified with spiking experiments and compound libraries, although it is still difficult to distinguish some specific forms such
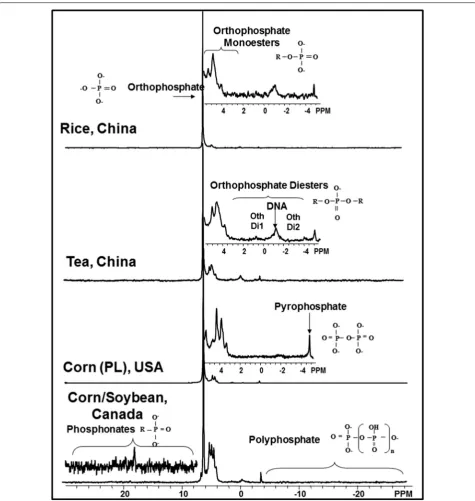
as mononucleotides [29]. Figure 1 shows spectra from
several recent studies of P in cropping systems [30–32];
more information about the samples can be found in the published studies. The P compounds of interest in
soil science generally fall between 30 and −30 ppm, and
include (from left to right, Fig. 1) phosphonates, from 30
to ~8 ppm; orthophosphate at ~6 ppm; orthophosphate monoesters, at ~7 to 6.1 ppm and ~5.9 to ~2.5 ppm;
orthophosphate diesters from 2.5 to −3.9 ppm;
pyroph-osphate at about −4.2 ppm; and polyphosphates at −4
(end group) and from −5.3 to −30 ppm (mid-chain).
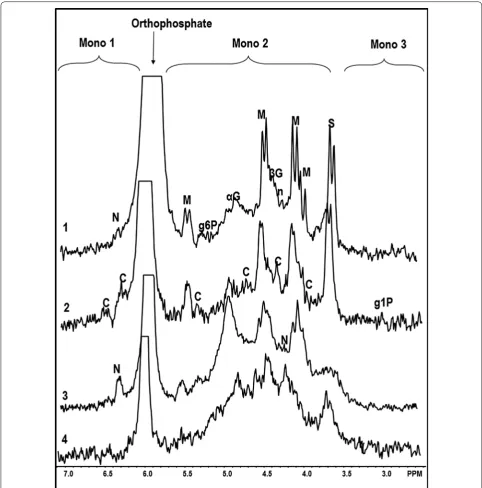
More details of the orthophosphate monoester region are
shown in Fig. 2, with spectra from published studies [32,
33], and unpublished data (B. Cade-Menun). The
spec-tra are labeled in the manner used by the Cade-Menun research group. More information about the chemical shifts of these and other P compounds can be found in
published compound libraries [29, 34].
One of the biggest improvements in recent years involves the identification of peaks for degrada-tion compounds. These are compounds that were orthophosphate diesters in the soil, but which have degraded to orthophosphate monoesters during extrac-tion and analysis. It is generally now agreed that α- and β-glycerophosphates are degradation products from phospholipids, while most mononucleotides (e.g.
adenosine monophosphate) originate from RNA [29,
34–37]. There has long been an interest in quantifying
total orthophosphate monoesters and total orthophos-phate diesters in soil; diesters are thought to be more labile, while many monoesters are more recalcitrant
due to strong sorption to mineral surfaces [4]. As such,
the ratio of orthophosphate monoesters to orthophos-phate diesters (M:D) has been used to predict organic P
cycling in soils [4, 23]. In addition, activities of the soil
enzymes acid monoesterase, alkaline monoesterase and
diesterase are commonly measured [4], and linked back
to total orthophosphate monoester and diester
concen-trations in models [e.g., 38]. However, if corrections are
not made for degradation products, the M:D and models are of questionable value for predicting mineralization of
organic P forms [37].
Unless compounds labeled with other P isotopes (32P,
33P) have been used in experiments, all P in soils is 31P. As
such, P-NMR is a quantitative method, allowing the con-centrations of P forms to be determined. This is can be done by measuring the P concentration in the soil extract if the entire extract is used for the NMR experiment, or by measuring the P in the prepared NMR sample after analysis if only a portion of the lyophilized extract is used. In either case, this is done by digestion and colori-metric analysis or by analysis with inductively coupled plasma optical emission spectroscopy (ICP-OES); the percentage of each peak, determined from the spectrum by integration and/or deconvolution, is then multiplied
by the P concentration [14, 15, 17]. Concentrations can
also be determined by integration against a peak from a standard with a known P concentration spiked into the
sample [17].
Solution 31P‑NMR studies of cropland soils
The P-NMR literature for pasture soils was recently
reviewed [39]; as such, this section of the manuscript will
review studies that have used P-NMR to characterize P in non-pasture soils used to grow annual or perennial crops. Most commercial crop production relies heav-ily on fertilization with CF or AM to optimize yields, so improvements in P use efficiencies could have the great-est benefits in these systems.
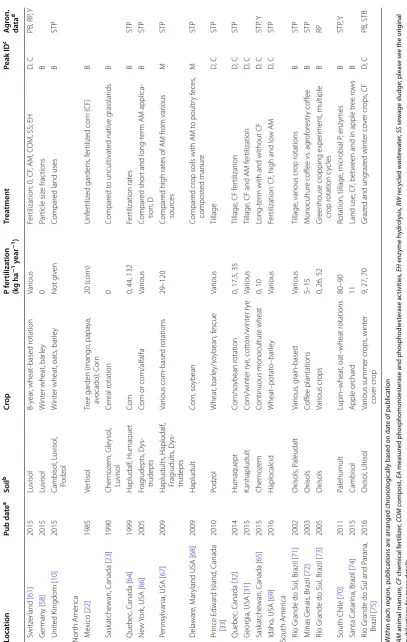
Studies using P-NMR to characterize P in cropping
sys-tems are listed in Table 1. These are grouped by country
and listed by date of publication. The soil classifications listed are from the original manuscripts; no attempt was made to convert them to a single classification system. Other information given includes the crops, P
fertiliza-tion history (kg P ha−1 year−1), and the treatments the
study was designed to investigate. The degree of peak identification is ranked as B, M or D; B is broad com-pound classes only (e.g. orthophosphate monoesters); M is moderate, with some more specific
identifica-tions, usually of myo-IHP; and D indicates spectra with
detailed peak identifications, generally confirmed with spiking experiments. Studies that have identified deg-radation peaks and ideally corrected the calculation of total orthophosphate monoesters for diester degradation compounds are indicated with a C. If agronomic data such as soil test P, yield or P balances were included in the study this is indicated in the final column. Blanks in any column for any paper indicate that the information was not included in the original publication. Some stud-ies included other land uses, such as forests, in addition
to cropping systems but the information in Table 1 is
[e.g. 40–46], as well as incubation studies using soils from
crop field [46, 47].
In Africa, there have been two studies from Mada-gascar and one each from Tanzania, Ethiopia and West
Cameroon [24, 26–28, 48]. Four of these studies were
published in 2003 or earlier, used NaOH as an
extract-ant [24, 26–28], and identified only broad compound
classes. One study used dialysis on sample extracts [26],
which likely distorted the relative peak areas. One study
from Madagascar [48] used NaOH–EDTA and identified
peaks in detail, including degradation compounds. In
Asia, there was one study from Northern Thailand [23]
and eight studies from various provinces in China [30, 38,
49–54]. One study used NaOH [25], the remainder used
NaOH–EDTA [30, 38, 49–54], and none used dialysis.
Although the majority of studies were published in 2012 or later, only two included detailed peak identifications
and corrections for degradation [30, 54]. Four studies
from Australia were included [35, 55–57], two of which
sampled from the same fields under the same crops [35,
Fig. 2 Example spectra from cropping systems from various locations, showing details of the orthophosphate monoester region. 1 barley/corn, no till, Prince Edward Island, Canada [33]; 2 corn, France; 3 corn/soybean, no till, Quebec, Canada [32]; 4 Rice, China. Samples 2 and 4 are unpublished spectra. Mono general orthophosphate monoester regions; α-G α‑glycerophosphate; βG β‑glycerophosphate; Cd‑chiro inositol hexaphosphate
Table 1 S tudies in N or th A meric a, E ur op e and S outh A meric a using
31P-NMR t
o in
vestiga
te P in soil under cr
opping sy st ems , sor ted b y lo ca tion Loca tion Pub da te a Soil b Cro p P f er tiliza tion (k g ha −
1 y
ear − 1) Tr ea tmen t Peak ID c A gr on. da ta d A
frica Madagascar [
24 ] 1990 Fer rosol , Andosol Rice 20 P f or
ms in r
ice soils B Nor ther n Tanzania [ 26 ] 2000 Luvisol Cor n, beans Var ious For ests vs . f er tiliz
ed (0 CF vs
. A M) cr opping syst ems B Ethiopia [ 27 ] 2002 Alisol , N itr isol Tea, cor n, cor n/sor ghum Var ious Cr opping syst ems; D e B STP W est C amer oon [ 28 ] 2003 Palehumult
Tea plantation, f
ood cr op fields Var ious For est vs . cr opping syst ems (per manent, annual) B STP M adagascar [ 48 ] 2006 Oxisols Rice Var ious Diff er ent r ice cr opping syst ems; CF , A M, C OM M STP , Y A
sia Nor
ther n Thailand [ 25 ] 2000 Cambisol Cabbage Not g iv en Cultivat ed vs . nativ e f or ests B Shen
yan, China [
49 ] 2012 Luvisol Cor n, r ice
35 or 47
Land use t
ypes
, EA
B
STP
Zhejang
, China [
30 ] 2013 Ultisol Rice , t ea, v egetables , nurser y st ock , bamboo Var ious Cr ops; D, C STP
Henan, China [
38 ] 2014 Cambisol W int
er wheat/summer cor
n 59 Tillage , r esidue incor poration, agg regat es , EA B STP
Jilin, China [
50 ] 2014 Phaeo zem Cor n–so
ybean each y
ear 45 Tillage , agg regat es B STP
Jilin, China [
51 ] 2014 Phaeo zem Continuous cor n monocultur e Var ious Fer
tilization, CF and A
M, EA
M
STP
Y
unnan, China [
52 ] 2015 Ultisols Vegetables , hor ticultur e 118.5–196.5 Land use
, leaching losses; f
or ests vs . open cr opland , g reenhouses B STP Nor theast er
n China [
53 ] 2015 Gle ysol , lithosol Cr opland (wint
er wheat summer
cor n), v egetables , or char ds Land use , f er
tilization, EA, sor
ption
M
STP
Shandong
, China [
54 ] 2016 Gle ysol Gr eenhouse , double ‑cr op tomat oes Var ious CF , A
M; high N f
er tiliz er , leaching D, C PB , STP A
ustralia New S
outh W ales [ 55 ] 2008 Luvisol
Continuous wheat, wheat
–leg ‑ ume r otations 20 Tillage , stubble , r otation, micr obial communit y B RP , Y Ne w S outh W ales [ 35 , 56 ] 2009, 2011 Haplor thod , F rag iudult Vegetables Pastur e vs . con
ventional and or
ganic v
egeta
‑
bles and hor
ticultur e D, C Ne w S outh W ales , Queens ‑ land [ 57 ] 2014 Ver tisol Grain ‑fallo w ‑cott on, pulse ‑fallo w ‑ cott on 6 ( ev er
y 2 y
ears)
Ver
tisols in A
ustralia D STP Eur ope , Israel G er man y, D enmar k [ 20 , 21 ] 1996, 1999 Eutr ochept, Hapludalf
Wheat, beet, bar
le y r otation 0–39 Compar ed f er tiliz ed , cultivat
ed fields t
o nativ e soils; par ticle siz e; D B STP F inland [ 59 ] 2011 Cambisol Bar le y, wint er r ye
, pea, oats r
ota ‑ tion Var ious Or ganic ( A M) vs . con ventional ( CF) r otations B STP , PB Sw eden [ 60 ] 2013 Cambisol , P haeo zem, Umbr isol Grain ‑based r otation Var ious Soil t ex tur es , f er tilization rat es ( CF , A M) M STP , PB England [ 62 ] 2013 Paleudalf W int er wheat 0 pH g radient D RP Israel [ 63 ] 2014 Chr omo xer er t Co rn 40 R W
, 10 CF
Irr
igation, f
er
tilization with CF or R
W
D,
C
Table 1 c on tinued Loca tion Pub da te a Soil b Cro p P f er tiliza tion (k g ha −
1 y
ear − 1) Tr ea tmen t Peak ID c A gr on. da ta d Switz er land [ 61 ] 2015 Luvisol 8‑ year , wheat ‑based r otation Var ious Fer
tilization; 0, CF
, A
M, C
OM, SS; EH
D, C PB , RP , Y G er man y [ 58 ] 2015 Luvisol W int
er wheat, bar
le y 0 Par ticle siz e frac tions B Unit ed K ingdom [ 10 ] 2015 Cambisol , L uvisol , Podz ol W int
er wheat, oats
, bar le y Not g iv en Compar
ed land uses
B STP Nor th Amer ica M exico [ 22 ] 1985 Ver tisol Tr ee gar den (mango , papa ya, av ocado); C or n 20 ( cor n) Unf er tiliz ed gar dens , f er tiliz ed cor n ( CF) B Sask at che wan, C anada [ 23 ] 1990 Cher no zem, Gle ysol , Luvisol Cer eal r otation 0 Compar ed t o uncultivat ed nativ e g rasslands B Quebec , C anada [ 64 ] 1999 Hapludalf , Humaquet Co rn
0, 44, 132
Fer tilization rat es B STP Ne w Yor
k, USA [
66 ] 2005 Frag iudepts , D ys ‑ trudepts Cor
n or cor
n/alfalfa
Var
ious
Compar
ed shor
t and long
‑t er m A M applica ‑ tion; D B STP P
ennsylvania, USA [
67 ] 2009 Hapludults , Hapludalf , Frag iudults , D ys ‑ trudepts Var ious cor n‑ based r otations 29–120 Compar
ed high rat
es of A
M fr om var ious sour ces M STP D ela war e, M ar
yland USA [
68 ] 2009 Hapludult Cor n, so ybean Compar ed cr
op soils with A
M t o poultr y f eces , compost ed manur e M STP P rince E dwar d Island , C anada [ 33 ] 2010 Podz ol Wheat, bar le y/so ybean, f escue Var ious Tillage D, C STP Quebec , C anada [ 32 ] 2014 Humaquept Cor n/so ybean r otation
0, 17.5, 35
Tillage
, CF f
er tilization D, C STP G eor
gia, USA [
31 ] 2015 Kanhapludult Cor n/wint er r ye , cott on/wint er r ye Var ious Tillage
, CF and A
M f er tilization D, C Sask at che wan, C anada [ 65 ] 2015 Cher no zem Continuous monocultur e wheat 0, 10 Long ‑t er
m with and without CF
D,
C
STP
, Y
Idaho
, USA [
69 ] 2016 Haplocalcid Wheat –potat o–bar le y Var ious Fer tilization: CF
, high and lo
w A M D, C STP South Amer ica R
io Grande do Sul
, Brazil [
71 ] 2002 Oxisols , P aleudalt Var ious , g rain ‑based Var ious Tillage; var ious cr op r otations B STP M inas G erais
, Brazil [
72 ] 2003 Oxisols Coff ee plantations 5–15 M onocultur e coff ee vs . ag rof or estr y coff ee B STP R
io Grande do Sul
, Brazil [
73 ] 2005 Oxisols Var ious cr ops
0, 26, 52
Gr eenhouse cr opping exper iment, multiple cr op r otation c ycles B RP S
outh Chile [
70 ] 2011 Palehumult Lupin– wheat, oat –wheat r otations 80–90 Rotation, tillage , micr obial P , enz ymes B STP , Y Santa C atar
ina, Brazil [
74 ] 2015 Cambisol Apple or char d 11
Land use; CF
, bet
w
een and in apple tr
ee r
ows
B
R
io Grande do Sul and P
arana, Brazil [ 75 ] 2016 Oxisol , Ultisol Var
ious summer cr
ops , wint er co ver cr op
9, 27, 70
Graz
ed and ung
raz ed wint er co ver cr ops , CF D, C PB , STB W
ithin each r
eg ion, publica tions ar e ar ranged chr onolog
ically based on da
te of publica
tion AM animal manur e, CF chemical f er tiliz er , CO M c ompost , EA measur ed phosphomonoest er
ase and phosphodiest
er ase ac tivities , EH enz yme h ydr oly sis , RW rec ycled w ast ew at er , SS sew
age sludge; please see the or
ig inal publica tions f or mor e details
a Y
ear of publica
tion
b A
s r
epor
ted in the or
ig
inal publica
tion
c P
eak iden
tifica
tion: B
, br
oad (only c
ompound classes); C, monoest
ers c or rec ted f or diest er deg rada
tion peaks; D
, detailed (most peaks iden
tified); M, moder
at
e (some peaks iden
tified)
d A
gr
onomic inf
or
ma
tion w
as included; PB
, P balanc
e(input –r emo val); RP , r esin ‑e xtr ac table P ; STP
, soil t
est P (
Olsen P
, M
ehlich P);
Y, yield
e D: e
xtr
ac
ted sample dialyz
ed pr
ior t
o NMR analy
56]. Three studies identified peaks in detail, with
correc-tion for degradacorrec-tion [35, 56, 57].
In Europe, two studies from Germany and Denmark
used the same research plots [20, 21], but both used
dial-ysis and identified only broad peaks. There was a more
recent study from Germany [58], one each from Finland,
Sweden and Switzerland [59–61]; one specifically from
England [62] and one from the United Kingdom in
gen-eral [10]. The study from Israel is included here too [63].
Three of these studies identified only broad compound
classes [10, 58, 59], one identified the majority of peaks
[60] and three identified peaks in detail [61–63]. In North
America, there was one study from Mexico [22], five
from Canada [23, 32, 33, 64, 65] and five from the USA
[31, 66–69]. The early studies identified only broad peaks
[22, 23, 64, 66]. These used NaOH as the extractant, and
one study used dialysis [66]. All remaining studies from
North America used NaOH–EDTA as the extractant. The two studies from 2009 identified some of the peaks
[67, 68], while the remainder identified peaks in detail.
In South America, there was one study from Chile [70]
and five from Brazil [71–75]. The majority of studies
from South America used NaOH–EDTA as an extract-ant, although several studies added additional steps such as pre-extraction with resin and a final treatment with
Chelex [71–73]. Only one study from South America
identified peaks in detail and corrected for degradation
[75].
The crops that have been studied include food crops for
humans [e.g. wheat (Triticum aestivum L.), rice (Oryza
sativa L.)] and livestock [e.g., corn (Zea mays L.),
for-age oats (Avena strigose Screb.)], and cash crops [e.g.
tea (Camellia sinensis L.), coffee (Coffea arabica L.)]. In
North America, Europe and Australia, P-NMR has been used most frequently to study annual crops, generally rotations based on wheat or corn. In Africa and Asia, more studies have investigated soils in vegetable and rice production. There have been very few studies of
perma-nent plants, with three studies investigating tea [27, 28,
30], one study of coffee plantations [72], and one in an
apple orchard [74].
Cropping systems have often been included in land use
studies, and compared to forests [20, 21, 26, 28, 52, 53]
or grasslands [10, 23, 75]. With respect to management
practices, fertilization was the most studied practice, and included CF and AM, as well as alternate fertilizers
such as compost, sewage sludge and waste water [48, 61,
63]. The next most studied management practice is
till-age, with studies in China [38, 50] Australia [55], the USA
[31], Canada [32, 33], Chile [70] and Brazil [71].
For improved P use efficiency in agriculture, studies need to not only identify P forms, but also relate both concentrations and changes in P forms to agronomic
indicators such as yield or P use efficiency. Of the 44
stud-ies listed in Table 1, many do not even include measures
of soil test P (STP), and only nine include information on
yield or P balances [48, 54, 55, 59–61, 65, 70, 75]. Of these
nine, only six identified peaks in enough detail (M or D) to identify trends in P forms other than orthophosphate
[48, 54, 60, 61, 65, 75]. I will focus on these studies in
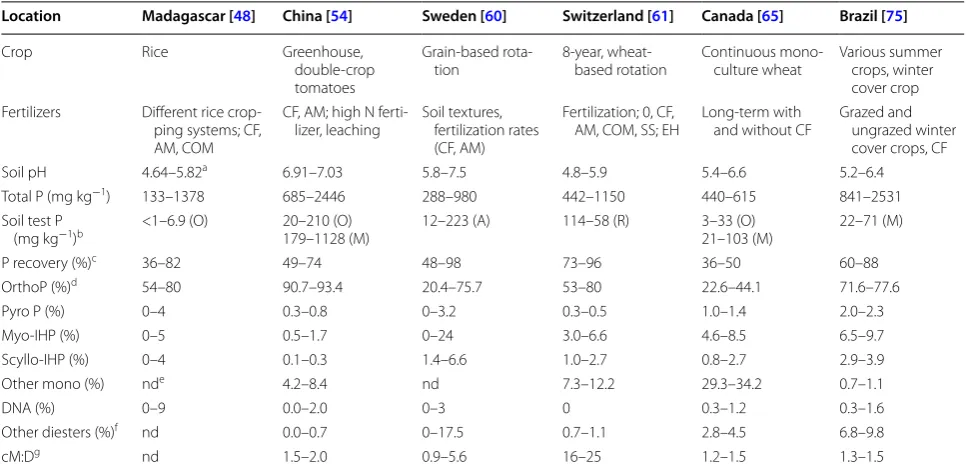
more detail, and they are summarized in Table 2.
The studies that included detailed peak identifications and yield information were studies of rice in Madagascar
[48], greenhouse-grown tomatoes in China [54],
wheat-based crop rotations in Sweden [60] and Switzerland
[61], continuous wheat monoculture in Canada [65], and
summer rotations [including corn, soybean (Glycine max
(L.) Merrill), common bean (Phaseolus vulgaris L.)] with
a grazed winter wheat cover crop in Brazil [75]. One had
only CF [65], one had CF plus grazing of winter cover
crops [75], two were fertilized with CF and AM [54, 60],
one had fertilization with CF, AM, and compost [48],
and one studied fertilization with CF, AM, compost and
sewage sludge [61]. Information about soil pH, soil total
P and soil test P concentrations is included in Table 2.
These ranged considerably for each study depending on the location and treatments. All studies extracted soils for P-NMR with NaOH–EDTA. The recoveries of total P in the NaOH–EDTA extracts ranged from 36 to 96%
(Table 2), again varying with location and treatment. The
P-NMR results are reported as percentages of extracted
P in Table 2 to simplify comparisons among studies. All
of the soils in the studies from Madagascar, China and Brazil received some P fertilizers, and all contained high percentages of orthophosphate. The study from Canada included samples from plots that were fertilized from 1967 to 2010, and plots that were fertilized from 1967 to 1995, with no P from 1995 to 2010. The studies from Swe-den and Switzerland included plots receiving no P for 30 or 60 years, respectively, plus fertilization at various rates with different fertilizers. The percentages of orthophos-phate in the studies from Canada, Sweden and Switzer-land varied with P fertilization, and were always lowest in soils receiving no P for the length of the study, as were the soil test P concentrations. The percentages of pyroph-osphate and DNA were low across all treatments in all
studies. The percentage of myo-IHP varied with P
treat-ment, and was highest with the lowest fertilization, while
scyllo-IHP was present in most samples from all studies,
differences among fertilizer types (CF, AM, etc.) within studies; the main differences resulted from differences in P rates applied to soils from each fertilizer. The use of non-CF fertilizers did not build up organic P; organic P was higher in plots not receiving fertilizer, mainly from the drawdown of inorganic P. In Madagascar, there were no differences in yields with treatments. In Canada, fer-tilizer cessation had also not affected yields, although orthophosphate and STP had decreased. In Switzerland, yields varied among treatments, but P was not the only
limited nutrient. For all studies with a 0-P treatment [60,
61, 65], orthophosphate decreased in those plots, but
organic P species remained the same or increased. This suggests that crops are drawing orthophosphate down faster than it is being replenished by mineralizing organic P forms. And the relatively low percentages of DNA and P degradation forms from phospholipids and RNA sug-gest that the P extracted for NMR in these studies is from
other sources than microbes [4].
Information such as that which is shown in Table 2
needs to be obtained from a wider range of studies, with respect to soils, crops and fertilizers. This in turn could
be used to enhance P use efficiency, with further testing. For example, does orthophosphate decrease and organic P increase because organic P forms are more tightly sorbed and less available for hydrolysis? If so, then crop breeding or soil microbial inoculation could be used to enhance the production of organic acids or phosphatases to mineralize organic P forms. However, without the detailed information about P forms and their dynam-ics that can be obtained from the use of advanced stud-ies such as P-NMR, it will be more difficult to develop appropriate strategies to improve P use efficiency.
Future research needs
Solution P-NMR spectroscopy is a powerful technique, producing information not available from other meth-ods. However, the reliability of quantitative data depends on the correct set up of acquisition parameters, e.g.
with delay times long enough for full relaxation [17].
This is true for all future P-NMR studies, not just those of cropland soils. Extraction and analytical procedures should also be standardized among research groups, to enhance comparisons of data sets, and all peaks should
Table 2 Summary of P-NMR results from selected studies
AM animal manure, CF chemical fertilizer, COM compost, EA measured phosphomonoesterase and phosphodiesterase activities, EH enzyme hydrolysis, RW recycled wastewater, SS sewage sludge, please see the original publications for more details
a Range for all depths and treatments
b Soil test P: A, ammonium lactate; M, Mehlich; O, Olsen; R, Resin c Percentage of total P extracted in NaOH–EDTA
d Percentage of spectral area
e Could not be determined from information in the publication
f Calculated from information for α‑ and β‑glycerophosphate and nucleotides as given in paper, if not already calculated in the paper g Corrected for diester degradation compounds
Location Madagascar [48] China [54] Sweden [60] Switzerland [61] Canada [65] Brazil [75]
Crop Rice Greenhouse,
double‑crop tomatoes
Grain‑based rota‑
tion 8‑year, wheat‑based rotation Continuous mono‑culture wheat Various summer crops, winter cover crop Fertilizers Different rice crop‑
ping systems; CF, AM, COM
CF, AM; high N ferti‑
lizer, leaching Soil textures, fertilization rates (CF, AM)
Fertilization; 0, CF,
AM, COM, SS; EH Long‑term with and without CF Grazed and ungrazed winter cover crops, CF
Soil pH 4.64–5.82a 6.91–7.03 5.8–7.5 4.8–5.9 5.4–6.6 5.2–6.4
Total P (mg kg−1) 133–1378 685–2446 288–980 442–1150 440–615 841–2531
Soil test P
(mg kg−1)b <1–6.9 (O) 20–210 (O)179–1128 (M) 12–223 (A) 114–58 (R) 3–33 (O)21–103 (M) 22–71 (M)
P recovery (%)c 36–82 49–74 48–98 73–96 36–50 60–88
OrthoP (%)d 54–80 90.7–93.4 20.4–75.7 53–80 22.6–44.1 71.6–77.6
Pyro P (%) 0–4 0.3–0.8 0–3.2 0.3–0.5 1.0–1.4 2.0–2.3
Myo‑IHP (%) 0–5 0.5–1.7 0–24 3.0–6.6 4.6–8.5 6.5–9.7
Scyllo‑IHP (%) 0–4 0.1–0.3 1.4–6.6 1.0–2.7 0.8–2.7 2.9–3.9
Other mono (%) nde 4.2–8.4 nd 7.3–12.2 29.3–34.2 0.7–1.1
DNA (%) 0–9 0.0–2.0 0–3 0 0.3–1.2 0.3–1.6
Other diesters (%)f nd 0.0–0.7 0–17.5 0.7–1.1 2.8–4.5 6.8–9.8
be identified and confirmed with spiking experiments
[29]. Calculations of total orthophosphate monoesters
and diesters, and the M:D ratio, should be corrected for
diester degradation products [37]. And field replicates
need to be analyzed by P-NMR as much as possible, rather than compositing samples, to allow statistical anal-yses of P-NMR results along with other field data.
For studies of agricultural soils, especially those comparing management practices, published papers need to include as much agronomic data as possible. At the very minimum, some measure of STP needs to be included, as well as yield data and P balances. Ide-ally, P-NMR studies of management practices should also link changes in P forms to agronomic data related to those practices, which has been poorly done in the past. Although tillage has been shown to alter the dis-tribution of soil P forms in several studies from around
the world [31–33, 37, 50, 55, 70, 71], these changes in
P forms were not linked to yield in any of these stud-ies, making it difficult to determine if changing P forms makes any difference agronomically. Phosphorus NMR studies of agriculture that do not link the identified P forms to agronomic values become esoteric technical studies rather than practical management studies, and are more limited in their wider use.
The majority of studies to date are static studies, cap-turing the point in time when samples were collected. Sampling needs to be coupled to active changes in crops during the growing seasons such as seed germination (for annual plants) and flowering, and P-NMR measurements should be paired with other techniques such as enzyme assays or microbial community analysis to relate P forms to P dynamics. Long-term studies of cropping systems
are available in many countries [e.g., 60–62, 65, 71, 75];
these should be coupled with shorter greenhouse studies
to capture P dynamics at different time scales [e.g. 73].
And if orthophosphate is indeed the P form most affected by management, then there is a need to pair P-NMR studies with complementary techniques that better char-acterize orthophosphate forms, such as sequential
frac-tionations and P-XANES [e.g., 30, 65, 69].
There is a need to understand the inputs into soil from various plant materials (roots, shoots, etc.), and changes
in these inputs from changing soil P status [76–78]. And
while the P forms in manures have been fairly
well-char-acterized [16] and their dynamics in soil generally
well-studied, there is a need for more information on alternate
fertilizers, particularly recycled wastes [e.g., 60, 79–81]
and their behavior in soil [61, 80]. The range of cropping
systems investigated with P-NMR has been limited to date, as have the countries in which it has been used to characterize soil P. There is a particular need to charac-terize P forms and their dynamics in tropical soils, which
sorb P more strongly, and where there are greater
con-cerns with respect to food security [28].
Conclusions
Since its first use in soil science in 1980, P-NMR has been a valuable tool to characterize P forms. In agriculture, there is recognition of the need to improve P use effi-ciency, arising from concerns about eutrophication from soil P loss and the long-term sustainability of rock phos-phate stores from which chemical fertilizers are made. The prior publications reviewed here show that P-NMR can be a valuable tool in studies to improve agricultural P use efficiency, when conducted properly to maximize quantitative information. However, P-NMR studies to date have been limited with respect to cropping systems and geographic locations. Therefore, further research using P-NMR is needed globally on a wider range of crops to fully understand the dynamics in soil of this val-uable crop nutrient.
Acknowledgements
I acknowledge and thank the other participants at the Organic Phosphorus meeting and the 8th International Phosphorus Workshop, held in England and Germany, respectively, in September 2016. Discussions at these meetings revealed the need for this review topic, and influenced its focus. I gratefully acknowledge my many research collaborators on past and future projects.
Competing interests
The author declares that she has no competing interests.
Consent for publication
I am the submitting author and I accept the conditions of submission. As an employee of the Government of Canada, this work is covered by Crown Copyright.
Publisher’s Note
Springer Nature remains neutral with regard to jurisdictional claims in pub‑ lished maps and institutional affiliations.
Received: 7 December 2016 Accepted: 16 March 2017
References
1. Richardson AE, Lynch JP, Ryan PR, Delhaize E, Smith FA, Smith SE, Harvey PR, Ryan MH, Veneklaas EJ, Lambers H, Oberson A, Culvenor RA, Simpson RJ. Plant and microbial strategies to improve the phosphorus efficiency of agriculture. Plant Soil. 2011;349:121–56.
2. Faucon MP, Houben D, Reynoird JP, Mercadal‑Dulaurent AM, Armand R, Lambers H. Advances and perspectives to improve the phosphorus avail‑ ability in cropping systems for agroecological phosphorus management. Adv Agron. 2015;134:51–79.
3. Pierzynski GM, McDowell RW, Sims JT. Chemistry, cycling and potential movement of inorganic phosphorus in soils. In: Sims JT, Sharpley AN, editors. Phosphorus, agriculture and the environment. Monograph no 46. Madison: Soil Science Society of America; 2005. p. 53–86.
5. Turner BL, Papházy MJ, Haygarth PM, McKelvie ID. Inositol phosphates in the environment. Phil Trans R Soc Lond. 2002;357:449–69.
6. Turner BL, Cheesman AW, Godage HY, Riley AM, Potter BVL. Determina‑ tion of neo‑ and d‑chiro‑inositol hexakisphosphate in soils by solution 31P
NMR spectroscopy. Environ Sci Technol. 2012;46:4994–5002. 7. Giles CD, Cade‑Menun BJ. Phytate in animal manure and soils: Abun‑
dance, cycling and bioavailability. Chapter 9. In: He Z, Zhang H, editors. Applied manure and nutrient chemistry for sustainable agriculture and environment. New York: Springer; 2014. p. 163–90.
8. Withers PJA, Sylvester‑Bradley R, Jones DL, Healey JR, Talboys PJ. Feed the crop not the soil: rethinking phosphorus management in the food chain. Environ Sci Technol. 2014;48:6523–30.
9. Dodd RJ, Sharpley AN. Recognizing the role of soil organic phosphorus in soil fertility and water quality. Resour Conserv Recycl. 2015;105B:282–93. 10. Stutter MI, Shand CA, George TS, Blackwell MSA, Dixon L, Bol R, MacKay
RL, Richardson AE, Condron LM, Haygarth PM. Land use and soil factors affecting accumulation of phosphorus species in temperate soils. Geo‑ derma. 2015;257–258:29–39.
11. Newman RH, Tate KR. Soil phosphorus characterization by 31P nuclear magnetic resonance. Commun Soil Sci Plant Anal. 1980;11:835–42. 12. Keeler J, Understanding NMR. Spectroscopy. 2nd ed. Hoboken: Wiley;
2011.
13. Claridge TDW. High‑resolution NMR techniques in organic chemistry. 3rd ed. Amsterdam: Elsevier; 2016.
14. Cade‑Menun BJ. Using phosphorus‑31 nuclear magnetic resonance spectroscopy to characterize phosphorus in environmental samples. In: Turner BL, Frossard E, Baldwin D, editors. Organic phosphorus in the environment. Wallingford: CABI Publishing; 2005. p. 21–44.
15. Cade‑Menun BJ. Characterizing phosphorus in environmental and agricultural samples by 31P nuclear magnetic resonance spectroscopy. Talanta. 2005;66:359–71.
16. Cade‑Menun BJ. Characterizing phosphorus in animal waste with solu‑ tion 31P NMR spectroscopy. In: He Z, editor. Environmental chemistry of animal manure. New York: Nova Science Publishers, Inc; 2011. p. 275–99. 17. Cade‑Menun BJ, Liu CW. Solution 31P‑NMR spectroscopy of soils from
2005 to 2013: a review of sample preparation and experimental param‑ eters. Soil Sci Soc Am J. 2014;78:19–37.
18. Cade‑Menun BJ, Preston CM. A comparison of soil extraction procedures for 31P NMR spectroscopy. Soil Sci. 1996;161:770–85.
19. Bowman RA, Moir JO. Basic EDTA as an extractant for soil organic phos‑ phorus. Soil Sci Soc Am J. 1993;57:1516–8.
20. Guggenberger G, Christensen BT, Rubæk G, Zech W. Land‑use and fertilization effects on P forms in two European soils: resin extraction and 31P‑NMR analysis. Eur J Soil Sci. 1996;47:605–14.
21. Rubæk GH, Guggenberger G, Zech W, Christensen BT. Organic phospho‑ rus in soil size separates characterized by phosphorus‑31 nuclear mag‑ netic resonance and resin extraction. Soil Sci Soc Am J. 1999;63:1123–32. 22. Zech W, Alt HG, Zucker A, Kögel I. 31P‑NMR‑spectroscopic investigations
of NaOH‑extracts from soil with different land use in Yucatan (Mexico). Z Pflanzenernaehr Bodenk. 1985;148:626–32.
23. Condron LM, Frossard E, Tiessen H, Newman RH, Stewart JWB. Chemical nature of organic phosphorus in cultivated and uncultivated soils under different environmental conditions. J Soil Sci. 1990;41:41–50.
24. Zech W, Forster JC, Rakotoasimbola S, Fardeau JC. Caractérisation, par spectrométrie RMN du 31P, de constituants phosphatés extraites de sols de rizières malgaches. Cah. ORSTOM sér Pédol. 1990;XXV:243–51. 25. Möller A, Kaiser K, Amelung W, Niamskul C, Udomsri S, Puthawong M,
Haumaier L, Zech W. Forms of organic C and P extracted from tropical soils as assessed by liquid‑state 13C‑and 31P‑NMR spectroscopy. Aust J Soil Res. 2000;38:1017–35.
26. Solomon D, Lehmann J. Loss of phosphorus from soil in semi‑arid north‑ ern Tanzania as a result of cropping: evidence from sequential extraction and 31P‑NMR spectroscopy. Eur J Soil Sci. 2000;51:699–708.
27. Solomon D, Lehmann J, Mamo T, Fritzsche F, Zech W. Phosphorus forms and dynamics as influenced by land use changes in the sub‑humid Ethiopian highlands. Geoderma. 2002;105:21–48.
28. Tchiendoua Zech W. Chemical and spectral characterization of soil phosphorus under three land uses from an Andic Palehumult in West Cameroon. Agric Ecosyst Environ. 2003;100:193–200.
29. Cade‑Menun BJ. Improved peak identification in 31P‑NMR spectra of environmental samples with a standardized method and peak library. Geoderma. 2015;257–258:102–14.
30. Liu J, Yang J, Cade‑Menun BJ, Liang X, Hu Y, Liu CW, Zhao Y, Li L, Shi J. Complementary phosphorus speciation in agricultural soils by sequential fractionation, solution 31P NMR, and P K‑edge XANES spectroscopy. J Environ Qual. 2013;42:1763–70.
31. Cade‑Menun BJ, He Z, Zhang H, Endale DM, Schomberg HH, Liu CW. Stratification of phosphorus forms from long‑term conservation tillage and poultry litter application. Soil Sci Soc Am J. 2015;79:504–16. 32. Abdi D, Cade‑Menun BJ, Ziadi N, Parent LE. Long‑term impact of tillage
practices and P fertilization on soil P forms as determined by 31P‑NMR spectroscopy. J Environ Qual. 2014;43:1431–41.
33. Cade‑Menun BJ, Carter MR, James DC, Liu CW. Phosphorus forms and chem‑ istry in the soil profile under long‑term conservation tillage: a phosphorus‑31 nuclear magnetic resonance study. J Environ Qual. 2010;39:1647–56. 34. Turner BL, Mahieu N, Condron LM. Phosphorus‑31 nuclear magnetic
resonance spectral assignments of phosphorus compounds in soil NaOH–EDTA extracts. Soil Sci Soc Am J. 2003;67:497–510.
35. Doolette AL, Smernik RJ, Dougherty WJ. Spiking improved solution phos‑ phorus‑31 nuclear magnetic resonance identification of soil phosphorus compounds. Soil Sci Soc Am J. 2009;73:919–27.
36. Smernik RJ, Doolette AL, Noack SR. Identification of RNA hydrolysis prod‑ ucts in NaOH–EDTA extracts using 31P NMR spectroscopy. Commun Soil Sci Plant Anal. 2015;46:2746–56.
37. Schneider KD, Cade‑Menun BJ, Lynch DH, Voroney RP. Soil phosphorus forms from organic and conventional forage fields. Soil Sci Soc Am J. 2016;80:328–40.
38. Wei K, Chen ZH, Zhu A, Zhang JB, Chen LJ. Application of 31P NMR spec‑ troscopy in determining phosphatase activities and P composition in soil aggregates influenced by tillage and residue management practices. Soil Tillage Res. 2014;138:35–43.
39. Nash DM, Haygarth PM, Turner BL, Condron LM, McDowell RW, Richard‑ son AE, Watkins M, Heaven MW. Using organic phosphorus to sustain pasture productivity: a perspective. Geoderma. 2014;221–222:11–9. 40. Turner BL, Cade‑Menun BJ, Westermann DT. Organic phosphorus compo‑
sition and potential bioavailability in semi‑arid arable soils of the Western United States. Soil Sci Soc Am J. 2003;67:1168–79.
41. Hansen JC, Cade‑Menun BJ, Strawn DG. Phosphorus speciation in manure‑amended alkaline soils. J Environ Qual. 2004;33:1521–7. 42. Briceño M, Escudey M, Galindo G, Borchardt D, Chang A. Comparison of
extraction procedures used in determination of phosphorus species by 31P‑ NMR in Chilean volcanic soils. Commun Soil Sci Plant Anal. 2006;37:1553–69. 43. Ohno T, Hiradate S, He Z. Phosphorus solubility of agricultural soils: a
surface charge and phosphorus‑31 NMR speciation study. Soil Sci Soc Am J. 2011;75:1704–11.
44. Jarosch KA, Doolette AL, Smernik RJ, Tamburini F, Frossard E, Bünemann EK. Characterization of soil organic phosphorus in NaOH–EDTA extracts: a comparison of 31P NMR spectroscopy and enzyme addition assays. Soil Biol Biochem. 2015;91:298–309.
45. Moata MRS, Doolette AL, Smernik RJ, McNeil AM, McDonald LM. Organic phosphorus speciation in Australian Red Chromosols: stoichiometric control. Soil Res. 2016;54:11–9.
46. Leytem AB, Smith DR, Applegate TJ, Thacker PA. The influence of manure phytic acid on phosphorus solubility in calcareous soils. Soil Sci Soc Am J. 2006;70:1629–38.
47. Doolette AL, Smernik RJ, Dougherty WJ. Rapid decomposition of phytate applied to a calcareous soil demonstrated by a solution 31P NMR study. Eur J Soil Sci. 2010;61:563–75.
48. Turner BL. Organic phosphorus in Madagascan rice soils. Geoderma. 2006;136:279–88.
49. Zhang A, Chen Z, Zhang G, Chen L, Wu Z. Soil phosphorus composition determined by 31P NMR spectroscopy and relative phosphatase activities influenced by land use. Eur J Soil Biol. 2012;52:73–7.
50. Wei K, Chen ZH, Zhang XP, Liang WJ, Chen LJ. Tillage effects on phos‑ phorus composition and phosphatase activities in soil aggregates. Geoderma. 2014;217–218:37–44.
52. Li M, Hu Z, Zhu X, Zhou G. Risk of phosphorus leaching from phosphorus‑ enriched soils in the Dianchi catchment, Southwestern China. Environ Sci Pollut Res. 2015;22:8460–70.
53. Zhou B, Vogt RD, Lu X, Yang X, Lu C, Mohr CW, Zhu L. Land use as an explanatory factor for potential phosphorus loss risk, assessed by P indices and their governing parameters. Environ Sci Processes Impacts. 2015;17:1443–54.
54. Yan Z, Chen S, Li J, Alva A, Chen Q. Manure and nitrogen application enhances soil phosphorus mobility in calcareous soils in greenhouses. J Environ Manage. 2016;181:26–35.
55. Bünemann EK, Marschner P, Smernik RJ, Conyers M, McNeill AM. Soil organic phosphorus and microbial community composition as affected by 26 years of different management strategies. Biol Fertil Soils. 2008;44:717–26.
56. Doolette AL, Smernik RJ, Dougherty WJ. A quantitative assessment of phosphorus forms in some Australian soils. Soil Res. 2011;49:152–65. 57. McLaren TI, Smernik RJ, Guppy CN, Bell MJ, Tighe MK. The organic compo‑
sition of vertisols as determined by 31P NMR spectroscopy. Soil Sci Soc Am J. 2014;78:1893–902.
58. Jiang X, Bol R, Willbold S, Vereecken H, Klumpp E. Speciation and distribu‑ tion of P associated with Fe and Al oxides in aggregate‑sized fraction of an arable soil. Biogeosciences. 2015;12:6443–52.
59. Soinne H, Uusitalo R, Sarvi M, Turtola E, Hartikainen H. Characterization of soil phosphorus in differently managed clay soil by chemical extrac‑ tion methods and 31P NMR spectroscopy. Commun Soil Sci Plant Anal. 2011;42:1995–2011.
60. Ahlgren J, Djodjic F, Börjesson G, Mattsson L. Identification and quanti‑ fication of organic phosphorus forms in soils from fertility experiments. Soil Use Manage. 2013;29:24–55.
61. Annaheim KE, Doolette AL, Smernik RJ, Mayer J, Oberson A, Frossard E, Bünemann EK. Long‑term addition of organic fertilizer has little effect on soil organic phosphorus as characterized by 31P NMR spectroscopy and enzyme additions. Geoderma. 2015;257–258:67–77.
62. Turner BL, Blackwell MSA. Isolating the influence of pH on the amounts and forms of soil organic phosphorus. Eur J Soil Sci. 2013;64:249–59. 63. Zohar I, Cade‑Menun B, Paytan A, Shaviv A. Phosphorus transformations
from reclaimed wastewater to irrigated soil: a 31P NMR study. Soil Sci Soc Am J. 2014;78:1884–92.
64. Zhang TQ, Mackenzie AF, Sauriol F. Nature of soil organic phosphorus as affected by long‑term fertilization under continuous corn (Zea mays L.): a 31P NMR study. Soil Sci. 1999;164:662–70.
65. Liu J, Hu YF, Yang JJ, Abdi D, Cade‑Menun BJ. Investigation of soil legacy phosphorus transformations in long‑term agricultural fields using sequential fractionation, P K‑edge XANES and solution P‑NMR spectros‑ copy. Environ Sci Technol. 2015;49:168–76.
66. Lehmann J, Lan Z, Hyland C, Sato S, Solomon D, Ketterings QM. Long‑ term dynamics of phosphorus forms and retention in manure‑amended soils. Environ Sci Technol. 2005;39:6672–80.
67. Dou Z, Ramberg CF, Toth JD, Wang Y, Sharpley AN, Boyd SE, Chen CR, Williams D, Xu ZH. Phosphorus speciation and sorption‑desorption characteristics in heavily manured soils. Soil Sci Soc Am J. 2009;73:93–101.
68. Hill JE, Cade‑Menun BJ. Phosphorus‑31 nuclear magnetic resonance spectroscopy transect study of poultry operations on the Delmarva Peninsula. J Environ Qual. 2009;37:1–9.
69. Weyers E, Strawn DG, Peak D, Moore AD, Baker LL, Cade‑Menun B. Phosphorus speciation in calcareous soils following annual dairy manure amendments. Soil Sci Soc Am J. 2016;80:1531–42.
70. Redel YD, Escudey M, Alvear M, Conrad J, Borie F. Effects of tillage and crop rotation on chemical phosphorus forms and some related biological activities in a Chilean Ultisol. Soil Use Manage. 2011;27:221–8.
71. Rheinheimer DS, Anghinoni I, Flores AF. Organic and inorganic phospho‑ rus as characterized by phosphorus‑31 nuclear magnetic resonance in subtropical soils under management systems. Commun Soil Sci Plant Anal. 2002;33:1853–71.
72. Cardosa IM, Van der Meer P, Oenema O, Janssen BH, Kuyper TW. Analysis of phosphorus by 31PNMR in Oxisols under agroforestry and conventional coffee systems in Brazil. Geoderma. 2003;112:51–70.
73. Gatiboni LC, dos Santos Rheinheimer D, Claro Flores AF, Anghinoni I, Kaminski J, de Lima MS. Phosphorus forms and availability assessed by 31P‑NMR in successive cropped soil. Commun Soil Sci Plant Anal. 2005;36:2625–40.
74. De Oliveira CM, Erich MS, Gatiboni LC, Ohno T. Phosphorus fractions and organic matter chemistry under different land use on Humic Cambisols in Southern Brazil. Geoderma Reg. 2015;5:140–9.
75. Deiss L, de Moraes A, Dieckow J, Franzluebbers AJ, Gatiboni LC, Sassaki GI, Carvalho PCF. Soil phosphorus compounds in integrated crop‑livestock systems of subtropical Brazil. Geoderma. 2016;4:88–96.
76. Noack SR, McLaughlin MJ, Smernik RJ, McBeath TM, Armstrong RD. Phosphorus speciation in manure wheat and canola plants as affected by phosphorus supply. Plant Soil. 2014;378:125–37.
77. Noack SR, Smernik RJ, McBeath TM, Armstrong RD, McLaughlin MJ. Assessing crop residue phosphorus speciation using chemical fractiona‑ tion and solution 31P nuclear magnetic resonance spectroscopy. Talanta. 2014;126:122–9.
78. Doolette AL, Smernik RJ. Phosphorus speciation of dormant grapevine
(Vitis vinifera L.) canes in the Barossa Valley, South Australia. Aust J Grape
Wine Res. 2016;22:462–8.
79. Preston CM, Cade‑Menun BJ, Sayer BG. Characterization of Canadian backyard composts: chemical and spectroscopic analyses. Compost Sci Util. 1998;6:53–66.
80. Smith MTE, Cade‑Menun BJ, Tibbett M. Soil phosphorus dynamics from sewage sludge at different stages in a treatment stream. Biol Fertil Soils. 2006;42:186–97.