R E S E A R C H
Open Access
Multiple-image super-resolution on
mobile devices: an image warping approach
Neil Patrick Del Gallego
*and Joel Ilao
Abstract
This paper discusses a super-resolution (SR) system implemented on a mobile device. We utilized an Android device’s camera to take successive shots and applied a classical multiple-image super-resolution (SR) technique that utilized a set of low-resolution (LR) images. Images taken from the mobile device are subjected to our proposed filtering scheme wherein images that have noticeable presence of blur are discarded to avoid outliers from affecting the produced high-resolution (HR) image. The remaining subset of images are subjected to non-local means denoising, then feature-matched against the first reference LR image. Successive images are then aligned with respect to the first image via affine and perspective warping transformations. The LR images are then upsampled using bicubic
interpolation. AnL2-norm minimization approach, which is essentially taking the pixel-wise mean of the aligned images, is performed to produce the final HR image.
Our study shows that our proposed method performs better than the bicubic interpolation, which makes its implementation in a mobile device quite feasible. We have also proven in our experiments that there are substantial differences from images captured using burst mode that can be utilized by an SR algorithm to create an HR image.
Keywords: Super-resolution, Mobile devices, Mean fusion, Image warping
1 Introduction
Image super-resolution (SR) refers to a class of tech-niques that produce a high-resolution (HR) image from observed low-resolution (LR) images. This LR image is initially upsampled to a higher desired resolution. Upsampling is normally done through image interpola-tion. However, high-frequency details are lost in image interpolation. Super-resolution attempts to recover the lost high-frequency details from an image after the initial upsampling step. This is referred to as the inversion of the image formation process [1], as seen in Fig. 1.
There are two known techniques for super-resolution, multiple-image SR and single-image SR. In this study, we explored the multiple-image SR technique on a mobile device by utilizing a set (N= 10) of observed LR images, that denote the same scene. We prove that multiple images captured using the burst mode feature of mobile devices can be utilized to create a super-resolved image. These input images undergo our proposed sharpness measure test in order to remove images with observable presence
*Correspondence: [email protected] De La Salle University, Manila, Philippines
of blur. The remaining subset of images are subjected to non-local means denoising and then image warping such that the LR images correspond to the same planar sur-face in respect of the reference LR image. Afterwards, all the observed LR images are merged to generate the HR image. Merging the LR images to generate the HR images is performed using anL2-norm SR minimization approach
[2]. This technique reverses the effects of aliasing and properly recovers the HR image.
Using this technique and a scaling factor of 4, we eval-uated the performance using real images taken from a mobile device and discussed the results. Our initial results using real images captured from a mobile device show noticeable improvement on the quality of HR images pro-duced. We therefore present the following contributions:
1. Introduce a prototype application for performing multiple-image SR on a mobile device. Our approach has fast execution time and low memory footprint. 2. Proposed an automated ground-truth selection
scheme to provide an unbiased assessment of our SR method.
3. Proved that capturing successive images using the burst mode feature of mobile devices contains
Fig. 1Super-resolution involves the inversion of the image formation process [1]
sufficient information to tackle the super-resolution problem.
4. Tested and discussed results of real images taken from a mobile device. From our review of related work, only the work of Chu (2013) also tested their proposed algorithm on real images from a mobile device [3].
5. Proposed a filtering scheme that removes unwanted images prior to performing the SR algorithm to improve the results.
2 Related work
This section discusses the related work of this research. The research of Chu (2013) is closely related to our study wherein they address the super-resolution problem using the Shift-Add fusion technique [3, 4]. The initial HR image is further refined using a customized image regulariza-tion scheme tailored for mobile devices. Our approach is therefore influenced by their study. The related work section is divided accordingly, as follows: solving the downsampling problem, denoising, deblurring, identify-ing presence of motion, and image regularization. Lastly, we discuss how SR algorithms are assessed.
2.1 Overview
Images that are downsampled lose actual pixel values from its HR counterpart. Recent works in super-resolution specialized in solving the downsampling problem and assumed that images do not have any blur or motion present. The method called Adjusted Anchored Neigh-borhood Regression proposed by Timofte et al. (2015) managed to produce HR images with acceptable qual-ity provided that the LR image counterparts are sharp
[5, 6]. According to the authors, SR is mainly concerned with upscaling the image without losing its sharpness. In the context of images taken from mobile devices, noise, blur and motion affect the quality of the image pro-duced. Thus, it is necessary to apply some techniques to attempt to solve the SR problem when other degradation factors are present. However, it is known that remov-ing these unwanted effects are computationally heavy. In fact, each of these areas can be considered as a research problem on its own. There are separate research areas in denoising [7–9], and in deblurring (tackling out of focus or motion blur) [10–12]. We highlight the meth-ods presented on these areas in the in the succeeding subsections.
2.2 Solving the downsampling problem
The simplest approach to solve the downsampling prob-lem is to perform interpolation. However, image inter-polation does not recover high-frequency details in the HR image. Recent works in SR deal with single images and apply machine learning or regression mechanisms to associate an LR image patch to an HR image patch coun-terpart. The algorithm proposed by Timofte et al. (2015) is the fastest known method under this approach [5]. While it is considerably fast, it does not tackle other degradation factors as identified by Mitzel et al. (2009) and presented in Fig. 1 [1].
In the context of multiple-image SR, Shift-Add fusion was proposed by Simpkins and Stevenson (2012) to solve the downsampling problem which is a fundamental oper-ation of the multiple-image SR technique [4]. Given an LR image (or a set of LR images), recovering the missing pixels on the HR grid is done based from the pixel values found
Fig. 3Under known motion estimates, each pixel inLR1. . .LR4 corresponds to a specific location in the HR image [4]
on the LR image set. Shift-Add fusion attempts to reverse the effects of aliasing.
An LR image shows signs of aliasing, which is a distor-tion or artifact caused by different sampling rates used to produce digital images [13]. It is a fundamental problem that affects the quality of digital images. Refer to Fig. 2 for discussion.
The left image represents the HR ground-truth image and a simulated LR observation on the right is created. A magnification factorSof 3 is used to simulate the LR observation. Notice the artifacts introduced caused by aliasing. The aliasing effect is what makes digital images visually unappealing. Different aliased images make it possible to recover an HR image [4]. Works of Chu (2013), Peleg, Keren, and Schweitzer (1987), Huang and Tsay (1984) revolved around this idea [3, 14, 15].
The theoretical basis for SR is best explained in the fre-quency domain [4, 16]. However, most SR works are per-formed on the spatial domain and it is here where intuitive techniques are proposed [16]. The concept of Shift-Add fusion is simple. It is known that each LR observation con-tains spatial shifts [4]. If motion estimates properly model
the spatial shifts found in the set of LR observations (either explicitly stated or an estimation procedure is performed), then each LR pixel corresponds to a certain missing pixel in the HR image as seen in Fig. 3. We therefore, properly recover the HR image.
2.3 Denoising
Images captured from the mobile device contains unwanted noise. Simple noise removal can be performed by filtering. However, denoising methods perform bet-ter than basic filbet-tering such as median filbet-ter. The study of Yoshida, Murakami and Ikehara (2013) tackled the SR problem based on non-local means denoising [8, 17]. We also applied the technique of Buades et al. (2011). The difference in our technique is that image denoising is performed prior to upsampling because we observed that performing denoising after upsampling did not yield observable differences. This makes the denoising algo-rithm execute faster.
2.4 Deblurring
According to Simpkins and Stevenson (2012), the pres-ence of blur in the input LR images will make it theoreti-cally impossible to recover the high-frequency details via Shift-Add fusion approach [4]. Deblurring itself is a dense research area. We only discuss the work of Chu (2013) in this subsection. The work of Chu (2013) managed to sim-plify this problem by considering linear motion of shaken angle and shaken length. The small aperture of most cam-eras installed on mobile devices lead to short focal length and deep depth-of-field (DOF) of the camera [3].
To prove this statement, Chu (2013) conducted an experiment by taking images with induced camera shake from a mobile device, and from a digital camera. Figure 4, taken from the discussion of Chu (2013), shows that the motion blur induced by shaking the mobile device is lin-ear, where a linear blur kernel is a slanting dotted line. The digital camera shows a non-linear motion blur. Therefore,
Fig. 5The pixel grid with question marks denote missing pixels not properly determined by the Shift-Add fusion technique
they conclude that linear motion deblurring is applicable for mobile devices [3].
2.5 Identifying presence of motion
Motion estimation is essential in identifying the assign-ment of pixel values in the HR grid for the Shift-Add fusion technique. It is also used for image registration. The image warping technique, which was used in our study, is used to properly align the images of the same scene. Other methods involve the use of optic flow fields, as shown in the study of Chu (2013). Dense optical flow like the Lucas-Kanade method is not appropriate for mobile devices due to its slow execution time.
Pixel-level motion displacement was formulated by Farneback (2003) which may seem ideal for the Shift-Add fusion technique [18]. We attempted to use this technique but our initial results show that image warping performs better than using the method proposed by Farneback (2003).
2.6 Image regularization
Regularization introduces additional information to a function in order to solve an ill-posed problem or avoid overfitting. Regularization is also applied to the SR prob-lem. The concept of image regularization attempts to
further refine or recover the HR image that is otherwise not covered properly by the Shift-Add fusion technique [4]. Suppose that there are still missing pixel values in the HR image. This is normally caused by undersampled or missing observed pixels in the LR set, or the values are simply not reliable. Refer to Fig. 5 for this discussion. The question marks denote missing pixels that were not recovered using the Shift-Add fusion technique. Shift-Add fusion works together with image regularization such that when the Shift-Add fusion fails to recover all supposed pixel values in the HR image, the image regularization model would fulfill the remaining work.
Image regularization is also called regularized image reconstruction which is referred to as "inpainting" in other related works [4, 19]. Image regularization works by attempting to determine the missing pixel values, denoted by an image mask, as seen in Fig. 6.
2.7 Assessment of SR techniques
Performance assessments of SR algorithms use ground-truth HR images that are downsampled to produce the corresponding LR images. Some works introduced noise or blur operators to further distort the LR image [20–22]. This LR image is used as input to the system and SR is performed to produce a super-resolved HR image. The super-resolved HR image is compared with the ground-truth image to assess how much details were actually recovered. Common measurements are peak signal-to-noise ratio (PSNR), structural image similarity (SSIM), root mean squared error (RMSE), and pixel-based average error [16].
3 Methodology and system implementation
This section discusses the implementation of our pro-posed system, which is heavily derived from the concepts discussed in Section 2. A prototype was developed, which is capable of performing multiple-image SR on Android devices. These devices can be set to capture photos in burst mode, wherein a series of shots are taken succes-sively. This feature was introduced on Android 5.0. Com-parable results were observed using a scaling factor,S=4, rather thanS=2. Thus, we only discuss the results using
this value on this paper by measuring the PSNR, RMSE, and SSIM of our super-resolved image.
3.1 Measuring the differences between images
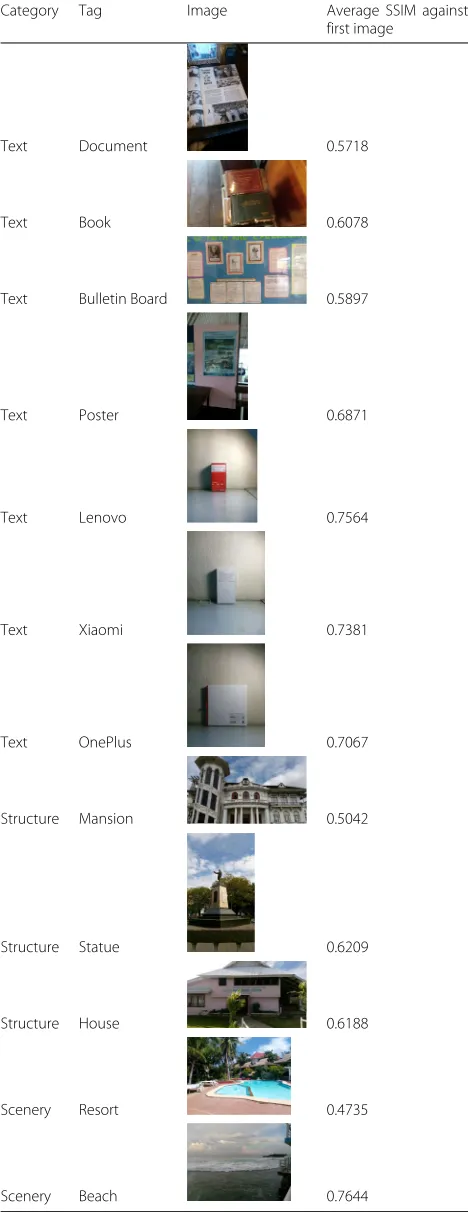
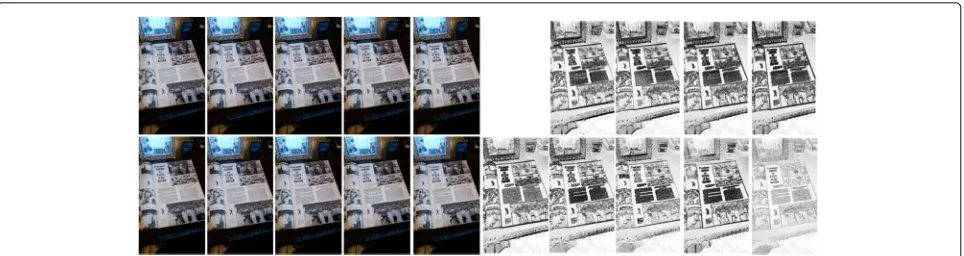
Multiple-image SR technique will be applicable if each LR image present in a given set contains unique information. To validate this claim, we performed an experiment to measure the differences of each LR image against the first LR image taken. We performed this test prior to using the images as input for our system. We used the SSIM (struc-tural image similarity) measure as our preferred metric to quantify the differences present. In this case, a low SSIM indicates noticeable differences when compared to the first LR image. On all our seven test images, a mean SSIM of 0.6004 were obtained, which is favorable for our study. Table 1 shows the average SSIM per image. Figure 7 shows the best case wherein differences are observably present in the LR image set.
3.2 Assessment technique and ground-truth image selection
Our methodology for assessing our SR technique is similar to related works (discussed in Section 2.7) [16]. How-ever, we observed from multiple-image SR works [1, 2, 23] that no objective method were discussed regarding ground-truth selection. The study of Chu (2013) used a different camera and used the images taken from it as ground-truth [3]. Single-image SR works commonly used benchmark images from public dataset as ground-truth and test images were downsampled from it [5, 20, 21, 24]. Few research works on SR, however, utilize objective per-formance measures such as PSNR, RMSE, and SSIM. Only the visual quality are assessed [1, 2, 23]. From our review of related work, the work of Chu (2013) managed to tackle their results using the SSIM measure [3].
With no concrete standard on related literature, we therefore present our proposed assessment technique and ground-truth image selection for multiple-image SR tackled on a mobile device. We can choose to manu-ally pick our own ground-truth image from the image set but doing so will introduce bias on our tests. Nor-mally, ground-truth images should be clear and blur should be minimal (or none at all). With this reason-ing, we formulated an automated approach wherein the best image from a given set is selected as the ground-truth. The selected image is then removed from the input set and then the input set is forwarded to our SR algorithm to formulate an approximate HR image as close to the ground-truth image selected. The automated ground-truth image selection approach is discussed in the “Appendix”.
Our assessment technique is illustrated in Fig. 8. The input LR images, without the ground-truth image, are downsampled prior to feeding it into the system. The
Table 1Images tested and their average difference measured by SSIM. Lower value indicates greater difference from the first LR image
Category Tag Image Average SSIM against first image
Text Document 0.5718
Text Book 0.6078
Text Bulletin Board 0.5897
Text Poster 0.6871
Text Lenovo 0.7564
Text Xiaomi 0.7381
Text OnePlus 0.7067
Structure Mansion 0.5042
Structure Statue 0.6209
Structure House 0.6188
Scenery Resort 0.4735
Fig. 7An example of SSIM map for the document image. Darker values denote greater differences from the first LR image
output HR image produced is compared with the ground-truth image using PSNR, RMSE, and SSIM.
3.3 System architecture
Our system accepts a set of LR images wherein the first LR image serves as the base LR image. The LR images undergo a feature-selection scheme wherein LR images that are affected by blur are removed. The selected LR images are feature-matched, and affine transformation and perspective warping were performed to the images with respect to the base LR image. We then performed an “interpolation and fusion” approach [23] and performed averaging to combine the images and produce the HR image. This is essentially taking the pixel-wise mean that has been proven by Farsiu et al. (2004) as a multiple-image SR method usingL2-norm minimization [2]. We discuss
this technique further in relation to the diagram shown in Fig. 9. Specific details for each major step in the system architecture are further broken down into subsections in this paper.
Initial input LR images undergo our automated sharp-ness measure test. This approach is similar to our ground-truth image selection scheme briefly mentioned in Section 3.2. Details about this test is discussed in “Appendix”. The goal of this test is to measure the sharp-ness of all the input images and compute the mean. Images with sharpness values that fall below the mean are dis-carded as this will just degrade the overall result of the produced HR image.
Therefore, given a set of filtered LR images, {L0. . .LN},
L0is upsampled to produce nearest-neighbor interpolated
HR image, and a bicubic interpolated HR image for com-parison. Using the LR image set, {L0. . .LN}, the images
undergo the following steps: non-local means denoising, affine warping, perspective warping, bicubic interpola-tion, then mean fusion.
3.4 Non-local means denoising
Filtered images {L0. . .LN} are subjected to non-local
means (NLM) denoising method [8]. Denoising is to prevent unwanted artifacts in the input images from manifesting in the HR image. The intention of NLM denoising is to mitigate that problem. NLM denoising was also derived from the study of Protter and Elad (2009) which formulated a super-resolution reconstruc-tion method based from NLM and also from Yoshida, Murakami and Ikehara (2013) which proposed a different SR approach based from self-similarity and NLM [17, 25]. The difference in our proposed method is to directly apply NLM denoising on the luminance channel of the image and perform it as a separate task instead of performing super-resolution at the same time. This process is also performed prior to performing our proposed SR method unlike other works.
3.5 Feature matching, affine and perspective warping The subset, {L1. . .LN}, is subjected to image warping using
matched features toL0. Feature-matching is done using
Fig. 9Multiple-image SR system architecture
the ORB descriptor [26], which was introduced by Rublee (2011). Once the features have been found on images in {L1. . .LN}, the keypoints are matched toL0using a
brute-force approach and refined by RANSAC. This method is seen in Fig. 10.
Once the features have been matched, {L1. . .LN} are
warped, by identifying the affine and perspective trans-formation using L0 as the source point, to produce
{W1. . .WN}.
This concept is illustrated in Fig. 11 wherein the warped images correspond to a similar point in a planar surface. When the images are merged, it is supposed to blend properly as one combined image.
3.6 Combining warped images to form the HR
Once the warped images have been processed, the warped images are combined using mean fusion as illustrated in Fig. 12. LetW0=L0, so we now have the set {W0. . .WN}.
{Wˆ0. . .WˆN} can therefore be derived from {W0. . .WN} by
simply upsampling the images individually. For this study, we simply performed bicubic interpolation on the images so no missing pixel values needs to be regularized. We then performed mean fusion approach to combine the images which is formally a multiple-image SR method usingL2-norm minimization [2].
3.7 Other details on implementation
We implemented a prototype on an Android device and used the camera burst mode to take 10 images to be
Fig. 10Feature matching using ORB descriptor. Points are matched using brute-force with simple distance thresholding and further refined by RANSAC
fed into the SR system. The images enter the modules described in the previous subsections as a whole set. Indi-vidual images are processed in each module in a sequential manner. Like other SR works, we only performed our pro-posed SR method on the luminance (Y) channel of the images and simply performed bicubic interpolation on the chroma channels (UV).
4 Results and observations
Using the methodology mentioned in Section 3, results are discussed here as well as our visual evaluations of the test images. We tested the following on the following test images summarized in Table 1. A visual compari-son is provided against the ground-truth image as well as numerical metrics such as PSNR (peak signal to noise ratio), RMSE (root mean squared error), and SSIM (struc-tural image similarity). Note that the scaling factor used in the experiments is 4.
Results using PSNR, RMSE, and SSIM are provided in Tables 2, 3, and 4, respectively. The structure of this section is to discuss different cases where the system per-forms best, and cases where the system does not perform favorably.
4.1 Test cases using images with text
The proposed system works best with images that con-tain texts, as edges are properly recovered. Two examples, usingText_NewspaperandText_BookCover, are shown in Fig. 13. Although the SSIM difference for the document is minimal from the bicubic image (0.0070 difference), the texts have been properly recovered by our proposed SR method.
4.2 Out-of-focus images
Fig. 11How images should correspond to a certain point in a planar surface [27]
the example shown in Fig. 14. Image subjects are out-of-focus when the user has difficulty selecting a out-of-focus point for the camera, the camera auto-focus mode is disabled, or there is not enough time to focus on the subject during image capture (i.e., user is in a moving vehicle, attempting to capture a fixed subject outside).
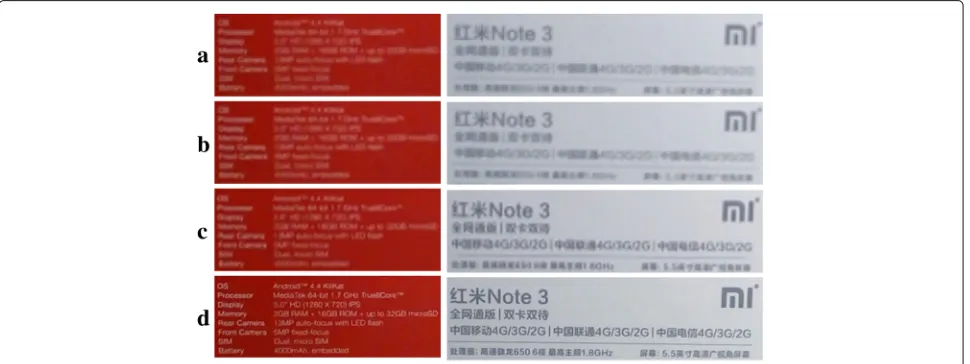
Figure 15 shows the results of the system under such cases. Images for Text_Lenovo and Text_Xiaomi image sets have been captured with auto-focus mode disabled, which should produce the same issue presented in image in Fig. 14a. The ground-truth image has been captured separately with focus mode enabled and locked on the subject properly. Despite this limitation, our proposed system manages to recover some of the texts, which makes it more readable than the results obtained from interpo-lation methods. Numerically, the results are also better than bicubic interpolation (0.0223 improvement). Thus, for such cases wherein focusing on the subject is difficult, our proposed system is recommendable.
4.3 Tolerance to noise
The system performs well in reducing the level of noise in the final HR image, due to the denoising step and the mean fusion process. For this experiment, the sample image set, One+_Noise, was used and random noise was added to the input images, as seen in ImageJ in Fig. 16. The denoising step and the mean fusion process noticeably reduce image noise and properly restore high-frequency information, as observed in the visual comparison in Fig. 16. The SSIM of our proposed system is also significantly higher (0.1975 difference), than the bicubic interpolation method.
4.4 Outdoor text images with proper focus
Text_BulletinBoardandText_Posterimage sets are taken from outdoors, with proper focus on the image subject. The focus point was locked on the subject while acquir-ing the images, which is the opposite of the experiment discussed in Section 4.2. The system did not perform as intended on these image sets. The HR images produced by
Table 2PSNR results for images. Higher value is better. Highest/lowest values italicized
PSNR measurement Text_Newspaper Text_BookCover Text_Bulletin Board Structure_Mansion Structure_Statue Structure_House
Nearest-neighbor 16.4686 21.9638 18.6582 17.1456 17.9367 19.2184
Bicubic 16.4538 21.9569 18.6621 17.1563 17.9546 19.2167
SR method 16.2568 22.3743 18.9034 17.3134 19.5573 20.0862
PSNR measurement Text_Poster Text_Lenovo Specs Text_Xiaomi Specs Scenery_Resort Scenery_Beach One+_Noise
Nearest-neighbor 18.3682 30.1958 25.6326 21.6374 24.648 23.487
Bicubic 18.3741 30.5818 25.6167 21.9283 24.686 23.8614
SR method 18.5287 32.9122 27.5933 22.9866 26.7942 24.8408
our SR method for the announcement board and poster test image can be observed as soft and washed out, and no high-frequency details can be observed. Judging it visu-ally in Fig. 17, our SR method did not manage to recover enough high-frequency details to make the texts read-able. The SSIM results of both images are, otherwise, higher than the bicubic interpolation (0.0206 and 0.0178 difference). The denoising step performed as preprocess-ing may have some high-frequency details filtered as false positives which have affected the overall result of the HR image. Thus, it is observed that the system may not be beneficial on cases wherein capture conditions are already ideal (i.e., camera has successfully locked focus on the subject, user’s hand is steady).
4.5 Test cases on structures
Structure_Statue,Structure_Mansion, andScenery_Resort have man-made structures as the subject. The system does not properly model the edges of the structures and the tex-tures that should ideally be present on the HR image. The denoising step may have removed some high-frequency details that can be utilized for HR reconstruction. While our SR method performed slightly better than the bicubic interpolation (0.0148, 0.0382, and 0.0364 improvement), the results of images in Fig. 18 show that the edges are not observably better than the bicubic interpolation method. The result of the system in Structure_Statue has little visual difference from the bicubic interpolated image. The edges and textures shown in the result of
Structure_Mansionappear soft and washed out. The pool tiles inScenery_Resortwere not present on the HR image.
4.6 Test cases with presence of motion
While the SSIM result of the HR image in
Struc-ture_Mansion and Scenery_Beach are better than the
bicubic image (0.0262 improvement), the system does not perform well on moving objects. Referring to Fig. 19, notice that our SR method introduces a ghosting effect on the leaves that are moving. It is also observed in Fig. 20 where the movement of the waves caused unwanted ghosting effects. Considering this case, it can be taken as a factor for improvement of our SR method. A similar case, discussed in Section 4.5, is also observed in Fig. 20, wherein the textures and the edges of the rock were not fully recovered by the system.
5 Conclusions
In this paper, we developed a prototype application that utilizes a mobile device’s camera to take pictures and applied a classical multiple-image SR technique that uti-lized a set of LR images. In the pre-processing stage, the input LR images undergo a sharpness measure test wherein images that are blurred are discarded from the set. We then performed an “interpolation and fusion” approach and performed averaging to combine the images and produced the HR image. This is essentially taking the pixel-wise mean of the images that has been proven by Farsiu et al. (2004) as a multiple-image SR method using
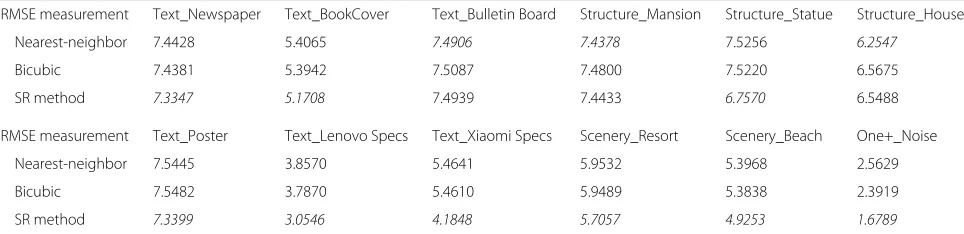
Table 3RMSE results for images. Lower value is better. Highest/lowest values italicized
RMSE measurement Text_Newspaper Text_BookCover Text_Bulletin Board Structure_Mansion Structure_Statue Structure_House
Nearest-neighbor 7.4428 5.4065 7.4906 7.4378 7.5256 6.2547
Bicubic 7.4381 5.3942 7.5087 7.4800 7.5220 6.5675
SR method 7.3347 5.1708 7.4939 7.4433 6.7570 6.5488
RMSE measurement Text_Poster Text_Lenovo Specs Text_Xiaomi Specs Scenery_Resort Scenery_Beach One+_Noise
Nearest-neighbor 7.5445 3.8570 5.4641 5.9532 5.3968 2.5629
Bicubic 7.5482 3.7870 5.4610 5.9489 5.3838 2.3919
Table 4SSIM results for images. Value closer to 1.0 indicates high similarity to the ground-truth. Highest/lowest values italicized
SSIM measurement Text_Newspaper Text_BookCover Text_Bulletin Board Structure_Mansion Structure_Statue Structure_House
Nearest-neighbor 0.6463 0.7397 0.6721 0.5797 0.6631 0.7127
Bicubic 0.6613 0.7531 0.6892 0.5955 0.6772 0.7355
SR method 0.6683 0.7695 0.7098 0.6103 0.7154 0.7617
SSIM measurement Text_Poster Text_Lenovo Specs Text_Xiaomi Specs Scenery_Resort Scenery_Beach One+_Noise
Nearest-neighbor 0.7342 0.8367 0.7748 0.6316 0.8079 0.5199
Bicubic 0.7452 0.8567 0.7877 0.6563 0.8241 0.6155
SR method 0.7630 0.8790 0.8103 0.6945 0.8605 0.8130
L2-norm minimization [2]. Aside from our SR method, we
also introduced a scheme on automating the selection of ground-truth images for unbiased assessments.
As seen from the numerical results, our SR method per-formed justifiably better than interpolation methods in terms of PSNR, RMSE, and SSIM. It has been observed that the system performs best on text images, particularly those captured indoors. The edges of the texts have been properly recovered by the system, making the texts more readable than interpolation methods. The system is par-ticularly suitable for dealing with images that are out-of-focus. Our automated sharpness measure test proves to be effective by managing to select good images for recovering the HR scene despite having out-of-focus samples. Our
proposed method becomes ideal when capturing images where focusing on the subject becomes difficult (i.e., user is in a moving vehicle, attempting to capture a fixed sub-ject outside. The user’s hands are not steady). Vice-versa, if the capture conditions are already ideal (i.e., camera has properly locked focus on the subject, user’s hands are steady), our system does not perform as intended. Thus, a simple bicubic interpolation method may be sufficient to properly produce an HR image from a single LR image with minimal noise and blur.
Should noise be present on the captured images, our denoising step and mean fusion noticeably reduce image noise in the output HR image and properly restore high-frequency information. However, due to the nature of the
Fig. 14An out-of-focus image example. The subject becomes out of focus, as seen in imagea, if the camera did not properly lock its focus. Imageb is noticeably clearer when the camera successfully locked its focus on the subject
mean fusion method, our system is not recommendable for capturing images with presence of subject motion. This introduces ghosting effects and unwanted artifacts that occur when the HR image is produced.
It is also observed that the system does not perform acceptably on images captured outdoors and images with man-made structures. This involves architecture, build-ings, sceneries, and environment, where tiles, repeating patterns, and natural textures are present. Edges are not
properly recovered and textures are incorrectly repre-sented or removed.
Overall, our proposed method is fast as it only involves accumulating the pixel-wise values of the images and then taking the mean. Furthermore, not all LR images from a given set are used because some images that did not pass our sharpness measure test are discarded.
The accuracy of the mean fusion approach is highly dependent on the accuracy of alignment of the LR images.
Fig. 16Result forOne+_Noise.aNearest-neighbor interpolation.bBicubic interpolation.cOur SR method.dGround-truth.iSample input image. jInput image with random noise added
Misalignments caused by moving objects have a ghost-ing effect on the produced HR image. While our work is preliminary, we see some feasibility on further improv-ing our results and a clear direction on our study. First, we will strongly consider transitioning into anL1-norm
minimization SR because the study of Farsiu et al. (2004) showed that it is more robust and highlights edges more clearly [2]. Thus, from a pixel-wise mean,L1-norm
min-imization is essentially performing a pixel-wise median approach. However, due to the nature of computing the
Fig. 18Result forStructure_Statue(top),Structure_Mansion(middle), andScenery_Resort(bottom).aNearest-neighbor interpolation.bBicubic interpolation.cOur SR method.dGround-truth. The result ofStructure_Statuedo not have any observable difference from the bicubic interpolation. The result ofStructure_Mansionappear soft and washed out. Pool tiles were not present in the output ofScenery_Resort
median (sorting then taking the middle value), doing median fusion will greatly affect the processing time. Thus, a clear improvement is to further refine our exist-ing fusion approach to be as close as the accuracy imposed by median fusion, without greatly affecting the processing time.
Another room for improvement is to formally introduce an image regularization scheme such that high-frequency details are properly recovered while minimizing noise. Performing non-local means denoising removes poten-tial high-frequency details that can be utilized for HR reconstruction. Therefore, this approach needs further validation. The next major step for this research after we
have proven that our SR algorithm have more favorable results, is to tackle time and space complexity for per-forming super-resolution on mobile devices. This involves optimizing our system architecture to further reduce computation time and memory footprint.
6 Appendix: edge extraction and sharpness index measure
This section discusses our proposed method of extract-ing edges and measurextract-ing image sharpness. This is used to automatically identify the ground-truth from a given test image set, and for filtering unneeded images as input for the SR algorithm.
Fig. 20Result forScenery_Beach.aNearest-neighbor interpolation.bBicubic interpolation.cOur SR method.dGround-truth. The textures and the edges of the rock were not fully recovered by the system. The movement of the waves caused unwanted ghosting effects
Fig. 21Edges extracted from the input image (first row).Second row: f1,f2.Third row:f3,f4. These are combined to formE(last row)
Given an image,A, to extract edges, we used the follow-ing filter kernels provided by [24].
f1=[−1 0 1] f2=f1T (1)
f3=[1 0 −2 0 1] f4=f3T (2)
Using the vector values provided in Eqs. 1 and 2, f1,f2,f3,f4will be merged by mean fusion to form an
aggre-gate of edges found in imageA. LetEbe the aggregate of edges found in imageA. The results should look like the sample images provided in Fig. 21.
UsingEwith dimension ofH×W, calculating the sharp-ness index measure is performed by counting the nonzero elements ofEand divide it byH×W. The sharpness index measure should have a range of [0.0, 1.0]
Authors’ contributions
The primary author, NDG, performed the study and implemented the prototype as guided by the adviser, JI. Both authors read and approved the final manuscript.
Competing interests
The authors declare that they have no competing interests.
Acknowledgements
Both authors would like to acknowledge the Department of Science and Technology - Philippine Council for Industry, Energy and Emerging Technology for funding this research.
Received: 1 June 2016 Accepted: 16 December 2016
References
1. D Mitzel, T Pock, T Schoenemann, D Cremers, inProceedings of the 31st DAGM Symposium on Pattern Recognition. Video super resolution using duality based tv-l1 optical flow (Springer, Berlin, Heidelberg, 2009), pp. 432–441
2. S Farsiu, MD Robinson, M Elad, P Milanfar, Fast and robust multiframe super resolution. IEEE Trans. Image Process.13(10), 1327–1344 (2004) 3. C-H Chu, Super-resolution image reconstruction for mobile devices.
Multimedia Syst.19(4), 315–337 (2013)
4. J Simpkins, RL Stevenson, inMathematical Optics: Classical, Quantum, and Computational. Methods Chapter No. 16. An introduction to
super-resolution imaging (CRC Press, 2012)
5. R Timofte, V De Smet, L Van Gool, I Reid, H Saito, M-H Yang, inComputer Vision - ACCV 2014: 12th Asian Conference on Computer Vision. A+: Adjusted anchored neighborhood regression for fast super-resolution (Springer, Singapore, 2015), pp. 111–126
6. R Timofte, V De, LV Gool, in2013 IEEE International Conference on Computer Vision. Anchored neighborhood regression for fast example-based super-resolution, (Sydney, 2013), pp. 1920–1927
study of different filtration approaches used in image restoration, (Gwalior, 2013), pp. 157–163
8. A Buades, B Coll, J-M Morel, Non-local means denoising. Image Processing Online.1(2011). http://dl.acm.org/citation.cfm?id=1069066 9. G Ghimpeteanu, T Batard, M Bertalmío, S Levine, A decomposition
framework for image denoising algorithms. IEEE Trans. Image Process. 25(1), 388–399 (2016)
10. R Fergus, B Singh, A Hertzmann, ST Roweis, WT Freeman, inACM SIGGRAPH 2006 Papers. SIGGRAPH ’06. Removing camera shake from a single photograph (ACM, New York, NY, USA, 2006), pp. 787–794 11. L Yuan, J Sun, L Quan, H-Y Shum, inACM SIGGRAPH 2007 Papers. SIGGRAPH
’07. Image deblurring with blurred/noisy image pairs (ACM, New York, NY, USA, 2007)
12. X Chen, X He, J Yang, Q Wu, in2011 IEEE Conference on Computer Vision and Pattern Recognition (CVPR). An effective document image deblurring algorithm, (Colorado Springs, 2011), pp. 369–376
13. DP Mitchell, AN Netravali, inProceedings of the 15th Annual Conference on Computer Graphics and Interactive Techniques. SIGGRAPH ’88.
Reconstruction filters in computer-graphics (ACM, New York, NY, USA, 1988), pp. 221–228
14. S Peleg, D Keren, L Schweitzer, Improving image resolution using subpixel motion. Pattern Recogn. Lett.5(3), 223–226 (1987)
15. TS Huang, RY Tsay, inAdvances in Computer Vision and Image Processing. Multiple frame image restoration and registration, vol. 1 (JAI, Greenwich, 1984), pp. 317–339
16. K Nasrollahi, TB Moeslund, Super-resolution: A comprehensive survey. Mach. Vis. Appl.25(6), 1423–1468 (2014)
17. T Yoshida, T Murakami, M Ikehara, inIntelligent Signal Processing and Communications Systems (ISPACS), 2013 International Symposium On. Image super-resolution method based on non-local means and self similarity, (2013), pp. 509–512. doi:10.1109/ISPACS.2013.6704604 18. G Farnebäck, inProceedings of the 13th Scandinavian Conference on Image
Analysis. SCIA’03. Two-frame motion estimation based on polynomial expansion (Springer, Berlin, Heidelberg, 2003), pp. 363–370 19. A Telea, An image inpainting technique based on the fast marching
method. J. Graph. GPU, Game Tools.9(1), 23–34 (2004)
20. WT Freeman, TR Jones, EC Pasztor, Example-based super-resolution. IEEE Comput. Graph. Appl.22(2), 56–65 (2002)
21. D Glasner, S Bagon, M Irani, inInternational Conference on Computer Vision. Super-resolution from a single image, (Kyoto, 2009)
22. Q Shan, Z Li, J Jia, C-K Tang, Fast image/video upsampling. ACM Trans. Graph.27(5), 153–11537 (2008)
23. C Mancas-Thillou, M Mirmehdi, An introduction to super-resolution text, 305–327 (2007). http://link.springer.com/chapter/10.1007%2F978-1-84628-726-8_14#page-1
24. J Yang, J Wright, TS Huang, Y Ma, Image super-resolution via sparse representation. IEEE Trans. Image Process.19(11), 2861–2873 (2010) 25. M Protter, M Elad, H Takeda, P Milanfar, Generalizing the nonlocal-means
to super-resolution reconstruction. IEEE Trans. Image Process.18(1), 36–51 (2009)
26. E Rublee, V Rabaud, K Konolige, G Bradski, inProceedings of the 2011 International Conference on Computer Vision. ICCV ’11. Orb: An efficient alternative to sift or surf (IEEE Computer Society, Washington, DC, USA, 2011), pp. 2564–2571
27. D Capel, A Zisserman, Computer vision applied to super resolution. Signal Process. Mag. IEEE.20(3), 75–86 (2003)
Submit your manuscript to a
journal and benefi t from:
7Convenient online submission 7Rigorous peer review
7Immediate publication on acceptance 7Open access: articles freely available online 7High visibility within the fi eld
7Retaining the copyright to your article
![Fig. 1 Super-resolution involves the inversion of the image formation process [1]](https://thumb-us.123doks.com/thumbv2/123dok_us/895203.1587026/2.595.60.539.602.720/fig-super-resolution-involves-inversion-image-formation-process.webp)