DOI 10.1007/s12544-011-0051-8
ORIGINAL PAPER
Assessing the value of information for retail distribution
of perishable goods
Marta Flamini·Marialisa Nigro·Dario Pacciarelli
Received: 10 January 2011 / Accepted: 5 April 2011 / Published online: 19 May 2011 © The Author(s) 2011. This article is published with open access at SpringerLink.com
Abstract This paper addresses quantitative methods for estimating the value of information from ITS in urban freight distribution. A real-life application on the retail distribution of perishable goods is considered. The problem is formulated as a vehicle routing prob-lem with soft time windows and time-dependent travel times, and solved by using information affected by different degrees of detail and reliability. The practical performance of these solutions is then evaluated by simulation, to assess the joint benefit of using more re-liable and detailed information with different solution algorithms.
Keywords Information reliability·City logistics· ITS·Vehicle routing·Time-dependent travel times
M. Flamini
Data Management S.p.A., 1, Largo Lido Duranti, 00128, Rome, Italy
e-mail: [email protected] M. Nigro (
B
)Dipartimento di Scienze dell’Ingegneria Civile, Università degli Studi Roma Tre, 62, Via Vito Volterra, 00146, Rome, Italy
e-mail: [email protected] D. Pacciarelli
Dipartimento di Informatica e Automazione, Università degli Studi Roma Tre, 79, Via della Vasca Navale, 00146, Rome, Italy
e-mail: [email protected]
1 Introduction
The increase of congestion in transport system requires innovative approaches to face the need for sustainable mobility. In this context, limiting the impact of freight transport on road congestion is specifically important. In fact, the European freight road transport is expected to increase by 55% by 2020 [1]. The traditional mea-sures to accommodate this growth, such as the ex-pansion of the existing transport networks, cannot be pursued, at least in urban areas. The rationalization of the freight flows in the urban areas is therefore necessary and this need is addressed by City Logistics [2, 3]. One of the basic concepts of city logistics is the use of intermodal terminals. Here, goods incoming from different transport modes (rail, maritime, large trucks) are stored and small vehicles are used for the distribution of freights towards the urban area. Termi-nals are often located in the city neighborhoods, as near as possible to the city center to reduce the distances for truck collection and distribution [4].
Intelligent Transportation Systems (ITS) and tech-nologies can play a key role to optimize the organiza-tion of intermodal terminal and to reduce the impact of freight traffic on urban congestion. In 2008, the Euro-pean commission planned several actions aiming at the introduction of the eFreight concept [5], consisting of the collection of real-time information on the location and condition of transported goods, and of its integra-tion with other supply-chain activities and technologies, such as radio frequency identification (RFID).
of a quantitative method to estimate the value of such information in the optimization process of the retail distribution of perishable goods. The perishable goods market is characterized by the short life time of prod-ucts, sometimes limited to few days, which turns out in a rapid depreciation of the product value. The dis-tribution must therefore comply with strict restrictions on the delivery times. This challenge requires, on one hand, effective optimization algorithms to plan punc-tual deliveries to the retailers at sustainable cost. On the other hand, there is a need for reliable and accurate data on the road network to produce solutions that can be implemented in practice.
Network traffic conditions deeply influence the link travel times that constitute the main input of distri-bution problems. Travel times are affected both by systematic variability (traffic condition in the different time slices) and stochastic variability (unforeseen events, such as accidents or maintenance operations). Therefore, in order to effectively plan the deliveries, time-dependent travel times should be taken into ac-count. Tracking systems based on the RFID technology or GPS offer a new opportunity to collect reliable real-time information about network traffic conditions. Such information can be used both in real time, to locate the position of a vehicle, and off line to estimate the travel time of each element of the network with high level of precision and reliability. However, while the cost of implementing such measurement systems can be easily computed, estimating the value generated by advanced tracking systems is more difficult [6]. In fact, there is a need for scientific studies on the evaluation of the added value generated by advanced tracking systems in distribution. This need motivates the present work.
The main contribution of this paper is the application of a new methodology to quantify the dependency of distribution cost from data reliability and data accuracy. The methodology is tested on a practical case study arising in the urban freight distribution of perishable goods. We consider an intermodal terminal located in the suburban area of Rome (Italy) serving retailers located in the historical center. The center of Rome is characterized by narrow streets and high density of commercial activities, which makes the distribution quite decoupled from the rest of the city since specific small vehicles have to be used in this area (smaller than 3.5 tons). The case study is formulated as a vehicle routing problem with soft time windows (VRPTW) for the deliveries, in which the objective function includes the transportation costs and the cost of late deliveries. Different solution algorithms have been implemented to solve the VRPTW, including simple greedy heuristics
and advanced tabu search algorithms. The effect of in-corporating practical experience of human dispatchers in the solution algorithm is also assessed by construct-ing a new neighborhood which takes into account the geographical position of customers and routes. The de-gree of sensitivity of the different algorithms to process data information has been then evaluated, thus lead-ing to a graphical representation of the dependency of the distribution cost from the data reliability and the algorithm adopted. Also the relation between costs and data accuracy is investigated by representing the evolution of traffic with different numbers of time slices during which traffic conditions are considered constant. The paper is organized as follows. In Section2we re-vise some relevant related works. The research method-ology to assess the information value is described in Section 3. Section4deals with the formal description of the vehicle routing problem. Solution algorithms are described in Section 5 and the computational results are reported in Section 6. Some conclusions follow in Section7.
2 Literature review
In this section we review the recent literature related to this paper. The approach followed in this paper is based on (i) choice of methods and technologies for data collection, (ii) choice of solution algorithms for solving the vehicle routing problem described in the previous section, (iii) computation of the added value generated by data reliability in combination with the chosen solution algorithms. While an increasing num-ber of papers addresses the first two points, there is a substantial lack of scientific research as far as the third point is concerned. Therefore, while this paper focuses on the third issue, we next review the recent literature related to the first two points.
In the last years there has been an increasing inter-est in the literature on commercial vehicle tour data collection and modeling [7]. Jarugumilli and Grasman [8] use RFID technology to enable efficient control of inventory distribution by exchanging real-time in-formation upon arrival at each location. Wang et al. [9] use real time information from different ITS such as RFID and GPS to optimally route and schedule vehicles in logistics and distribution services. Kim et al. [10] propose effective algorithms for data estimation, to be used once measures from the field have been collected.
algorithms. The inclusion of time windows (VRPTW) has been addressed in a large number of papers, mostly in the case in which travel times are time-independent. We cite, among the others: Solomon [12], Russell [13], Bramel and Simchi-Levi [14], Potvin et al. [15], Taniguchi et al. [16]. Cordeau et al. [17] consider soft time windows to take into account late and early delivery.
Time-independent travel times do not adequately represent all the real cases, since in practice travel times can be affected by strong variability both sys-tematic (traffic condition in the different time slices) and stochastic (unforeseen events, such as accidents or maintenance operations). Limited research has been carried out on vehicle routing problems with variable travel times. We cite, among the others: Laporte et al. [18], Malandraki and Daskin [19], Taniguchi et al. [21,22], Kenyon and Morton [23] and Taniguchi and Shimamoto [24].
Ahn and Shin [25] are among the first researchers who studied the vehicle routing problem with time windows and time-dependent costs. Malandraki and Daskin [19] give a formulation of the VRPTW and time-dependent costs, modeling the travel time fluc-tuation with a step function.
Ichoua et al. [20] propose a time-dependent model for a VRPTW, based on time-dependent travel speeds, computed dividing the planning horizon into three time periods. They extended the tabu search heuristic devel-oped by Taillard et al. [26] to solve the problem and performed some experiments to evaluate the model in static and dynamic environments. Fleischmann et al. [27] consider the Time-Dependent Vehicle routing problem (TDVRP), defining the travel time function with a linearized step function. The authors show that all the models, with the exception of [20], are incon-sistent since they do not represent the “no passing” (FIFO) property. Ando and Taniguchi [28] presents a model for minimizing the total costs incorporating the uncertainty of link travel times with the early arrival and delay penalty at customers who set up designated time windows.
3 Research methodology
This section describes the procedure adopted for esti-mating the value of information in our vehicle routing application. The basic idea behind the procedure is that the discrepancy between planned and implemented solutions is only in minor part due to the inherent stochastic nature of travel times. Major differences are
due to the mismatch between the observed data, used to build the planned solution, and the actual travel times occurring in practice. In other words, the actual travel timetijfor a link(i,j)can be expressed astij=dij+sij, wheredijis a deterministic value andsijis a stochastic variable due to perturbation events on transport de-mand and supply. The first quantity dij is the desired value for solving the vehicle routing problem, such as the expected value oftijor a value achieved with a given probability ψ (i.e., such that the probability Pr{tij≤ dij} =ψ). In practice, the exact value oftijis unknown and can only be estimated by collecting measures on the network, which can be affected by measurement errors. Consequently, also the estimation ofdijis affected by measurement errors. We let dest1
ij andtijest1 be the esti-mated values ofdijandtij, respectively.
We call discrepancy the quantity δij=tijest1−dij. If test1
ij is a rough estimate of tij, then the measurement error can be much larger than the inherent stochasticity of the travel time, i.e.,|δij|>>|sij|.
The use of an advanced tracking system may help to collect more reliable information and thus to produce a better estimate test2ij of tij, i.e., an estimate such that |test2ij −dij|<<|test1ij −dij|. The value of such informa-tion is related to the improved performance of the system that would have been achieved if the planned solution was built using the more reliabletest2
ij instead of test1
ij . Since the discrepancy may vary over the different routes to be traversed, we introduce an aggregated valueεthat we call theunreliabilityof the data set. For a urban network with a set N of links, possible aggre-gations are the mean value of the discrepancies over all the links, e.g. the mean valueε= |N1|(i,j)∈N|δij|, or the square mean value ε= |N1|(i,j)∈N(δij)2, or any other aggregated representative of all data discrepancies. In our computational experiments we use the mean value. Our procedure computes the value of information with reference to a given vehicle routing algorithmsA. It requires the production of several solutions withA for varying the unreliabilityεof the data set. Given the data set and a value for the unreliabilityε, we letρp(ε) be the planned solution obtained withAon such data set,ρh(ε)be the associated historical solution, obtained by using the same routing as inρp(ε)and the actual data dijinstead oftest1ij . Since the valuestijare stochastic, also the performance ofρh(ε)is a stochastic variable. We let
π(ε)be the mean value of the performance achieved by
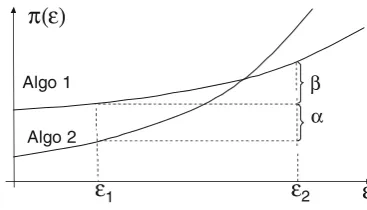
improvementπ(ε2)−π(ε1), like shown by the curves of Fig.1.
In this paper, we focus on computing the relation between data reliability and distribution costs. We do not address the exact computation of the probabilistic uncertainty of the information before and after the introduction of ITS, which is very much related to the technology and the specific setting, and it is the subject of more technology oriented ITS studies. However, it appears from the literature that there are many settings in which suitable technologies, e.g. the RFID technol-ogy, make possible to reduce the unreliabilityεnearly to zero (RFID JournalOctober 2002 [29] and August 2008 [30]).
It is worthwhile to mention that, very likely, different vehicle routing algorithms may have different degrees of sensitivity to process data information. Therefore, when designing an intelligent transport system, it can also be profitable to develop novel vehicle routing algorithms that will use the more reliable information.
Figure 1 shows the cost π(ε) for two algorithms Algo1 and Algo2. Let us first focus on Algo1 and assume that the unreliability of the current informa-tion is ε2. Suppose that an advanced tracking system may reduce the unreliability down toε1. The value of information provided by the advanced tracking system isβ in Fig.1, since this is the cost reduction achieved. Note that the value of information depends on the chosen vehicle routing algorithm. If the adoption of the advanced tracking system is combined with a new algorithm Algo2, then the cost reduction becomesα+
β, i.e., there is an additional benefit α due to Algo2. From Fig.1, it follows that Algo1 is preferable to Algo2 for highly unreliable data while Algo2 becomes the best choice for ε=ε1. In other words, it is important to assess the impact of advanced tracking systems in com-bination with different (simple and advanced) vehicle routing algorithms. Clearly, it is worth paying the cost of implementing the new tracking system and the new algorithm Algo2 only if they generate sufficient ROI
ε
ε
2ε
1π(ε)
Algo 1
Algo 2
α β
Fig. 1 Performance for varying the unreliability
(Return On Investment), i.e., if the implementation cost is smaller thanα+β.
4 Problem description
The problem addressed in this work is a vehicle routing problem with soft time windows of [earliest,latest] de-livery times. An intermodal terminalITmust distribute the required amount of perishable goods to a given set Rof retailers by using a given set Vof vehicles of given capacity. We assume that an unlimited amount of merchandise and number of vehicles is available at IT. Each retailerrrequests a certain quantity of goodsdr to be delivered within a given time window[tr,Tr].
A feasible solution of the problem consists of con-structing a route for each vehicle starting and ending in ITsuch that (i) the demand of each retailer is satisfied, (ii) each retailer is served by exactly one vehicle, and (iii) the capacity of each vehicle is not exceeded. In our model, a vehicle arriving early at a certain retailer will wait until its earliest delivery time.
A vehicle arriving at timear>Trat retailerrincurs a penalty cost wr for late delivery. This penalty wr is proportional to the probability pr that the delivery is refused by the retailer:
wr=γrpr,
where γr is a given constant. We assume pr=0 for on-time deliveries, i.e., fortr≤ar≤Tr. The probability that a delivery is refused is pr =1for a delayar−Tr≥
τmaxand increases linearly from 0 to 1 when the arrival time is in the time window[Tr,Tr+τmax], as in Fig.2.
Letρ be the set of routes in a solution, each associ-ated to the vehicle v(ρi)used for route i. The cost of route i is given by three quantities: (i) the fixed cost fv(ρi) associated to the usage of vehicle v(ρi), (ii) the variable costci(ρi)associated to length of routeρi, and (iii) the penalty costr∈ρiwr(ρi)for late deliveries. The objective function of the problem is therefore:
min
|ρ|
i=1
fv(ρi)+ci(ρi)+
r∈ρi
wr(ρi)
(1)
Fig. 2 Probability of refusing
delivery r
ar 1
5 Algorithms
In this section we describe the solution algorithms used for our analysis. We assess the performance of different vehicle routing algorithms when varying the data reli-ability. Specifically, we consider a simple constructive heuristic and two tabu search procedures.
The constructive heuristic groups retailers accord-ing to their geographical position and assigns to each group the minimum number of vehicles necessary to accommodate their total demand. Retailers belonging to the same group are ordered for increasingTr and then assigned in this order to vehicles. If the demand of retailerrdoes not fit in any of the available vehicles, a new vehicle is added andris assigned to it. Otherwise, ris assigned to the available vehicle with the minimum remaining capacity.
When all retailers have been assigned to a vehicle, an adaptation of the 3-OPT local search algorithm [31] to the case with time windows is used to sequence retailers served by the same vehicle. This constructive heuristic is similar to the first steps of the procedure currently adopted at the terminal to plan vehicle routes.
The first tabu search procedure (hereinafter called ST orstandard tabu search) implements the main fea-tures of the TABUROUTE algorithm introduced by Gendrau et al. [11]. A solution S in ST is given by the sequence of retailers served by each route. The neighborhood of a solution Sis the set of all the fea-sible solutions obtained by moving one of prandomly chosen retailers from its route in S to another route serving at least one of theqretailers closest to it, where p and q are two parameters of the tabu search. If a move leads to empty an existing route, the route is eliminated. An additional move consists in adding a new route to the set of routes and in assigning to it one of the p retailers. A move can lead to infeasible solutions that violate the capacity constraints of some vehicles. Infeasible solutions are penalized by a factor depending on the violation of the capacity constraints.
When the solution does not improve after a certain number of iterations, diversification strategies are used to restart the search from new solutions.
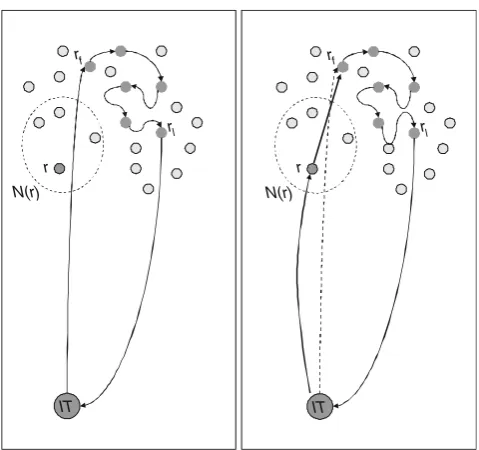
The second tabu search procedure (hereinafter called AD oradvanced tabu search) differs from ST for the definition of a larger neighborhood of a solution, that is generated by considering an additional move. The new move emulates the behavior of human dis-patchers and is based on the geographical properties of the real application considered in this paper and depicted in Fig.3.
As described in Section1, intermodal terminals are typically located in the peripheral area of the cities.
IT rf
rl
N(r) r
IT rf
rl
N(r) r
Fig. 3 The new move
On the other hand, the retailers can be located in the central area of the city, as in our case study. In such case, each route includes a long path fromITto the first served retailerrf and a long path from the last retailer rltoIT. The new move allows moving a retailerrfrom its current route to another, beforerf or afterrl, even ifrf orrlare not included in theqretailers closest tor. The solution S obtained after the move is included in the neighborhood ofSif the cost ofSminus the cost of Sis below a given tresholdσ.
6 Computational results
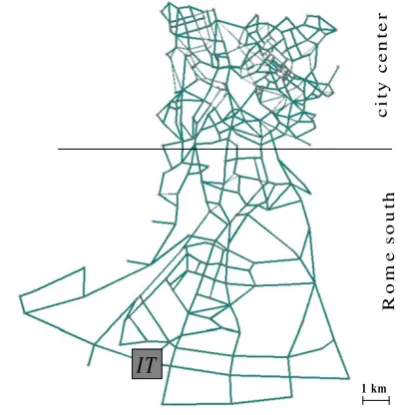
This section reports on the performance of the greedy, AD and ST algorithms on a real test case, located in a subarea of Rome (Italy). The code is implemented in C++ and runs on a PC equipped with a Intel 2 GHz processor and 2 GB of RAM.
6.1 Test case description
IT
ci
ty
cen
te
r
Ro
m
e
s
o
u
th
1 km
Fig. 4 Rome network
the dimension and the number of customers and low link capacity values. The distribution of merchandise takes place from 4:00 am to 11:00 am. In order to model the traffic conditions within this time window, about 280,000 vehicles are generated at the centroids of the network considering the variable demand profile shown in Fig.5.
For each hour, link travel times are obtained by sim-ulation using dynamic assignment model where trans-port demand can change during the simulation interval. For the dynamic simulation we use the DYNAMEQ model: this is a dynamic traffic assignment model which exploits variants of gradient like directions and the method of successive averages to determine pre-trip dy-namic equilibrium path choices [32]. As a consequence, the travel times between each pair of retailers, as well as between each retailer and the terminalIT, are time-dependent and can be represented by a vector where each component is associated to a certain time slice.
Table 1 Relative performance loss (percentage) between solu-tions andREF
ε GREEDY AD ST
0 271.3 2.9 33.5
10 449.5 47.2 73.8
20 456.0 53.0 88.4
30 481.1 59.1 90.3
40 512.6 59.1 90.4
50 559.2 60.0 111.0
60 618.5 70.9 111.5
70 647.5 63.4 110.7
80 675.1 64.7 116.7
90 697.5 72.0 118.7
100 722.0 71.9 139.4
In our study, we consider these travel times values as the actual traffic conditions in the network. To gener-ate errors on the input data, these travel times values have been randomly perturbed using the relationtestij = dij(1+100x ), where x is a random variable uniformly distributed in the interval[−P,+P]. With this position, for each link(i,j)we get a discrepancy|δij| = dij100|x|. We considered ten values forP= {10,20, . . . ,100}, besides the reference case P=0 in which input data is not affected by error. We consider ten scenarios for the customer orders, each scenario consisting of one day with 50 deliveries randomly located in the city center. For each value of P and for each scenario, ten random perturbations of the travel times have been generated, thus obtaining a total of 1,010 instances of the vehicle routing problem to be solved with the three algorithms. As an aggregate indicator of the unreliability we use the unreliability ε expressed in percentage, i.e., ε=
100|N1|(i,j)∈N|δij|.
6.2 Results analysis
For the reference caseε=0and for the ten scenarios, Algorithm AD finds a better solution with respect to Algorithm ST in eight out of ten cases. In the following,
Fig. 5 Demand profile
5
0 10 15 20 25 30
4.00-5.00 5.00-6.00 6.00-7.00 7.00-8.00 8.00-9.00 9.00-10.00 10.00-11.00
time
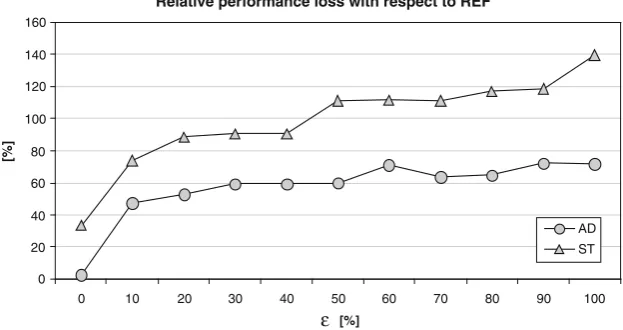
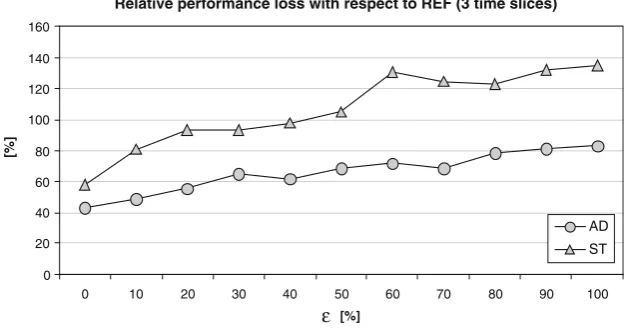
Fig. 6 Relative performance loss (percentage) of solutions costs computed by AD and ST with respect toREF (seven time slices data input)
Relative performance loss with respect to REF
0 20 40 60 80 100 120 140 160
0 10 20 30 40 50 60 70 80 90 100
ε [%]
AD ST
[%]
the best solution obtained either by AD or ST forε=0 is referred to as theREFsolution.
Table1reports the average (in percentage) over all instances of the difference between the performance of each of the three algorithms and the performance of theREF solution. In what follows, we refer to this in-dicator as therelative performance loss100π(ε)REF−REF. Forε=0we report the relative performance loss over the ten scenarios. For eachε=0we report the average over 100 instances (ten scenarios and ten perturba-tions). Clearly, the larger is the relative performance loss, the worse is the performance of the algorithm in combination with a certain data unreliability. The greedy algorithm performs very poorly with respect to the two tabu search algorithms, the relative perfor-mance loss from REF ranging from 271.3 to 722.0%. With the AD and ST algorithms, the relative perfor-mance loss fromREFis significantly smaller. It reaches a maximum of 139.4% with a perturbationε=100in the ST case.
A pictorial comparison between AD and ST is shown in Fig.6. On average, AD outperforms ST for all values of ε, which demonstrates the effectiveness of the new neighborhood concept adopted by AD.
As for the sensitivity of the algorithms to the unreli-abilityε, Fig.6shows that there is a significant increase of the distance with respect to theREF solution when passing from ε=0 to ε=10. For higher values of ε the distances remain quite stable for AD and slightly increase with ε for ST. For example, from Table 1, passing fromε2=50toε1=40with ST would generate a value of information equal to0.2REF. If in addition ST is replaced with AD, the total gain increases up to more than0.5REF.
This behavior highlights the lower robustness of ST with respect to AD.
The robustness of AD and ST can be explained by Fig.7. For each value ofε and for each instance, the objective function of the solutions obtained by AD and ST with perturbed input data have been compared
Fig. 7 Average perturbation
error (percentage) Average perturbation error
0 2 4 6 8 10 12 14 16 18 20
10 20 30 40 50 60 70 80 90 100
ε [%]
AD ST
Fig. 8 Relative performance loss (percentage) of solutions costs computed by AD and ST with respect toREF (three time slices data input)
Relative performance loss with respect to REF (3 time slices)
0 20 40 60 80 100 120 140 160
0 10 20 30 40 50 60 70 80 90 100
ε [%]
AD ST
[%]
with the objective function values obtained by the same solutions with no perturbation on link travel times (i.e.,
with ε=0). The lowest is the difference, the highest
is the robustness. We call this difference the average perturbation error (in percentage).
It can be observed that the estimation error increases almost linearly withεfor both AD and ST and does not vary significantly with the algorithm but it depends only onε.
In the remaining part of this section, we study the benefit of using aggregated versus more detailed input data when modeling the traffic conditions in different time slices. The previous results are obtained using link travel times available for each hour of the planning horizon 4:00–11:00 am (i.e., the planning horizon is divided into seven time slices). In order to consider more aggregated input data, the same planning horizon is divided into three time slices (from 4:00 to 7:00, from 7:00 to 10:00 and from 10:00 to 11:00); the link travel times from 4:00 to 7:00 am (and from 7:00 to 10:00 am)
are considered constant and equal to the average values during the three hours.
Figure8shows the relative performance loss of the objective function values from the REF value when using three and seven time slices, for varying ε. The REF value is computed by using seven time slices and
ε=0. The distance from REFfor the case with three
time slices ranges between 40 and 80% for AD and between 60 and 140% for ST. Such behavior confirms that AD is more resilient to perturbation with respect to ST also when the input data are more aggregated.
It is interesting to compare the performance of each algorithm considering three and seven time slices. This is shown in Fig.9for the AD algorithm and in Fig.10
for the ST algorithm.
As for the AD algorithm, when the input data are very reliable (i.e., when ε=0) there is a clear conve-nience in using seven time slices rather than three. On the other hand, for10≤ε≤40the difference between the two cases reduces almost to zero, and it is always
Fig. 9 Relative performance loss computed by AD with respect toREF(three vs seven time slices data input)
Relative performance loss with respect to REF (3 vs 7 time slices)
0 10 20 30 40 50 60 70 80 90
0 10 20 30 40 50 60 70 80 90 100
ε [%]
AD 7 SLICES
AD 3 SLICES
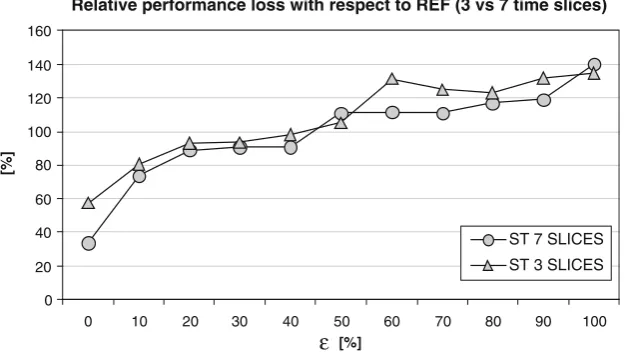
Fig. 10 Relative performance loss computed by ST with respect toREF(three vs seven time slices data input)
Relative performance loss with respect to REF (3 vs 7 time slices)
0 20 40 60 80 100 120 140 160
0 10 20 30 40 50 60 70 80 90 100
ε [%]
ST 7 SLICES
ST 3 SLICES
[%]
less than 20% for higher values ofε, so that there is no big convenience in collecting and using more detailed input data forε≥10. When the ST algorithm is con-cerned, Fig. 10 shows that detailed input data (seven time slices) are still preferable when the perturbation
ε is zero and that aggregated input data (three time slices) are slightly preferable forε≥10.
7 Conclusions
This paper addresses quantitative methods for estimat-ing the value of information from ITS in urban freight distribution. The information adopted are link travel times, that can be deeply influenced by systematic and stochastic variability. Specifically, we developed a quantitative method to estimate the value of such information in the optimization process of the retail dis-tribution of perishable goods. The method consists of solving the distribution problem by using data affected by different degrees of reliability and accuracy. As a stage of the analysis, different algorithms are evaluated in terms of performance and robustness, to assess the best results achievable with a given data set. In par-ticular, we define the monetary cost of unreliability as the additional cost that has to be paid with respect to the best solution achievable with perfect information. We tested several solution procedures, ranging from simple greedy algorithms to specialized tabu search al-gorithms. As for the latter case, a standard tabu search is derived from the literature on the vehicle routing problem. A new advanced tabu search has been devel-oped by taking into account the geographical position of customers and routes to construct a new effective neighborhood.
Experimental analysis has been carried out on a real network (a subarea of the city of Rome). Our results show that there is a clear benefit in using detailed and highly reliable data. When reducing the travel time estimation error nearly to zero is not possible (e.g., when travel time values are inherently stochastic in nature) it is important to use an advanced algorithm, able to achieve good performance for a large range of perturbation. Our computational results also show that when the input data perturbation is large, there is no big convenience in using detailed information for the solution of the vehicle routing problem. An accessory result to the main objective of the paper is to show that the advanced tabu search clearly outperforms the standard one from both the points of view of the objective function and the robustness.
The methodology described in this paper can be used to evaluate the marginal value of different types of information and therefore the potential return on investment on the acquisition of reliable data. At the same time, the results of this paper can be of interest also for information providers, to evaluate the willing-ness to pay of potential customers and/or to estimate the associated market share.
in the travel times increases, dynamic vehicle routing strategies becomes more and more convenient with respect to the static strategies.
Acknowledgement This work is partially supported by the Italian Ministry of Research, Grant number RBIP06BZW8, project FIRB “Advanced tracking system in intermodal freight transportation”.
Open Access This article is distributed under the terms of the Creative Commons Attribution License which permits any use, distribution, and reproduction in any medium, provided the original author(s) and source are credited.
References
1. Commission of the European Communities (2008) Proposal for a directive of the European Parliament and of the Council, laying down the framework for the deployment of Intelligent Transport Systems in the field of road transport and for in-terfaces with other transport modes (online). Available from:
http://eur-lex.europa.eu/LexUriServ/LexUriServ.do?uri=COM: 2008:0887:FIN:EN:PDF. Accessed 3 September 2009
2. Taniguchi E, Hejden RVD (2000) An evaluation methodology for city logistics. Transp Rev 20(1):6590
3. Taniguchi E, Thompson R, Yamada T, Duin JV (2001) City logistics: network modelling and intelligent transport systems. Pergamon, Amsterdam
4. Nemoto T, Browne M, Visser J, Castro J (2006) Intermodal transport and city logistics policies. In: Recent advances in city logistics. Taniguchi & Thompson, pp 15–30
5. Commission of the European Communities (2008) Action plan for the deployment of intelligent transport systems in Europe (online). Available from:http://eur-lex.europa.eu/LexUriServ/ LexUriServ.do?uri=COM:2008:0886:FIN:EN:PDF. Accessed 3 September 2009
6. Langer N, Forman C, Kekre S, Scheller-Wolf A (2007) Assess-ing the impact of RFID on return center logistics. Interfaces 37(6):501–514
7. Figliozzi MA (2007) Analysis of the efficiency of urban com-mercial vehicle tours: data collection, methodology and policy implications. Transp Res, Part B Methodol 41(9):1014–1032 8. Jarugumilli S, Grasman SE (2007) RFID-enabled inventory
routing problems. Int J Manuf Technol Manag 10(1):92–104 9. Wang Y, Ho OKW, Huang GQ, Li D (2008) Study on vehicle
management in logistics based on RFID, GPS and GIS. Int J Internet Manuf Serv 1(3):294–304
10. Kim DS, Porter JD, Buddhakulsomsiri J (2008) Task time estimation in a multi-product manually operated workstation. Int J Prod Econ 114(1):239–251
11. Gendreau M, Hertz A, Laporte G (1994) A tabu search heuristic for the vehicle routing problem. Manage Sci 40(10): 1276–1290
12. Solomon MM (1987) Algorithms for the vehicle routing and scheduling problems with time window constraints. Oper Res 35(2):254–265
13. Russell RA (1995) Hybrid heuristics for the vehicle routing problem with time windows. Transp Sci 29(2):156–166 14. Bramel J, Simchi-Levi D (1996) Probabilistic analysis and
practical algorithms for the vehicle routing problem with time windows. Oper Res 44:501–509
15. Potvin JY, Kervahut T, Garcia BL, Rousseau JM (1996) The vehicle routing problem with time windows. Part I. Tabu search. Informs J Comput 8(2):158–164
16. Taniguchi E, Yamada T, Tamaishi M, Noritake M (1998) Effects of designated time on pickup/delivery truck routing and scheduling. In: Borrego CA, Sucharov LJ (eds) Urban transport and the environment for the 21st century IV. WIT, Southampton, pp 127–136
17. Cordeau JF, Desaulniers G, Desrosiers J, Solomon MM, Soumis F (2002) VRP with time windows. In: Toth P, Vigo D (eds) The vehicle routing problem. SIAM Monographs on Discrete Mathematics and Applications, Philadelphia, pp 157– 193
18. Laporte G, Louveaux FV, Mercure H (1992) The vehi-cle routing problem with stochastic travel times. Transp Sci 26(3):161–170
19. Malandraki C, Daskin MS (1992) Time dependent vehicle routing problems: formulation, properties and heuristic algo-rithms. Transp Sci 26(3):185–200
20. Ichoua S, Gendreau M, Potvin JY (2003) Vehicle dispatching with time-dependent travel times. Eur J Oper Res 144(2):379– 396
21. Taniguchi E, Yamada T, Tamagawa D (1999) Probabilistic vehicle routing and scheduling on variable travel times with dynamic traffic simulation. In: Taniguchi E, Thompson RG (eds) City logistics I. Institute of Systems Science Research, Kyoto, pp 85–99
22. Taniguchi E, Yamada T, Tamagawa D (2000) Probabilistic routing and scheduling of urban pickup/ delivery trucks with variable travel times. In: Bell MGH, Cassir C (eds) Reliability of transport networks. Research Study, pp 73–89
23. Kenyon AS, Morton DP (2003) Stochastic vehicle routing with random travel times. Transp Sci 37(1):69–82
24. Taniguchi E, Thompson RG (2004) Logistics systems for sus-tainable cities. Elsevier, Oxford
25. Ahn BS, Shin JY (1991) Vehicle routing with time win-dows and time-varying congestion. J Oper Res Soc 42(5):393– 400
26. Taillard E, Badeau P, Gendreau M, Guertin F, Potvin JY (1997) A tabu search heuristic for the vehicle routing problem with soft time windows. Transp Sci 31:170–186
27. Fleischmann B, Gietz M, Gnutzmann S (2004) Time-varying travel times in vehicle routing. Transp Sci 38(2):160– 173
28. Ando N, Taniguchi E (2004) Travel time reliability in vehi-cle routing and scheduling with time windows. Networks and spatial economics 6(3–4):293–311
29. RFID Journal (2002) Part 5: Warehousing efficiencies (online). Available from: http://www.rfidjournal.com/article/ articleprint/200/-1/5. Accessed 10 September 2009
30. RFID Journal (2008) White paper: lessons learned from the early adopters (online). Available from: http://www. rfidjournal.com/whitepapers/download/116. Accessed 10 Sep-tember 2009
31. Lin S (1965) Computer solutions of the traveling salesman problem. Bell Syst Tech J 44:2245–2269
32. Florian M, Mahut M, Tremblay N (2008) Application of a simulation-based dynamic traffic assignment model. Eur J Oper Res 189(3):1381–1392
33. Taniguchi E, Shimamoto H (2004) Intelligent transportation system based dynamic vehicle routing and scheduling with variable travel times. Transp Res, Part C Emerg Technol 12C(3–4):235–250