ORIGINAL PAPER
Port activity evolution: the initial impact of economic crisis
on major Greek ports
Manolis Christofakis&Anastasios Tassopoulos&Basilis Moukas
Received: 13 June 2012 / Accepted: 9 May 2013 / Published online: 25 May 2013 #The Author(s) 2013. This article is published with open access at SpringerLink.com
Abstract
Purpose The objective of this study is the quantitative anal-ysis of recent developments in transport activity of the main Greek ports (Piraeus, Thessaloniki, Patra), in order to estab-lish clusters of various transport load and time groups of growth and decline of the transport activity, regarding the period 2002–2010. From this latter approach, the investiga-tion of any impact of the economic crisis in the evoluinvestiga-tion of transport activity can be explored.
Methods The methodology used is based on forming clus-ters, to identify growth-recession periods, and groups of determining transport categories. Methods used are: Princi-pal Component Analysis, Factor Analysis and Cluster Analysis.
Results and conclusions The results show that the major port of Piraeus activity’s evolution can be represented by two distinct periods. A growth period (2002–2004) which is related to the Olympic Games of 2004 and an instability period of the transport activity’s evolution, which follows. The last 3 years a decrease for most of the transport activ-ities has been encountered, due to the economic crisis. Considering the three main ports of the country, as a unit we realize a slightly differentiated picture, since, despite a distinct last period of decline, we cannot certainly shape the claim that during the previous years there is a strong positive influence in the other two ports by a developmental event like the Olympic Games. These findings could mean that the spatial developmental impact of the Olympic Games limited
at the regional level. However the main findings for the Piraeus’port, mentioned beforehand, are still valid. A gen-eral conclusion, regarding the prerequisites of the increased competitiveness and efficiency of ports, refers to the invest-ments in modern infrastructure, services and systems ad-ministration, the transport management in Greek ports and the development of a combined transport system.
Keywords Cluster analysis . Port activity . Greek ports . Economic crisis . Athens Olympic Games
1 Introduction
The overall waterway transport (sea, river, lake) and its organization, combined particularly with the location of the relating activities, have a strong impact, perhaps more than other modes of transport, in the location patterns of the productive activities and the evolution of spatial organiza-tion. Before the great advances in the field of transport, production activities were characterized by dispersion in space, which dominated until about the mid-19th century [1]. During this period, key location factor was the existence of raw materials such as minerals, wool, etc., energy re-sources such as wood, wind, water, etc. and natural ways of communication, such as natural ports, waterways etc. [2]. Although transport has not yet developed largely in con-junction with the physical characteristics of regions, it play an important role in the location of activities and the distri-bution of settlements, particularly through the opportunities provided by the waterways and the relevant means [3]. The production units which rely upon specialized local manpow-er and the needs for the organization of the relevant activi-ties combined with the morphological characteristics of the regions, determined the socioeconomic organization, the every day life, the form of residence, models of exchange and communication [4].
M. Christofakis
:
A. Tassopoulos:
B. Moukas Department of Economic and Regional Development, Panteion University of Athens, Athens, GreeceM. Christofakis (*)
Regional Development Institute of Panteion University, 130 Sygrou Avenue (1st floor),
Therefore, waterway networks and especially these of the sea provided at the time the comparative growth advantage. Especially for the case of Greece, it is pointed out that in 1832 the wheat of Tripoli (in Peloponnisos) was more expensive at the neighbouring port of Nafplio, than the Odessa wheat, due to the differentiation in transportation costs and more specifically, because of the relative lack of terrestrial transport networks and furthermore the difficult and costly freight transport through the mainland [5]. There-fore we can realize of the development bloom of the Greek islands’area of the time, compared with the mainland. The Merchant Marine and all the related and complementary activities, was the basis of the economic growth of the free Aegean area, which was integrated and operating in a glob-alized economy. After the 1830 liberalization and until the end of this decade, the commercial traffic increased by 194 % [5].
Even after the great breakthrough in the field of trans-port (rail, car, etc.) which began gradually after 1850, the mobility and polarization in space were initially based on traditional residential units with favourable natural charac-teristics. In particular, the communication and energy net-works, as well as the augmented capacity of transport, attracted businesses to the large product and labour mar-kets. However, because of relatively higher road and rail transport cost compared to the waterways for many de-cades, the build up made, relied primarily on traditional residential units with favourable physical characteristics, which evolved much later to important attraction points through the new conditions shaped by the transport de-velopments. As reported by Glaeser and Kohlhase [2], out of the twenty largest U.S. cities of the 1900, which later became major transportation hubs, many of them having an international reputation, seven were sea ports in estuaries (Boston, Providence, New York, Jersey City, Newark, Baltimore, San Francisco), with the largest city of them, New York, being the largest port in the country. Five cities were also ports on estuaries in Great Lakes (Milwau-kee, Chicago, Detroit, Cleveland, Buffalo). Chicago devel-oped into a transportation hub in the U.S., making use of its geographical location and serving the shipments of goods from the rich American mainland, mostly to the east coast and Europe. Three more cities were sited on the river Mississippi (Minneapolis, St. Louis, New Orleans) and three on the River Ohio (Louisville, Cincinnati, Pittsburgh), while the other two cities were on the rivers of the eastern coast, near the Atlantic ( Philadelphia, Washington). One might find something like the American case, by looking at the evolution of the majority of the European cities. As Hall [6] points out, the European cities-hubs of the 19th century were those who first attracted airports in the early 20th century and the new high speed rail system in the late 20th century.
Especially seaports are considered as critical nodes of international trade networks and economic co-operation, bearing the largest share of the total imported and exported cargo volumes [7].
In this context, it is of a great importance the develop-ment of organization and locational nodal infrastructure of maritime transport, especially in countries like Greece, which have acknowledged to a large extent their develop-ment evolution, in shipping and maritime transport, and also rely for their present and future activity on the exploitation of this sector’s opportunities.
The objective of this research is the quantitative analysis of recent developments in transport activity of the main passenger and freight ports of Greece, such as Piraeus, Thessaloniki and Patra, with the use of cluster configura-tion (cluster analysis) and taxonomic analysis of both the freight and time groups. This analysis will look into the likelihood and degree of impact of the positive and nega-tive developmental shocks, like the Olympic Games of 2004 and recent economic crisis respectively, into the ac-tivity of these ports.
This last issue is of main importance in the research if we take into account that the 2008 credit crunch and the subse-quent economic crisis, ended a period that lasted over two decades, wherein international seaports around the globe experienced an unprecedented volume increases [8].
The economic crisis had an immediate effect on sea transport, which accounts for more than 40 % of world exports of transportation services. As the global demand for goods declined, the demand for sea transportation ser-vices, mainly freight transport, fell significantly. The Baltic Dry Index (which is a daily average of prices for shipping of raw commodities in dry bulk cargoes on different interna-tional shipping routes, measuring the changes in the cost of transporting raw commodities by sea. The index fluctuates according to the shift in world demand for raw materials. Declining demand resulting in lower transportation prices will push the index downwards while increased demand will lift the index), reached a record level in Spring 2008, reflecting a high demand for raw materials. However, by December it had dropped by 94 % [9].
by 18 %). No quarterly Balance of Payments statistics are available for China, but US and EU imports from China show a downward trend.
At EU level, the port activity started to decline from the second half of 2008. More specifically, EU-27 ports faced in 2008 a 0.5 % decrease in the handling of goods, compared to 2007. The most substantial decreases at individual member-state level being recorded in Estonia (−19.5 %), Greece (−7.2 %) and Poland (−6.9 %) [10]. Especially in Greece the raw data that we used in this research show a negative trend in the transport activity of the main port of the country, Piraeus [11]. More specifically, between the years 2002–2010, the containers transport activity has dropped by 63.5 % and bulk transport activity by 50.8 %, while more stable seems to be the trend regarding the passengers and autos. Only the conventional cargo transport activity has increased by almost 60 % during the same period.
The general structure of the paper is as follows: In Section2, the methodology of the analysis is presented. Then, Section3 includes the applications of the methods and the emerged results. Finally, Section4concludes the paper.
2 Methodology
The adopted methodology of this work has been used in several cases to investigate issues of transport, with differ-ent variations, both in time and at a spatial level of analy-sis. Ferrari et al. [12], proposed a new method of measuring the quality of traffic on highways, based on analysis of main components. In particular, by studying a large number (155 thousands) vehicles passing at bidirec-tional highway of similar geometrical characteristics and taking into account the composition of the flow in each case (based on the percentage of heavy vehicles), along with features such as speed, transit time and external con-ditions (day and night, summer-winter), they produced a vector of 15 variables, representing the traffic conditions. Using the Principal Component Analysis, they grouped these variables into three main components, explaining 75 % of the total variance of the 15 variables. Analyzing how the three main components change together, four areas of traffic flow were recognized, free flow, steady flow, unstable flow and difficult to flow, which determine the traffic conditions. Other researchers [13–15], analyze data traffic on a daily basis (hours and days of week), trying to develop traffic flow models using cluster analysis. In a recent work of this group, Weijermars and van Berkum [15] attempted to analyze traffic flow models on freeways in order get a better traffic management. To be more specific, analyzing data based on vehicles flow and veloc-ity for all days time periods of the week and special
conditions (working days, weekends, holidays, vacation) on the highway A50 in Denmark, they ended up with five clusters, which exhibit distinct daily flow profiles and can form the basis for a model formulation of the daily traffic management. Chen et al. [16] use cluster analysis to inves-tigate the traffic impacts of the housing projects function-ing, with the intention of classifying and assessing the construction projects, in urban and suburban areas. Tongzon [17] suggested the method of principal compo-nent analysis for the classification of ports. This method used a number of common variables for container ports worldwide and concluded in a classification with emphasis on similarity, preparing the ground for benchmarking anal-ysis. Papadaskalopoulos et al. [18], trying to give a further spatial dimension to the impact of transport networks (in terms of development of the areas and the creation of spatial—development modules due to the structure and operation of networks) took into account, along with the number of networks, accessibility and network nodes the spatial structure of residences. The identification of new spatial entities as urban groups, based initially in the con-struction of Accessibility Matrix and spatial weighting re-fers to the connections of the first order (direct-line) centers in relation to transport routes. The results of Accessibility Matrix, i.e. nodal settlements, in combination with other variables (population size of cities, scale and significance of axes that cross these cities, existence of other nodes, infrastructure etc.), used furthermore for determining spa-tial units, consisting of groups of residenspa-tial centers (clusters). The formation of these groups is to use methods of taxonomic analysis and imprinting them using the cor-responding tree.
In this framework, as it is mentioned above, the main purpose of this study is the quantitative analysis of recent developments in freight and passenger transport activities (by major category) in the country’s main port, Piraeus, and in conjunction with this, the ports of Thessaloniki, Patra, which also show significant freight and passenger activity and relevant data are available. The separate analysis of the first port of Piraeus is mainly due to its size and dominance of the freight and passenger transport task in the country and secondly because of the better and more complete statistical data.
The methodology used for quantitative analysis is based on forming clusters, to identify growth-recession periods, and groups of determining transport categories. Furthermore, three related methods are used: multivariate analysis (using the statistical package SPSS), the principal components analysis1,
factor and cluster analysis, in order to investigate the possible groups resulting, regarding the types of transport and also time groups. The latter approach will give us the opportunity to explore any impact of the recent crisis in the evolution of transport activity of the main Greek ports.
More specifically, in principal components analysis we attempt to explain the total variability of the correlated vari-ables (different types of transport) through the use of five orthogonal principal components. The components them-selves are merely weighted linear combinations of the original variables. One continues to extract components until some stopping criteria are encountered or until five components are formed. It is possible to compute principal components from either the covariance matrix or correlation matrix of the five variables. If the variables are scaled in a similar manner than many researchers prefer to use the covariance matrix. When the variables are scaled very different from one another than using the correlation matrix is preferred. A common stopping criteria when using the correlation matrix is to stop when the variance of a component is less than one.
We are using the Factor Analysis method, trying to find out the underlying causes of the data. Sometimes, it is more appropriate to think in terms of continuous factors which control the data we observe. Geometrically, this is equiva-lent to thinking of a data manifold or subspace.
Cluster analysis is most often used in cases in which it is unknown, prior to the analysis, the number of groups in the data or which observations belong to which groups. Objects associated with a specific cluster should be quite similar and generally clusters should be distinct, i.e. not overlapping. Hierarchical methods, in which clusters are defined according to similarity or dissimilarity measures, remain the most pop-ular method of analysis, and user friendly software makes the analysis easily accessible to a wide variety of researchers in a variety of fields. However, such software packages rarely provide a clear set of guidelines to indicate how such an analysis should be performed.
In our research comparable time series data are used, regarding the supplied transportation work of the three ports per main category (containers, conventional cargo, bulk cargo, passenger traffic, cars), based on the official statistics provided by the respective Ports Organizations [11,19,20]. Because of the limited data and the ambiguous quality of them as well as the relative lack of complete homogeneity of the transport task categories, an attempt was made to group the ports under these common transport categories, permit-ting combined port’s analysis, in the second part of the following section. The time investigation considered covers the years 2002–2010. In particular, consider the following types of transport by main port: 1. Containers (Piraeus, Thessaloniki), 2. Cars (Piraeus, Patra), 3. Conventional load (Piraeus, Thessaloniki), 4. Bulk (Piraeus, Thessaloniki), 5. Passengers (Piraeus, Thessaloniki, Patra).
3 Applications and results
3.1 Analysis of the port of Piraeus’traffic flow
3.1.1 Principal components analysis (PCA), of the transport types
The goal of the PCA is to reduce a number of variables to a smaller number of new uncorrelated variables (principal components). The technique of the original variables group-ing uses as decisive factor the correlation observed between them. More specifically, the emerging new variables are linear combinations of the original variables, so as to be uncorrelated to each other and to contain the largest possible part of the variance of original variables.
The effective implementation of the principal compo-nents analysis on the selected categories of transport (con-tainers, autos, conventional, bulk, passengers) of the port of Piraeus, presupposes the existence of statistically significant correlation between them. If this does not exist, it is almost impossible these variables (transport categories) share com-mon factors [21]. According to Table 1, all variables are adequately correlated by some component, since the extrac-tion rate is above 0.3 for all variables. Two variables, name-ly conventional (0.9) and passengers (0.6), are the most correlated, which means that they show common trends in a greater extent than the others. The Common Factors (Communalities), measure the percentage of each variable’s variance explained by the rest of the components (i.e. listed in the Common Factor Variation).
The principal components are emerged by calculating the eigenvectors and eigenvalues of the data covariance matrix. This process is equivalent to finding the axis system in which the covariance matrix is diagonal. The eigenvector with the largest eigenvalue is the direction of greatest vari-ation, the one with the second largest eigenvalue is the (orthogonal) direction with the next highest variation and so on. According to this, Table2 presents the eigenvalues. The largest eigenvalue is the greater in the percentage of
Table 1 Principal components analysis, based on the common factor variance
Communalities
Raw Rescaled
Initial Extraction Initial Extraction
variance explained by one component. The results show that the first component corresponds to the highest eigenvalue (greater than 1), interpreting the 74.2 % of the total variance, a reasonable amount.
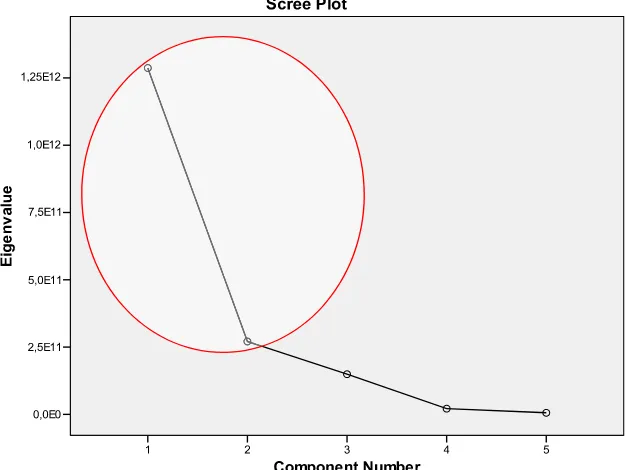
The choice of the number of principal components can be drawn graphically by the so-called Scree Plot (see Fig.1). The horizontal axis shows the components and the vertical corresponding eigenvalues.
As shown in the diagram, after the second price, the point that significantly changes the slope of the curve shows the number of components to be included in the analysis. That is, show the first component, which reflects the overall variation of 74.2 %. Moreover, considering the second com-ponent we can increase the overall variation to almost 90 % (89.8 %), as we can see from Table2.
Finally, Table3shows the extent to which each variable is involved in the formation of each component.
From the above analysis, we conclude that produced only a main component of which largely represent three variables respectively, this is the conventional load, the passengers and the bulk load. This situation means that the transport activity evolution of Piraeus port, for the investigated period (2002–2010), is mainly defined by these three categories.
3.1.2 Cluster analysis for the time—periods
As noted in the preceding analysis, the method of cluster analysis has been used in many transport applications for the aggregation of periods with similar characteristics. The cluster analysis in this paper classifies the observations (in our case the period 2002–2010) in two or more groups, having common features. Our interest focuses not in the annual values of variables, but in their differences. To
Table 2 Analysis of variance components based on eigenvalues
Component Initial Eigenvalues Extraction sums of squared loadings
Total % of Variance Cumulative % Total % of Variance Cumulative %
Raw 1 1.287E12 74.222 74.222 1.287E12 74.222 74.222
2 2.707E11 15.614 89.836
3 1.492E11 8.607 98.443
4 2.119E10 1.222 99.665
5 5.804E9 0.335 100.000
Rescaled 1 1.287E12 74.222 74.222 2.777 55.542 55.542
2 2.707E11 15.614 89.836
3 1.492E11 8.607 98.443
4 2.119E10 1.222 99.665
5 5.804E9 0.335 100.000
calculate the“distance”of years we will use the measure of the Squared Euclidean Method.
In the analysis that follows we apply the hierarchical cluster analysis (Hierarchical Clustering) in two different ways. The first is based on the component that comes up from the application of principal components analysis on transport categories; four specific methods are applied: a) the method of the (average, complete and simple if any) link between the groups (between groups linkage), b) the method of the link within groups (within groups linkage), c) the method of the nearest neighbour (nearest neighbour) and d) the method of the longest neighbour (furthest neighbour). The second technique, we apply three specific methods using the five input variables: a) the method of the link between the groups (between groups linkage), b) the method of the nearest neighbour (nearest neighbour) and c) the method of the more distant neighbour ( furthest neighbour).
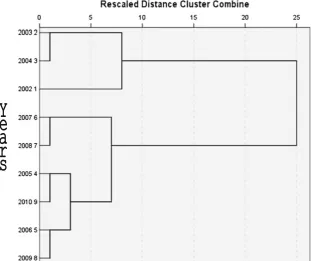
Specifically, using the initials of these four methods of hierarchical analysis (between groups linkage, within groups linkage, nearest neighbour, furthest neighbour), the new component based on the principal components analysis (first method), shows an adequate grouping of the years considered in two periods on 3 of the 4 methods (between groups linkage, within groups linkage and furthest neigh-bour), where the results are almost identical. Particularly, the first period consists of 3 years (2002, 2003, 2004,) and the second one from the remaining 6 years (2005, 2006, 2007, 2008, 2009, and 2010) as we can see indicatively in Fig.2. Then, using the five original variables (second mode), two years groups occur with identical results (8 to 8) in two of the three methods (average linkage between groups and complete linkage). The first group consists of 5 years (2005,
Table 3 Analysis of the degree of participation of each variable in the configuration of main components—component matrix
Raw Rescaled
Component Component
1 1
Conventional 929,320.061 0.968 Passengers 539,797.789 0.781 Bulk −227,714.184 −0.713
Autos 70,315.653 0.616
Containers −273,723.105 −0.585
Fig. 2 Time—clusters for the port of Piraeus
Table 4 Analysis of the variables participation in the main compo-nents for the period 2002–2004- component matrix
Raw Rescaled
Component Component
1 2 1 2
2006, 2008, 2009, and 2010) and the second of the remaining 4 years (2002, 2003, 2004 and 2007).
Finally, it appears that both analysis techniques (a component—five variables) converge into grouping the two main groups of years with homogenous characteristics (first group of 3–4 years, the second group 4–5 years). In particular, both analysis techniques indicate a common tem-poral group, includes the years 2002–2004, while the sec-ond group consists of the years 2005–2010. There is little difference observed during the year 2007. The first period is characterized by positive trends in the volume of shipments, which can be interpreted in relation to impact the Olympic Games 2004 in Athens, as identified with the pre-Olympic and Olympic period. The second period is characterized in its early years by some instability in the evolution of the transportation workload to reach a relative decline in the last 2 years, for most categories of transport, which can be accounted for the impacts of the financial crisis, affecting the transport activity as well.
To investigate the behavior and the involvement of the various types of transport in the reference period, the principal components analysis is once more used separately for each one of the two cluster—years (2002–2004 and 2005–2010), where the most important variables are identified (categories of transport), which were subsequently compared with the major variables of the total time period. In particular, for the period 2002–2004, Table4 shows the extent to which each variable is involved in the formation of each component.
The table shows that two main components largely reflect three variables namely, the conventional load (0.9), con-tainers (0.8) and bulk cargo (0.8), which means that the
transport activity evolution, for the period 2002–2004, is mainly defined by these three categories.
Similarly, for the next period, 2005–2010, the results are displayed in Table5.
According to Table5for the years 2005–2010 there is only a main component produced, representing largely two variables, respectively, the passenger traffic (0.9) and containers (0.8).
Finally, in the following Table6 we can see a presenta-tion of the most important variables for each period com-pared with the major variables of the overall research period. The above analysis shows that the period of transport development, 2002–2004, has more in common with the whole period 2002–2010, while common significant vari-ables appear to be the conventional and bulk load.
3.2 Combined analysis of traffic flows of the ports of Piraeus, Thessaloniki and Patra
3.2.1 Factor analysis
A combined analysis follows concerning the transport work-load of the ports of Piraeus, Thessaloniki and Patra. The factor analysis method is used to look at the common vari-ables being in the same category of transportation (e.g., conventional cargo and conventional cargo Piraeus, Thessaloniki) trying to investigate the importance of each variable in the evolution of the overall transport workload
Table 5 Analysis of the variables’participation in the main compo-nents for the period 2005–2010- component matrix
Raw Rescaled
Component Component
1 2 1 2
Passengers 699,669.603 54,535.068 0.991 0.077 Bulk 37,119.717 −16,850.448 0.309 −0.140 Containers −219,182.386 410,984.127 −0.463 0.868 Conventional 214,032.587 225,195.732 0.620 0.652 Autos 52,315.390 83,153.567 0.409 0.651
Table 6 Comparative presenta-tion of the main variables of temporal clusters and the overall reporting period
Years 2002–2010 Cluster 1: 2002–2004 Cluster 2: 2005–2010
Transport categories—variables Conventional Conventional Passengers Passengers Containers Containers
Bulk Bulk
Table 7 Factor analysis—component matrix
Component
1 2 3
and classify them accordingly. Table7illustrates the ranking of variables in relation to the respective main components, according to results of the factor analysis.
More specifically, as we can see from the above table, three components are produced which are heavily involved in nine variables respectively: conventional cargo in the ports of Piraeus and Thessaloniki, passenger traffic in the ports of Thessaloniki and Patra, containers in the ports of Piraeus and Thessaloniki, cars in the ports of Patra and Piraeus and bulk cargo in Thessaloniki.
As in the preceding analysis, the choice of the number of components may also be reflected in the corresponding diagram Scree Plot (see Fig.3), below the horizontal axis which shows the components and the vertical corresponding eigenvalues.
As we see from the chart, after the third price point that significantly changes the slope of the curve reflected the number of components to be included in the analysis.
Particularly, in conjunction with the Table 8 below, that preceded the first component explains the variation in over-all rate of 46.9 %, the second at a rate of 27.8 % and the third at a rate of 10.5 %.
As we can see from the table, the three mentioned compo-nents explain the overall variation in a percentage of 85.2 %, which is very satisfactory. These components largely repre-sent nine variables respectively, as we have already shown in Table7. This situation means that the transport activity evo-lution of the three major Greek ports, for the investigated period, is mainly defined by these variables. (Table8)
3.2.2 Cluster analysis for the periods’selection
In order to formulate time—clusters for the three ports considered as one, four methods for hierarchical analysis (between groups linkage, within groups linkage, nearest neighbour, furthest neighbour) were used, with three new
Fig. 3 Selection of principal components
Table 8 Total variance explained according to principal component analysis
Component Initial Eigenvalues Extraction sums of squared loadings
Total % of Variance Cumulative % Total
1 5.160 46.907 46.907 5.160
2 3.056 27.783 74.690 3.056
3 1.151 10.463 85.153 1.151
4 0.680 6.179 91.332
5 0.442 4.014 95.346
6 0.273 2.485 97.831
7 0.232 2.113 99.944
8 0.006 0.056 100.000
components that have emerged. There is a satisfactory grouping of years in 3 of the 4 methods (between groups linkage, within groups linkage and single linkage), where the results are almost identical. Two groups of years were revealed as we can see indicatively in Fig.4.
The first group includes the years 2008, 2009, 2010 and the second all the others (2002, 2003, 2004, 2005, 2006, and 2007). In this case it could be argued, that the relatively large decline in transport activity of ports that differentiates the years 2008, 2009, 2010 from the rest period is justified by the financial crisis that hit Greece as well. Finally, to provide a more complete picture of time—clusters, the four hierarchical methods of analysis (between groups linkage, within groups linkage, nearest neighbour, furthest neighbour) were applied on all the transport variables of the three ports. The relevant results are satisfactory and all the above mentioned methods, gave almost identical results. The above 2 year groups are also emerged here.
If we compare these results with those of the port of Piraeus individually, we can conclude that in the case of the three major ports as a whole the influence of crisis is more clear as the large decline in transport activity of ports differentiates the three last years of crisis (2008, 2009, 2010) from the rest period. However, regarding the rest period we cannot certainly shape the claim that there is a strong pos-itive influence in the other (except Piraeus) selected ports by a developmental event (like the Athens Olympic Games of the year 2004).
4 Conclusions and policy priorities
International ports have witnessed stable patterns of growth in the last decades. However, the 2008 credit crunch and the subsequent economic crisis reversed this picture [8]. At EU level, the port activity started to decline from the second half of 2008. Greece is listed in the first places regarding the most substantial decreases [10]. Especially the port of Pi-raeus shows a negative trend in main categories of shipping cargoes (containers and bulk) between the years 2002–2010. Apart from that, the freight traffic of the other major Greek ports (Thessaloniki, Patra), remain until now, at the low levels of the recent years.
The relative quantitative analysis, for Piraeus, showed that the major categories of transport affecting the transport load of the port (freight and passenger) are the conventional cargo, bulk cargo and passenger traffic. Furthermore, an attempt for grouping the years (of the last decade) with similar characteristics, which determines the course of re-cent trends and characteristics of the transport load of the port of Piraeus, came up with two key periods (clusters) with common characteristics. The first cluster incorporates the period 2002–2004, a period of increased growth, which could be attributed to the Olympic Games of 2004 in Ath-ens, but that trend has not continued, as shown by the second time cluster, referred to in the post-Olympic period (2005–2010), where there is lower growth, especially to-wards the end of the period. This certainly can be argued that gradually becomes the economic crisis that has, at this
Fig. 4 Time—clusters for the three ports (Piraeus,
time takes effect and the decline of transport. From the combined analysis of all three main ports of the country (Piraeus, Thessaloniki and Patra), there are some differ-ences. More specifically, despite a distinct last period of decline (2008–2010), we cannot certainly shape the claim that during the previous years (2002–2007) there is a strong positive influence in the other selected ports (except of the country capital’s port of Piraeus) by a developmental event (like the Athens Olympic Games). These findings could mean that the spatial developmental impact of the Olympic Games limited at the regional level (Athens-Attica). However, it can be argued that the main findings made above still apply.
It must be noted that the issue of formulating clear causal relationships between the development of transport activity and any time the country’s circumstances, needs more in-vestigation to draw conclusions and certainly safer, can not be exhausted within the limits of this research effort.
In general, primarily the port of Piraeus and the other main ports of the country are disadvantaged compared with other ports in the wider Mediterranean region and Eastern Europe in several points. These are essentially the lack of intermodal transport, particularly the use of containers. In most modern ports in the transport of containers allows the carriage to be combined with road and rail transport, greatly reducing the time and cost of loading and unloading. More specifically, the major disadvantages [3,21,22] relate to the failure to connect to the national rail network (combined transport), the poor management and limited cargo con-tainers, the low availability storage containers at ports and in the region, the relatively limited number of positions of ships, the imbalance in the development of modern port operations and services and the absence of an organized policy of attracting new customers (strong dependence on a few activities and a limited group of customers).
The investments in modern infrastructure, services and systems administration and management of transport project in Greek ports and the development of combined transport are necessary to enhance competitiveness and efficiency of ports and their survival in the new competitive environment international flows, development of combined transport and the creation of the single Pan-European Transport Network [23]. Moreover they are considered crucial to the competi-tiveness and openness of the national economy.
However, the difficulty in capital mobilization, due to the economic crisis, regarding port development, leads to more calls for supranational (EU) funding [8]. Towards this di-rection, funding released under the TEN-T (Trans-European Transport Networks) programme could be a vital part of the EU response to the economic crisis.
The promotion of these development priorities in the framework of the EU Transport Policy and especially through the opportunity presented by the functioning of marine highways which are developed under the
Trans-European Transport Networks in the last years, are consid-ered very important for the future of the Greek economy.
Open AccessThis article is distributed under the terms of the Creative Commons Attribution License which permits any use, distribution, and reproduction in any medium, provided the original author(s) and the source are credited.
References
1. Benevolo L (1980) The history of the City. Scholar Press, London 2. Glaeser LE, Kohlhase EJ (2004) Cities, regions and the decline of
transport costs. Pap Reg Sci 83(1):197–228
3. Christofakis M (2007) Transport and regional development: the policy for transport infrastructures. Dionikos, Athens
4. Papadaskalopoulos A (2008) Patterns and policies of regional development, 2nd edn. Dionikos, Athens
5. Mergos G, Papadaskalopoulos A, Christofakis M, Arseniadou E, Kalliri A (2004) Economic characteristics and development strat-egy of the Greek islands. Athens Academy-Bureau of Economic Research, Athens
6. Hall P (1993) Forces shaping urban Europe. Urban Stud 30(6):883– 898
7. Niavis S, Tsekeris T (2012) Ranking and causes of inefficiency of container seaports in South-Eastern Europe. Eur Transp Res Rev. doi:10.1007/s12544-012-0080-y
8. Pallis A, de Langen P (2010) Seaports and the structural implications of the economic crisis. Res Transp Econ 27(1):10–18
9. International Transport Forum (2010) Recovery in global freight transport weak and uncertain. ITF Quarterly Transport Briefing, OECD. http://www.internationaltransportforum.org/statistics/ shortterm/BriefingQ2_2010.pdf. Accessed 10 September 2012 10. Amerini J (2010) General economic crisis hits European port
activity. 11/2010-St atis ti c s i n focus, Euros t at . http:// epp.eurostat.ec.europa.eu/cache/ITY_OFFPUB/KS-SF-10-011/ EN/KS-SF-10-011-EN.PDF. Accessed 5 September 2012 11. Piraeus Port Authority SA (2011) Elements of freight and
passenger traffic port.http://www.olp.gr. Accessed 11 November 2011
12. Ferrari P, Treglia P, Cascetta E, Nuzzolo A, Olivotto P (1982) A new method for measuring the quality of circulation on motor-ways. Transp Res B 16(5):399–418
13. Chung E (2003) Classification of traffic pattern. 10th world con-gress on intelligent transport systems, paper No 3233. November 16–20, Madrid
14. Rakha H, van Aerde M (1995) Statistical analysis of day-to-day variations in real-time traffic flow data. Transp Res Rec 1510:26– 34
15. Weijermars W, van Berkum E (2005) Analyzing highway flow patterns using cluster analysis. 8th International IEEE Conference on Intelligent Transportation Systems. September 13–16, Vienna 16. Junli C, Yan L, Guangyu L, Yian L (2009) Period selection of
traffic impact analysis based on cluster analysis. J Transp Syst Eng Inf Technol 9(6):63–67
17. Tongzon M (1995) Systematizing international benchmarking for ports. Marit Policy Manag 22(2):155–170
18. Papadaskalopoulos A, Karaganis A, Christofakis M (2005) The spatial impact of EU Pan-European Transport Axes: city clusters formation in the Balkan area and developmental perspectives. Transp Policy 12(6):488–499
20. Thessaloniki Port Authority SA (2011) Elements of freight and passenger traffic port.http://www.thpa.gr/. Accessed 23 November 2011
21. Moukas B (2011) Shipping and handling systems, supplies and products: the case of the port of Piraeus. M. Sc. Thesis. Panteion University, Athens
22. Pardali A, Michalopoulos V (2008) Determining the position of container handling ports, using the benchmarking analysis: the case of the Port of Piraeus. Marit Policy Manag 35(3):271–284 23. Commission E (2000) Status of the Pan-European transport