on the laser speckle contrast method
Alberto Garinei1and Roberto Marsili2
1DMII Department, Università degli Studi Guglielmo Marconi, 00193 Rome, Italy
2Dipartimento di Ingegneria, Università degli Studi di Perugia, Via Duranti, no. 1, 06125 Perugia, Italy
Correspondence to:Roberto Marsili ([email protected])
Received: 20 May 2017 – Revised: 21 June 2017 – Accepted: 22 June 2017 – Published: 14 July 2017
Abstract. When a torque measurement is required, torque transducers show many drawbacks during their use: the usual limits are the need for contact and the effects on shaft line parameters. A new approach is proposed in this work: a non-contact torque meter for a machine shaft has been developed. It carries out torque measurements evaluating the torsional displacement between two distinct sections of the shaft, through the monitoring of their roughness.
The sensing principle employed is the classical laser speckle contrast method. The outcoming intensity scat-tered by the rough surface is processed by a cross-correlation function. In this way, the angular torsion of two distinct sections is obtained. It is therefore possible to point out the applied torque knowing the shaft torsional stiffness.
1 Introduction
In order to carry out the torque measurementM, an indirect measurement technique has been applied. Considering two distinct sections of a shaft, and knowing the torsional stiff-ness moduleK, the value of the torque applied is obtained by the following equation, where1ϑ is the torsion of two sections of the shaft:
M=K·1ϑ. (1)
The innovating technique consists of a new optical exper-imental evaluation of the angular shift, different from the traditional technologies, even the ones employing optical instrumentation, such as stereoscopic lights. The technique is substantially based on the laser speckle contrast method, commonly employed in roughness measurement, as shown in Toh et al. (1998, 2001), Wang et al. (1998), Leonard and Toal (1998) and Yarlagadda (2010). In our application it is used in a torque evaluation supported by the cross-correlation technique for time shift.
Considering two rotating points in two different shaft sec-tions, the roughness profiles will obviously show a peri-odic trend. In an unloaded configuration, a cross-correlation (Yarlagadda, 2010) of the two roughness profiles will carry
out a function with a maximum in time equal totdw. If a torque is applied, the two sections will undergo a recipro-cal rotation. Therefore the previous roughness profiles will be translated in the time domain. Performing again a cross-correlation, it will get out a time function, characterized by a maximum after a period equal to tup. These cross-correlation maxima can be used to extrapolate the angular rotation through the following relation, which also needs the rotational velocity ω monitoring, in the unloaded and up-loaded configurations.
1ϑ= t
up ωup
−
tdw ωdw
(2)
Combining Eqs. (1) and (2), the applied torque is obtained (Speranzini et al., 2016).
Figure 1.Rayleigh roughness definition.
sensors, or a magnetic-encoder-ring or Hall effect sensing element (Cardelli et al., 2015; Fleming, 2008), that may also have problems of thermal stability (Partin et al., 2006; D’Emilia et al., 2015b). It is important to underline how such a measurement is completely contact-free, and it pro-vides the signal only thanks to an incident coherent light on the shaft, coming out from optical fiber. The proposed technique is easier to be applied than other non-contact mea-surement techniques used for the characterization of mate-rials and mechanical components, such as image correlation (Garinei and Marsili, 2013; Speranzini and Agnetti, 2014) and thermo-elasticity (Becchetti et al., 2009a, b). Those tech-niques permit the performance of “full field” stress and strain measurements, but they need high-performance data-processing and image-acquisition systems (Brustenga et al., 2005) and elaborate post-processing procedures to perform analysis on rotating mechanical components (Becchetti et al., 2010; Garinei and Marsili, 2014; Speranzini and Agnetti, 2013).
The outline of this paper is as follows. First, the laser speckle contrast method is described in detail, and the per-formances of the laser contrast method and cross-correlation repeatability tests are discussed in different conditions sim-ulated on a specific test bed. Then the realized measurement setup for torque measurements is described and tested.
2 The scattering of a coherent light by a rough surface: the speckle
As reported in Beckmann and Spizzichino (1987), a possible distinction between rough and smooth surfaces can be made by focusing the attention on their properties of light scatter-ing. In Fig. 1, a light beam, characterized by a wavelengthλ and incoming on a step surface, is considered.
Let us consider the reflected light from two different planes, distant1h. The optical path of the two beams is dif-ferent, as is evident in Fig. 1. This difference is geometrically obtained and equal to the following:
1r= 21h
cosθ. (3)
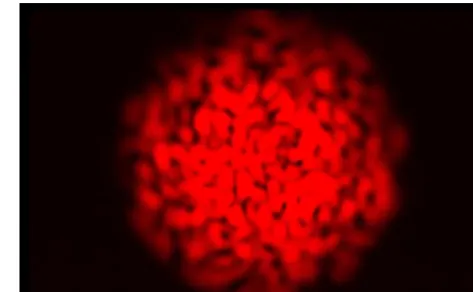
Figure 2.A typical distribution of speckle.
The step represented in the figure could be considered as a simplified roughness profile, whose relationship with the phase shift could be determined by the following proportion:
2π:λ=1φ:1r. (4)
In Eqs. (3) and (4), two extreme cases occur: when the waves are in phase and when the waves are in phase opposition. In the first condition, the light would be reflected as by a smooth surface, while in the second case the two rays of Fig. 1 would combine themselves destructively. Just to respect the energy conservation principle, the incident light should therefore be scattered in all the other directions, as it occurs with rough surface. Conventionally the limit value is fixed atπ/2, just to distinguish between roughness and smoothness, for which the following condition, for the light wavelength, is derived:
1h < λ
8 sinθ. (5)
Equation (5) defines the detectable roughness with a light probe of wavelengthλ.
Employing an appropriate source, it is possible to produce an interaction between rough surface and scattered light-ray phases. One of the possible ways to work out this effect is the well-known laser speckle contrast technique. Indeed, macroscopically, the different phase shift produced by the in-cidence of a light spot on a rough surface results in a diffuse reflection composed of light and dark points, forming the so-called speckle; see Fig. 2. The speckle distribution varies with roughness as a function of phase shift. It is then possible to get speckle’s related information, and consequently rough-ness to, channelling the scattered light into an optical fiber. By coupling the fiber with a photodiode, an electric signal is obtained.
Figure 3.Typical roughness-dependent intensity function.
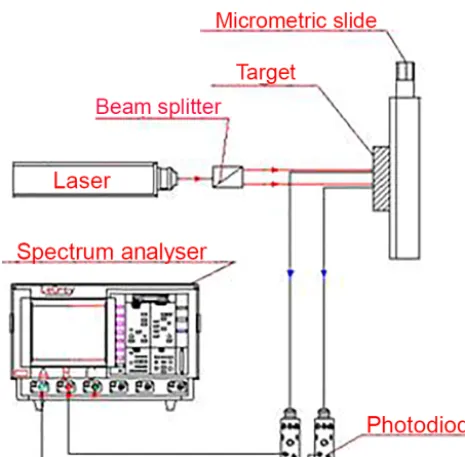
Figure 4.Sketch of the measurement chain.
3 Study of the performances of the laser contrast method measurement chain
The realized measurement chain is illustrated in Fig. 4. The first step was the optimization of the experimental setup. A 10 mW He–Ne laser at 632 nm wavelength as a light source and four multi-mode optical fibres have been used. The out-coming light from the laser is split, through an in-fibre beam splitter, in two multi-mode fibres, whose light strikes the tar-get surface. The tartar-get is made of a steel plate with a known roughness, measured by a traditional mechanical instrument. The target is mounted on an electromechanical sledge, which permits both horizontal and vertical translation with 1 µm steps. The back-reflected light is received by other two multi-mode fibres, which bring the light up to two photodiodes and then to a spectrum analyzer.
The two sensing heads are basically fiber optic reflection sensors, focalized by a graded index cylindrical lens.
There-Figure 5.Scattering coefficient dependence on the incident and re-flection angle of the light.
fore it was necessary to calibrate these sensing heads to ver-ify the misalignment’s effect.
The theoretical analysis highlights that better test condi-tions can be realized by increasing the incident angle valueθ up to 90◦, as shown in Fig. 5. This means that the optical fibre couplers should be placed as near as possible to the grazing angle with respect to the target surface. In this way, the signal intensity would be optimized.
However, the worst conditions have been tested, to check the instrument performance: the fibres have been positioned at nearlyθ≈10◦.
The first optical fiber is mounted on a mechanical micro-metric sledge while the second is fixed. In this way it is also possible to realize the spatial resolution evaluation of the de-scribed setup. In fact, by moving the sledge, an increment of the distance between the fibre couplers is produced. By checking the voltage profile changes, or the cross-correlation peaks, as mentioned above, the spatial resolution is obtained. The incoming light beams have been focused through “selfoc” lenses and spacers and then experimentally detected by moving the horizontally target sledge until the detection of the backscattered signal’s intensity maximum.
The curve shown in Fig. 6 presents a maximum around 19 mm. The performances of the measurement chain have been studied under this configuration.
The first tested feature is the repeatability. The target has been moved along the vertical direction at 3 mm s−1 and a cross-correlation of the signals coming from photodiodes have been performed. The results are shown in Fig. 7.
Figure 6.Back-reflected light intensity against fibre head or target distance.
Figure 7.Cross-correlation repeatability test.
need to follow the temporal shift of the first cross-correlation peak in order to measure in the best test conditions.
In a second test, the distance between the fibre couplers have been increased by 10 µm for the spatial-resolution eval-uation of the instrument. This second test, realized in such conditions, highlights that the system is sensitive to the dis-tance between the fibres: indeed the cross-correlation func-tion changes, as shown in Fig. 8.
However, successive tests pointed out the spatial resolu-tion dependence from the following factors: target rough-ness, incident angle value, incident light wavelength and ma-terial type.
As mentioned in the theoretical analysis, the first three fac-tors modulate the speckle distribution and intensity along the observation direction, while the material knowledge is crit-ical due to the dependence of the scattered light from the conductibility (Myers et al., 2013).
As result of the performed tests, the system spatial res-olution results equal to 10 mm. However, the possibility of enhancing such a feature is quite reasonable, just by opti-mizing the measurement conditions. In particular, in order to improve the signal-to-noise ratio some improvement can be made: the environmental light interference should be reduced as well as the misalignments which cause the light losses, the angle of the fibre couplers should be optimized, and the light-source power should be increased, so that a higher spatial resolution could be obtained. However, the spatial resolution obtained is sufficient to carry out the prototype testing.
Figure 8.Cross-correlation (µs).
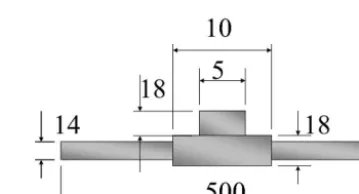
Figure 9.The shaft (dimensions in millimetres, mm).
4 The measurement setup and the experimental results
Once the measurement chain features are defined, it is pos-sible to create an ad hoc setup in order to monitor the non-contact torque measurement technique feasibility. The sim-plest shaft configuration has been used and reported in Fig. 9; it is characterized by a mean superficial roughness equal to 0.88 mm, the same as that tested before. The material is alu-minium.
This is mounted between an electric three-phase asyn-chronous 0.75 kW motor and a linear electromagnetic brake. This assembly is represented in Fig. 10.
The applied torque is constantly monitored by a piezoelec-tric load cell.
Under this configuration, the measurement of the applied torque has been performed through Eqs. (1) and (2).
In order to know the shaft stiffness to deduce the torque from the angular torsion, a finite element method (FEM) shaft model has been created (Fig. 11).
Figure 10.The measurement setup.
Figure 11.The shaft model.
The cross-correlation and the auto-correlation functions, shift for different applied torques, and the angular velocity and the angular shift are reported in Table 1.
Using the torsional stiffness value in Eq. (1), the torques measured by the optical chain are reported in Tables 2 and 3, in comparison with the corresponding numerical outputs.
Analysing the results shown in the previous tables, it is ap-parent that there is a fundamental aspect to emphasize: if the numerical angular shift is greater than the experimental one, the applied torque measurement is less than numerical torque value, and vice versa. It appears to be, therefore, a correlation between these two data sets. The standard deviation valueσ of the points of calibration has resulted (for a range of torque between 1 and 10 N m) that is equal to 1.3 N. The uncertainty relative to the full scale was lower than 13 %.
Table 2.Torque measurement results.
Test Input Experimental number torque torque
value measurement (N m−1) (N m−1)
1 1.0 0.6
2 3.0 4.2
3 8.0 7.6
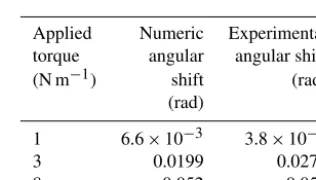
Table 3.Angular shift comparison.
Applied Numeric Experimental torque angular angular shift (N m−1) shift (rad)
(rad)
1 6.6×10⁻³ 3.8×10⁻³
3 0.0199 0.0275
8 0.052 0.051
5 Conclusions
As has been pointed out in the feature evaluation phase, the optical instrument proposed is able to detect the angular shift through the monitoring of the superficial roughness in two different sections of the shaft. The auto- and cross-correlation function in a downloaded state is used to obtain the torque from the torsional shift and from the shaft stiffness. This lat-ter feature is obtainable both theoretically, for simple con-figurations, and numerically through a FEM program. More-over, the comparison between the numerical expected values and the experimental results is a powerful tool for the model validation and, consequently, for the evaluation of different materials and shapes. The instrument innovation is given by the possibility to perform a non-contact torque measurement. At the same time, the measurement chain dimensions could be significantly reduced by using miniaturized optical com-ponents, or, at least, the optical fibres bringing the roughness measurement away enough to not interfere with the test en-vironment.
pects which are able to significantly enhance the system per-formances in a wide field of application.
Data availability. No data sets were used in this article.
Competing interests. The authors declare that they have no con-flict of interest.
Edited by: Rosario Morello
Reviewed by: two anonymous referees
References
Becchetti, M., Flori, R., Marsili, R., and Rossi, G. L.: Stress and strain measurements by image correlation and Thermoelasticity, in: SEM Annual conference & Exposition on Experimental and Applied Mechanics, 1–4 June 2009, Albuquerque, New Mexico, USA, 2009a.
Becchetti, M., Flori, R., Marsili, R., and Rossi, G. L.: Measurement of stress and strain by a thermocamera”, in: SEM Annual con-ference & Exposition on Experimental and Applied Mechanics, 1–4 June 2009, Albuquerque, New Mexico, USA, 2009b. Becchetti, M., Flori, R., Marsili, R., and Moretti, M.:
Compari-son between Digital Image Correlation and Thermoelasticity for Strain Field Analysis, in: 9th International conference on Vi-bration measurements by laser and noncontact techniques, 22– 25 June 2010, Ancona, https://doi.org/10.1063/1.3455462, 2010. Beckmann, P. and Spizzichino, A.: The scattering of Electromag-netic Waves from Rough Surface, Artech House, Incorporated, Artech House, Norwood, Massachusetts, 1987.
Brustenga, G., Marsili, R., Moretti, M., Pirisinu, J., and Rossi, G.: Measurement on rotating mechanical component by thermoelasticity, J. Appl. Mech. Mater., 3–4, 337–342, https://doi.org/10.4028/www.scientific.net/AMM.3-4.337, 2005. Cardelli, E., Faba, A., Marsili, R., Rossi, G., and Tomassini, R.: Magnetic nondestructive testing of rotor blade tips, J. Appl. Phys., 117, 17A705, https://doi.org/10.1063/1.4907180, 2015. Chang, D., Merat, F. L., Discezo, F. M., and Harris, J. S.: Neural
net based torque sensor using birefrangent material, Sensor Ac-tuat. A, 70, 243–249, 1998.
D’Emilia, G., Di Rosso, G., Gaspari, A., and Massimo, A.: Metrological interpretation of a six sigma action for improv-ing on line optical measurement of turbocharger dimensions in the automotive industry, Proceedings of the Institution of Mechanical Engineering: Part D, J. Auto. Eng., 229, 261–269, https://doi.org/10.1177/0954407014539671, 2015a.
D’Emilia, G., Gaspari, A., and Natale, E.: Dynamic Calibration Uncertainty of Three-Axis Low Frequency Accelerometers: Test Rig and Procedure Aspects, Acta Imeko, 4, 75–81, 2015b.
Fleming, W. J.: New Automotive Sensors, IEEE Sensors J., 8, 1900–1921, https://doi.org/10.1109/JSEN.2008.2006452, 2008. Garinei, A. and Marsili, R.: Design of an optical measurement
sys-tem for dynamic testing of electrospindles, Measurement, 46, 1715–1721, https://doi.org/10.1016/j.measurement.2013.01.006, 2013.
Garinei, A. and Marsili, R.: Thermoelastic Stress Analysis of the Contact Between a Flat Plate and a Cylinder, Measurement, 52, 102–110, https://doi.org/10.1016/j.measurement.2014.03.005, 2014.
Kandpal, H. C., Mehta, D. S., and Vaishya, J. S.: Simple method for measurement of surface roughness using spectral interferometry, Opt. Lasers Eng., 34, 139–148, 2000.
Leonard, L. C. and Toal, V.: Roughness measurement of metallic surfaces based on the laser speckle contrast method, Opt. Lasers Eng., 30, 433–440, 1998.
Myers, D. R., Chan, M. W., Vigevani, G., Sosnowchik, B. D., Azevedo, R. G., Jog, A. V., Lin, L., and Pisano, A. P.: Torque measurements of an automotive halfshaft using microdouble-ended tuning fork strain gauges, Sensors Actuat. A, 204, 79–87, 2013.
Partin, D. L., Heremans, J. P., Schroeder, T., Thrush, C. M., and Flores-Mena, L. A.: Temperature Sta-ble Hall Effect Sensors, IEEE Sensors J., 6, 106–110, https://doi.org/10.1109/JSEN.2005.860362, 2006.
Speranzini, E. and Agnetti, S.: Post-cracking behaviour of rein-forced glass beams, in: Proceedings of COST Action TU0905, Mid-term conference on structural glass, 18–19 April 2013, Poreˇc, Croatia, 2013.
Speranzini, E. and Agnetti, S.: The technique of digital image cor-relation (DIC) to identify defects in glass structures, Struct. Cont. Health Monit., 21, 2015–2029, https://doi.org/10.1002/stc.1629, 2014.
Speranzini, E., Agnetti, S., and Corradi, M.: Experimen-tal analysis of adhesion phenomena in fibre-reinforced glass structures, Composites Pt. B, 101, 155–166, https://doi.org/10.1016/j.compositesb.2016.06.074, 2016. Toh, S. L., Shang, H. M., and Tay, C. J.: Surface Roughness Study
Using Laser Speckle Method, Opt. Lasers Eng., 29, 217–225, 1998.
Toh, S. L., Quan, C., Woo, K. C., Tay, C. J., and Shang, H. M.: Whole field surface roughness measurement by laser speckle cor-relation technique, Opt. Laser Technol., 33 427–434, 2001. Wang, W., Wong, P. L., Luo, J. B., and Zhang, Z.: A new optical
technique for roughness measurement on moving surface, Tribol. Int., 31, 281–287, 1998.