http://www.sciencepublishinggroup.com/j/ajmcm doi: 10.11648/j.ajmcm.20190403.11
ISSN: 2578-8272 (Print); ISSN: 2578-8280 (Online)
Stock Market Forecasting Using ant Colony Optimization
Based Algorithm
Muhammed Kabir Ahmed
1, *, Gregory Maksha Wajiga
2, Nachamada Vachaku Blamah
3,
Bala Modi
11
Department of Mathematics, Gombe State University, Gombe, Nigeria
2
Department of Computer Science, Modibbo Adama University of Technology, Yola, Nigria
3
Department of Computer Science, University of Jos, Jos, Nigeria
Email address:
*
Corresponding author
To cite this article:
Muhammed Kabir Ahmed, Gregory Maksha Wajiga, Nachamada Vachaku Blamah, Bala Modi. Stock Market Forecasting Using ant Colony Optimization Based Algorithm. American Journal of Mathematical and Computer Modelling. Vol. 4, No. 3, 2019, pp. 52-57.
doi: 10.11648/j.ajmcm.20190403.11
Received: May 30, 2019; Accepted: July 10, 2019; Published: August 10, 2019
Abstract:
Due to the importance of forecasting the capital market earnings in finance, recently the aspect of stock market prediction has been a major research area that has generated a lot of attention involving various machine learning algorithms. In the recent presentations, it has been indicated that neural networks have some drawbacks in learning the data patterns or that they may perform inconsistently and unpredictable because of the complexity of the stock market data. However, due to the distributive nature of the capital market, a computational intelligence technique called Ant Colony Optimization (ACO) which is suitable for solving distributed control problem was applied in this paper, to get the most optimal solution from three technical analysis strategies. The obtained optimal prediction of the next day closing stock price the ACO algorithm performs better than the other three approaches (Price Momentum Oscillator, Stochastic and Moving Average). Our algorithm (ACO based) was evaluated to have the accuracy of 0.812500, Sensitivity of 0.907407 and Specificity of 0.690476. The ACO based technique have the highest accuracy, Sensitivity and Specificity than the other three (3) technical indicators in predicting the next day closing stock price. Therefore, the optimal prediction of our ACO Agent provides a better forecast than the three initial strategies.Keywords:
Stock Market, Technical Analysis, ACO, Forecasting1. Introduction
In any model of economic development, capital occupies a position of crucial and strategic importance. Economic development of any sort will not be possible unless there is adequate degree of capital formation in the country. However, a very important trait of underdeveloped economy is deficiency of capital, which is due to small savings by communities. The keys to accelerated economic development are much higher investments and domestic savings, combined with efficient financial system necessary to maintain macroeconomic stability, and to significantly improve
needed for Nigeria’s rapid economic development will depend on how fast the major problems impeding its growth are solved [1].
Another work critically analyze the efficiency of capital market on the Nigerian economy for the period between 1979 and 2008 as a reference point for developing economies. The results indicate that the stock market indeed contributes to economic growth as all variables conformed to expectation, even though the Nigerian Stock Exchange has not been having the best of times as an aftermath of the global financial crisis. The unprecedented surge in returns on investment during that period, resulted in a continuous downturn in market capitalization. Multiple regression method of econometric analysis was used for in the paper. The major findings revealed a negative relationship between the market capitalization and the Gross Domestic Product as well as a negative relationship between the turnover ratio and the Gross Domestic Product. However, a positive relationship was observed between the all-share index and the Gross Domestic Product. These findings led to some policy formulations aimed at an improved and developed market for potential gain to the benefit of rational investors, even across national borders [2].
The contribution of the stock market to the growth process of any economy is not in doubt. However, according to Osazevbaru [3] volatility in stock market can trigger a rise in cost of capital which is capable of affecting economic growth negatively. This has implication for portfolio allocation, asset pricing and market risk measure as well. The paper is concentrated on these issues and aims at empirically testing for the presence or otherwise of volatility clustering in the Nigerian stock market. It was concluded that aggressive trading on a wide range of securities should be encouraged as this will increase market debt and hence reduce volatility.
One of the greatest challenges in stock market prediction is understanding where to look in a financial instrument’s time series history. Developing a good platform for knowledge extraction from disparate, jointly informative data history remains a great challenge for the investors in the stock market as well as researchers in the field of machine learning with application in the capital market. According to Ghoshal, and Roberts [4], forecasted daily returns on the S&P 500 index was made, and a broad market benchmark for US equities commonly was viewed as a gauge of financial stability. The S&P 500 is a market capitalization-weighted index of the 500 largest corporations in the US, and it covers the full range of technology, consumer goods, utilities and financial services companies. It is one of the most visible benchmarks in the world, actively traded by buy-and-hold mutual funds and high-frequency hedge funds alike. The authors postulated four broad categories in which to search for significant descriptive variables. Market technical include lagged returns to measure autocorrelation, as well as chartist signals used in industry such as: the Moving Average Convergence Divergence (MACD). Sentiment analysis
covers the impact of news flow, measured by optimism or pessimism in social media. Options market metrics provide a glimpse into the positioning of market experts and describes a principled, data-driven method for modelling price space as an inhomogeneous dimension with regions of directional bias and return compression. Broker recommendations collate the wisdom of equity analysts and allow us to measure the predictive value, if any, of their upgrades and downgrades. We show that predictive performance improves when combining signals from each domain, and provide a principled framework for the triage of inputs by implementing Automatic Relevance Determination (ARD) in the covariance parameterization of an adaptive Gaussian Process model. The performance gain from fusing each domain’s heterogeneous data streams into a single probabilistic model was measured. The findings highlight the critical value of options data in mapping out the curvature of price space and inspire an intuitive, novel direction for research in financial prediction.
Calculating intrinsic value of some company and evaluating shares for long term investment is not easy, since analyst have to care about a large number of financial indicators and evaluate them in a right manner. So far, little help in predicting the direction of the company value over the longer period of time has been provided from the machines. The study of Milosevic [5] presented a support vector machine classification approach to evaluate the equity’s future price over the long time. Their work was able to correctly predict whether some company’s value will be 10% higher or not over the period of one year in 76.5% of cases.
Stock markets generate a lot of priceless data. Such data can be used to analyze historical performance of stocks and predict their relative performance in the future. Tsai and Wang [6] presented a review of literature of Stock market Prediction with Artificial Neural Network and other machine learning methods. Study shows that Artificial Neural Network and other Machine learning methods are able to generate far better result when compared to traditional buy and hold strategy.
high-dimensional historical data. The research proposed deep long-short term memory neural network (LSMN) with embedded layer to predict the stock price. The model achieved the accuracy of 57.2%.
This study is aimed at obtaining optimal prediction from the three technical indicators using Ant Colony Optimization. Ant colonies, and more generally social insect societies, are distributed systems that, in spite of the simplicity of their individuals, present a highly structured social organization. As a result of this organization, ant colonies can accomplish complex tasks that in some cases far exceed the individual capabilities of a single ant. The field of ‘‘ant algorithms’’ studies models derived from the observation of real ants’ behavior, and uses these models as a source of inspiration for the design of novel algorithms for the solution of optimization and distributed control problems [9].
Blum [10] gives behavior of each ant in nature, wander randomly at first, laying down a pheromone trail, if food is found, and then returns to the nest laying down another pheromone trail, if pheromone is found, with some increased probability, it then follows the pheromone trail, and once back at the nest, it goes out again in search of food. However, pheromones evaporate over time, such that unless they are reinforced by more ants, the pheromones will disappear.
MAX–MIN Ant System (MMAS) is another improvement over the original ant system and it was proposed by the research [11]. Four main modifications with respect to ant system were introduced by Katiyar et al [12] thus:
(1)Only the best ant adds pheromone trails i. e. either the ant that produced the best tour in the current iteration, or the best-so-far ant is allowed to deposit pheromone. But this may lead to a stagnation.
(2)The situation defined earlier can be modified by MMAS i. e. the minimum and maximum values of the pheromone are explicitly limited.
(3)The pheromone trails are initialized to the upper pheromone trail limit, which, together with a small pheromone evaporation rate increases the exploration of tours at the start of the search.
(4)Finally, in MMAS, pheromone trails are reinitialized each time the system approaches stagnation or when no improved tour has been generated for a certain number of consecutive iterations.
Looking at the distributive nature of stock market environment where a number of independent stock brokers from different stock broking firm participate in the stock trading under strict regulation and monitoring by the Stock Exchange and the suitability of Ant Colony Optimization in solving distributed control problem, the meta heuristic technique can be applicable in addressing the challenges of the capital market In Ramalingam [13], an Ant Colony Optimization (ACO) based SPP model is presented to predict the prices correctly. The efficiency of the proposed ACO-SPP model was evaluated by comparing the performance with a set of traditional ML based classifiers
such as Naive Bayes (NB), Support Vector Machine (SVM), Multilayer Perceptron (MLP), Radial Basis Function (RBF), J 48, RF, Classification and Regression Tree (CART) and Olex-GA. To emphasize the benefits of ACO-SPP model, it is applied to a benchmarked dataset named Dow Jones Index (DJI) dataset and three datasets from Yahoo finance on daily, weekly and monthly basis. The experimental results shows that the ACO-SPP accurately predicts stock prices as compared to the other methods in terms of accuracy, F-score, AUC, Discriminant Power and Youden's Index.
However, since in Ramalingam [13], the ACO based model was compared with other classifiers, there is need to come up with a ACO based selection model that will predict the stock price and compare it other technical indicators that are widely used by the stock brokers
2. Prediction Using Technical Analysis
Technical analysis is a trading discipline employed to evaluate investments and identify trading opportunities by analyzing statistical trends gathered from trading activity, such as|: price movement and volume. Unlike fundamental analysts, who attempt to evaluate a security's intrinsic value, technical analysts focus on patterns of price movements, trading signals and various other analytical charting tools to evaluate a security's strength or weakness [14].
Technical analysis can be used on any security with historical trading data. This includes stocks, futures, commodities, fixed-income, currencies, and other securities. In this paper, we shall analyze stocks in our examples, bearing in mind that these concepts can be applied to any type of security. In fact, technical analysis is far more prevalent in commodities and forex markets where traders focus on short-term price movements.
2.1. Experimental Setup for the Technical Indicators Based Prediction
A one hundred (100) day stock data for American Stock Exchange obtained from quantquote daily SP 500 was used. The closing price was used as the input parameter for the prediction process. The result of our prediction was tested and evaluated based on the following parameters.
Accuracy: Accuracy is the degree of correctness to calculate the performance of the system.
Accuracy=TP+TN/(TP+TN+FP+FN)
Sensitivity: It is a measure of how a system properly identifies an increase in the closing price.
Sensitivity = TP/(TP+FN)
Specificity: It is a measure of how a system properly identifies ta decrease in the closing price.
2.2. Price Momentum Oscillator (PMO) Algorithm
This subsection provides the detail steps followed to come up with the prediction using the PMO as
TC = today’s close price
TDAC = close price ten days ago
The following algorithm was used to calculate PMO:
PMO = TC – TDAC
The following algorithm, based on PMO was used to predict an increase or decrease in tomorrow’s closing stock price PMO:
If (PMO > 0)
Predict increase in tomorrow’s closing price Else
Predict decrease in tomorrow’s closing price End if
Table 1. PMO Prediction Result.
TP 38
TN 23
FP 15
FN 14
The table 1 shows the result of prediction using PMO.
Table 2. PMO Evaluation.
ACCURACY 0.677778
SENSITIVITY 0.730769
SPECIFICITY 0.605263
The table 2 present the evaluation of the prediction using PMO.
2.3. Stochastic (%K) Algorithm
The following algorithm was used to calculate %K. TC = today’s close price
LN = lowest low for 5 days HN = highest high for 5 days %K = (TC - LN)/(HN - LN)*100 If (%K > 40)
Predict increase in tomorrow’s closing price Else
Predict decrease in tomorrow’s closing price End if
Table 3. Result of Stochastic Prediction.
TP 49
TN 27
FP 14
FN 6
The table 3 present the result of prediction using stochastic indicator.
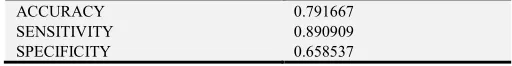
Table 4. Evaluation of Stochastic Prediction.
ACCURACY 0.791667
SENSITIVITY 0.890909
SPECIFICITY 0.658537
The table 4 shows the evaluation of prediction the stochastic.
2.4. Moving Average (MA) Algorithm
This subsection provides the detail steps followed to come up with the prediction using MA
MA = the sum of the most recent ten days closing divided by ten.
The following algorithm, based on MA was used to predict an increase or decrease in Tomorrow’s closing stock price MA:
If (Today’s MA > Yesterday’s MA)
Predict increase in tomorrow’s closing price Else
Predict decrease in tomorrow’s closing price End if
Table 5. Result of Prediction using Moving Average.
TP 28
TN 18
FP 20
FN 23
The table 5 shows the result of prediction using Moving Average.
Table 6. Evaluation of Prediction using Moving Average.
ACCURACY 0.516854
SENSITIVITY 0.54902
SPECIFICITY 0.473684
The table 6 shows the evaluation of prediction using Moving Average
3. ACO Based Selection and Prediction
Algorithm
We can relate Ant Colony to stock market environment as follows:
Ant→Stockbroker (Investment Analyst)
Pheromone→Technical Indicators and other trading strategies
Food→Stocks
Nest→Stock Broking Firms
The metaheuristic algorithm below was used in selection of the best strategies based on technical analysis to get the optimal solution (best market prediction).
ACO Based Selection and Prediction Algorithm Using Technical Analysis
Procedure Technical Analysis-ACO (Ants:%K, PMO, MA)
While (termination-criterion-not-satisfied)
schedule-activities (make prediction using three strategies:%K, PMO, MA)
Calculate the point acquired by Ants for Prediction Ants with the highest point update pheromone Optimal Prediction= Result [updated Pheromone] investor-generation-and-activity()
pheromone-evaporation() end schedule-activities end while
end Procedure
Procedure investor-generation-and-activity()
repeat in parallel for i=3 to m (number-of- Ant_Investors) new-investor(i)
end repeat in parallel end Procedure
Procedure new-investor(investor-strategy) initialize-investor(investor-id)
Initialize-investor-buy-sell-memory() while (current-date <> end-date) compute-recommended-stocks selected-stock = apply-decision-policy
buy-and-sell-to-move-to-next-state (selected-stock) if (on-line-step-by-step-pheromone-update) deposit-pheromone-on-the-visited-edge() end if
update-buy-sell-internal-state()
end while if (online-delayed-pheromone-update) for each visited edge
deposit-pheromone-on-the-visited-edge() end for
end if
release-investor-resources(investor-strategy) end Procedure
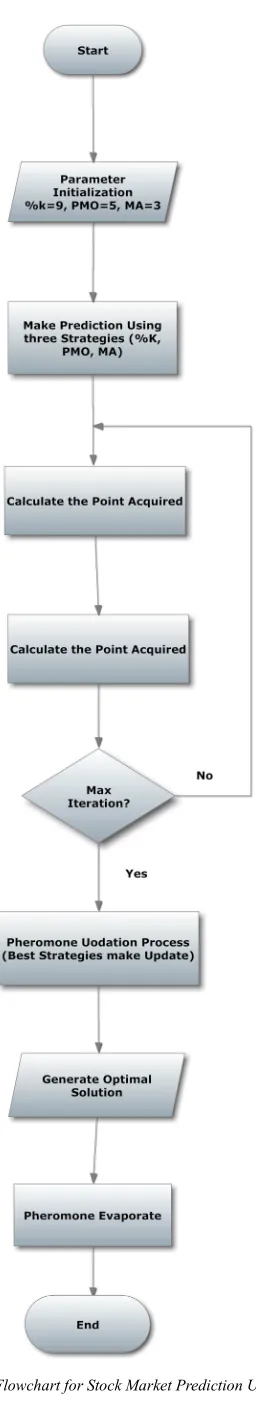
The figure 1 shows the flowchart indicating the steps and processes to follow in order to come up with ACO based prediction. As it be seen from the flowchart, three technical indicators are used for the initial stock price. Each of the three indicators were assigned with a value based on their accuracy. Stochastic is assigned with a value of nine (9) having the come out with the best prediction among the technical indicators. While Price Momentum Oscillator and Moving Average were given the value of five (5) and three (3) respectively. The assignment of these values is based on the performance of their individual prediction.
Table 7. ACO Result.
TP 49
TN 29
FP 13
FN 5
The table 7 shows the ACO based prediction result.
Table 8. ACO Evaluation.
ACCURACY 0.812500
SENSITIVITY 0.907407
SPECIFICITY 0.690476
The table 8 show the ACO evaluation.
4. Discussion of Results of Technical
Analysis Based Prediction
This section of this research has come up with an Ant Colony Optimization algorithm that is capable of obtaining optimal solution from three (3) strategies that are based on technical analysis. The major goal here was to obtain the most accurate prediction strategy (optimal solution). The optimal solution was obtained from the three strategies in which Ant (s) that obtained the highest point will update the pheromone to forecast the next day closing stock price (iteration). From the analysis and evaluation of the whole four strategies (i. e ACO inclusive), the ACO based technique have the highest accuracy, Sensitivity and Specificity than the other three (3) technical indicators in predicting the next day closing stock price.
The prediction accuracy of this work exceeds that of Decision three (DT), Artificial Neural Network (ANN) and also the hybrid approach which is a combination of ANN and DT as presented in [6]. Table 9 shows the comparison.
Table 9. Comparison of Prediction Accuracy with other approaches.
ACO 0.812500
Decision Tree (DT) 0.654150
ANN 0.59.0160
DT+ANN (Hybrid) 0.771985
5. Conclusion
There is no doubt that stock market investment is one of the tool for economic development of any nation. As a result of this reason, a new prediction scheme using a meta-heuristic technique called Ant Colony Optimization. The ACO based Selection Algorithm was developed to also serve as an investment adviser to provide market signal whether a stock price will increase or decrease in the next day trading. The Algorithm have the highest accuracy, Sensitivity and Specificity than the other three (3) technical indicators in predicting the next day closing stock price. Hence it can be concluded that, the optimal prediction of our ACO Agent provides a better forecast than the three initial strategies. In addition to that the work achieved the accuracy of 81% which greater than that of the Hybrid (DT+ANN) prediction.
6. Recommendation
The future work can be focused on several aspect of stock market. First of all, other strategies for stock market prediction can be used in other to improve the ACO selection and prediction process. Similarly more market related input variables will be considered, in order to provide more
optimal solution. Further enhancement or other evolutionary technique such as simulated annealing, particle swarm optimization can be applied as regard to stock market prediction to explore on whether these Meta heuristic techniques can performs better than our ACO approach.
References
[1] Adanma, E. S., Oleka, D. C., and Nwanne, T. F. I. (2015). The Nigerian Stock Exchange: A Bane for Sustainable Economic Development. EUROPEAN JOURNAL OF BUSINESS AND SOCIAL SCIENCES. Vol. 3, No. 1.
[2] Olusegun, O., Matthew, O., and Fasina, F. (2011). Nigerian stock exchange and economic development. Knowledge Management, Information Management, Learning Management. No. 14.
[3] Osazevbaru, H. O. (2014). Measuring Nigerian Stock Market Volatility. SINGAPOREAN Journal of Business Economics, and management studies Vol. 2, no 8.
[4] Ghoshal, S. and Roberts, S (2015). Forecasting Time Series from heterogeneous Data Streams using Adaptive Automatic Relevance Determination Gaussian Process Regression. University of Oxford.
[5] Milosevic, N. (2016). Equity Forecast: Predicting Long Term Stock Price Movement using Machine Learning. Journal of Economics Library Volume 3 (2).
[6] Tsai, C. F. and Wang, S. P., (2009). Stock Price Forecasting by Hybrid Machine Learning Techniques: Proceedings of the International Multi-Conference of Engineers and Computer Scientists IMECS 2009, Hong Kong. Vol. 1.
[7] Shen, S., Jiang, H. and Zhang, T. (2016). Stock Market Forecasting Using Machine Learning Algorithms. Citeseer. [8] Pang. X, Zhou. Y, Wang. P, Lin, W and Chang, V. Stock
Market Prediction based on Deep Long Short Term Memory Neural Network In Proceedings of the 3rd International Conference on Complexity, Future Information Systems and Risk (COMPLEXIS 2018), pages 102-108.
[9] Dorigo, M and Stutzle, T. (2004). Ant Colony Optimizatio:. London: A Bradford Book, The MIT Press, Cambridge, Massachusetts.
[10] Blum, C. (2005). Ant Colony Optimization: Introduction and Recent Trends: Science Direct, Physics of Life Review 353-373. [11] Stützle, T. and Hoosb, H. H. (2000). MAX–MIN Ant System:
Future Generation Computer Systems, 16 (2000) 889–914. [12] Katiyar, S, Nasiruddin, I and Ansari, A.(2015). Ant Colony
Optimization: A Tutorial Review. National Conference on Advances in Power and Control, At Faculty of Engineering and Technology, Manav Rachna International University, Faridabad, Haryana.
[13] Ramalingam. S and Sujatha. P (2018). An Extensive Work on Stock Price Prediction Using Ant Colony Optimization Algorithm (ACO-SPP). International Journal of Intelligent Engineering and Systems, Vol. 11, No. 6.