RESEARCH
Predictors of response to fixed-dose
vasopressin in adult patients with septic shock
Gretchen L. Sacha
1*, Simon W. Lam
1, Abhijit Duggal
2, Heather Torbic
1, Stephanie N. Bass
1, Sarah C. Welch
1,
Robert S. Butler
3and Seth R. Bauer
1Abstract
Background: Vasopressin is often utilized for hemodynamic support in patients with septic shock. However, the most appropriate patient to initiate therapy in is unknown. This study was conducted to determine factors associated with hemodynamic response to fixed-dose vasopressin in patients with septic shock.
Methods: Single-center, retrospective cohort of patients receiving fixed-dose vasopressin for septic shock for at least 6 h with concomitant catecholamines in the medical, surgical, or neurosciences intensive care unit (ICU) at a tertiary care center. Patients were classified as responders or non-responders to fixed-dose vasopressin. Response was defined as a decrease in catecholamine dose requirements and achievement of mean arterial pressure ≥ 65 mmHg at 6 h after initiation of vasopressin.
Results: A total of 938 patients were included: 426 responders (45%), 512 non-responders (55%). Responders had lower rates of in-hospital (57 vs. 72%; P < 0.001) and ICU mortality (50 vs. 68%; P < 0.001), and increased ICU-free days at day 14 and hospital-free days at day 28 (2.3 ± 3.8 vs. 1.6 ± 3.3; P < 0.001 and 4.2 ± 7.2 vs. 2.8 ± 6.0; P < 0.001, respec-tively). On multivariable analysis, non-medical ICU location was associated with increased response odds (OR 1.70; P = 0.0049) and lactate at vasopressin initiation was associated with decreased response odds (OR 0.93; P = 0.0003). Factors not associated with response included APACHE III score, SOFA score, corticosteroid use, and catecholamine dose.
Conclusion: In this evaluation, 45% responded to the addition of vasopressin with improved outcomes compared to non-responders. The only factors found to be associated with vasopressin response were ICU location and lactate concentration.
Keywords: Sepsis, Septic shock, Vasopressors, Vasopressin, Norepinephrine, Catecholamines
© The Author(s) 2018. This article is distributed under the terms of the Creative Commons Attribution 4.0 International License (http://creativecommons.org/licenses/by/4.0/), which permits unrestricted use, distribution, and reproduction in any medium, provided you give appropriate credit to the original author(s) and the source, provide a link to the Creative Commons license, and indicate if changes were made.
Background
Due to its vasoconstrictive properties, arginine vasopres-sin (AVP) is often utilized in practice for patients with shock requiring hemodynamic support. The Surviving Sepsis Campaign guidelines suggest AVP as an adjunct to norepinephrine (NE) at a fixed dosage of 0.03 units/ min to achieve mean arterial pressure (MAP) goals or decrease NE requirements [1]. However, due to lim-ited data these recommendations have a weak grading. In the landmark Vasopressin and Septic Shock Trial
(VASST), patients were randomized to either AVP plus NE or NE monotherapy, with no mortality difference detected between treatment approaches [2]. However, further analyses have suggested that patients with less severe forms of septic shock may benefit from AVP [2, 3]. Despite limited data supporting the efficacy of this agent and weak guideline recommendations, clinicians com-monly utilize AVP in practice.
The importance of targeting and maintaining goal MAP along with early initiation of vasoactive agents in patients with septic shock has been associated with reduced mortality rates [4, 5]. In fact, delays in vasoactive initia-tion were associated with increased mortality [5]. Con-versely, the importance of limiting catecholamines (CA)
Open Access
*Correspondence: sachag@ccf.org
1 Department of Pharmacy, Cleveland Clinic, 9500 Euclid Avenue
(Hb-105), Cleveland, OH 44195, USA
and utilizing non-CA vasoactive agents, such as AVP, is becoming more apparent and may ultimately improve patient outcomes [6–8]. Similarly, initiating AVP early in shock presentation may yield beneficial results [9, 10].
Unfortunately, there are still many unknowns regard-ing the most appropriate management strategy in patients with septic shock and the choice of vasoac-tive agent (especially second line) involves the weigh-ing of a dynamic interplay of mechanisms and resultant responses of these agents. Specifically, one such agent is AVP and the ideal patient population to initiate AVP is unknown. There are limited data that may indicate a ben-efit in patients that are less severely ill [2, 3], have renal dysfunction [11, 12], or are receiving corticosteroids [13–15]. This study was designed to describe the impact of fixed-dose AVP on hemodynamic response and deter-mine factors associated with response to AVP in a large cohort of adult patients with septic shock. The primary objective was to ascertain patient-specific factors at AVP initiation associated with a higher likelihood of response to AVP therapy. Secondary objectives included com-paring clinical outcomes between responders and non-responders, and evaluating clinical characteristics over time, including MAP, lactate and CA dosage.
Methods
This was a retrospective, single-center evaluation of fixed-dose AVP at a large tertiary care academic medi-cal center. Adults over the age of 18 with active orders for AVP between September 2011 and August 2015 were screened for inclusion. Patients with septic shock, receiv-ing adjunctive, fixed-dose AVP for at least 6 h in the medical intensive care unit (ICU), surgical ICU, or neuro-sciences ICU were included. Patients must have received one or more CA agent for at least 1 h prior to AVP ini-tiation and only the first course of AVP was included. Patients were excluded if they had incomplete electronic data or AVP was initiated in the operating room.
Patients were classified as responders to AVP if they achieved both a decrease in CA dosage and MAP ≥ 65 mmHg 6 h after AVP initiation. Six hours was chosen based on an evaluation showing MAP during the first 6 h was independently associated with mortality in patients with septic shock [16]. CA dosage was described in NE-equivalent dosage requirements from the fol-lowing formula [NE (mcg/min)] + [Epinephrine (mcg/ min)] + [Dopamine (mcg/kg/min)/2] + [Phenylephrine (mcg/min)/10] [2]. Septic shock was defined as meeting two or more systemic inflammatory response syndrome criteria with the presence of antibiotics and hypotension requiring CAs. The presence of acute kidney injury (AKI) was determined and patients were categorized into one of the risk, injury, failure, loss, and end-stage kidney disease
(RIFLE) categories based on serum creatinine increase at ICU admission and AVP initiation [11]. Total fluid bolus volume was calculated as crystalloid volume, with colloid equivalent doses [17, 18] and defined as total volume of fluids given 6 h prior to NE initiation until AVP initiation. Corticosteroid receipt was defined as receiving at least one dose of corticosteroids at AVP initiation up to 6 h after initiation.
Outcomes collected included in-hospital and ICU mor-tality, alive ICU-free days at day 14, alive hospital-free days at day 28, duration of mechanical ventilation, SOFA score change 48 h after AVP initiation, CA dosage change at 6 h after AVP initiation, need for continuous renal replacement therapy (CRRT) initiation, and CA duration. Cohorts of interest were defined a priori based on previ-ous literature suggesting beneficial outcomes with AVP: NE-equivalent CA dose < 15 mcg/min at AVP initiation [2], lactate concentration ≤ 1.4 mmol/L at AVP initiation [2], receipt of corticosteroids [13, 15] obesity category [19, 20], the use of > 1 vasoactive agent at AVP initiation [2], and renal insufficiency per RIFLE category [11].
Data are presented as mean ± SD for continuous varia-bles and n (%) for categorical variables. Univariate analy-ses between responders and non-responders were tested using either Chi-Square or Fisher’s exact test, as appro-priate, for categorical variables or ANOVA for continu-ous variables. Between-group differences in change in MAP, lactate concentration, CA dosage requirements, and central venous oxygen saturation (ScvO2) were assessed at consecutive time intervals from AVP initia-tion to 72 h. A Bonferroni correcinitia-tion was applied to the pairwise comparisons. The effect of baseline variables on AVP response and ICU mortality were assessed using stepwise multivariable logistic regression. Statistically significant and variables with biologic plausibility for influencing the outcome were considered for the model and tested for colinearity using variance inflation factors and condition indices. If two variables were determined to be collinear [21], only one was included in the multi-variable regression analysis. P values < 0.05 were consid-ered to be statistically significant. All statistical analyses were performed with SAS 9.4 Software (SAS Institute Inc., Cary, NC) and StataIC 14 (StataCorp LLC, Col-lege Station, Tx). This study was approved by the Cleve-land Clinic institutional review board (Study Number 15-2100).
Results
Table 1). When compared to responders, non-respond-ers had higher rates of hepatic failure (19.3 vs. 14.3%;
P= 0.04), lower MAP values (65 ± 12 vs. 69 ± 12 mmHg; P < 0.001) and higher lactate concentrations (5.4 ± 4.8 vs.
4.0 ± 3.6 mmol/L; P < 0.001) at AVP initiation. The
aver-age AVP initial dose was 0.03 units/min (range 0.01–0.08 units/min).
Responders had lower rates of in-hospital and ICU mortality (56.6 vs. 71.7%; P < 0.001 and 50.2 vs. 67.8%;
P < 0.001, respectively), more ICU-free days at day 14 (2.3 ± 3.8 vs. 1.6 ± 3.3 days; P < 0.001), more hospital-free days at day 28 (4.2 ± 7.2 vs. 2.8 ± 6.0 days; P < 0.001) and less frequent need for CRRT within 72 h after AVP initiation (20.2 vs. 30%; P= 0.002) (Table 2). There was a significant difference between groups in the change in SOFA score from AVP initiation until 48 h (responders 0.30 ± 2.9 vs. non-responders 0.83 ± 2.9; P= 0.02) and CA dose change from AVP initiation until 6 h (responders
− 12.8 ± 9.6 mcg/min vs. non-responders +13.8 ± 51.2 mcg/min; P < 0.001). Responders also had more CA-free and MV-free days on day 14 compared to non-respond-ers (both P < 0.001). On multivariable logistic regression, treatment in the surgical or neurosciences ICU compared to the medical ICU and lower lactate concentrations was independently associated with higher odds of response to AVP (P= 0.005 and P < 0.001, respectively). Additionally, a positive hemodynamic response to AVP was indepen-dently associated with lower ICU mortality (Table 3).
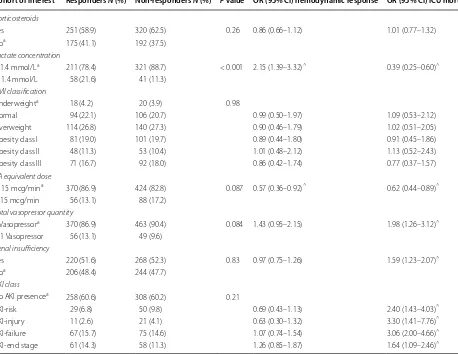
In the predefined cohorts of interest, there was no association between the cohort designation and
hemodynamic response in patients whether classi-fied on the receipt of corticosteroids, obesity category, number of vasopressors required at AVP initiation, or RIFLE-defined AKI. Patients with lactate concentra-tions ≤ 1.4 mmol/L had higher odds of response to AVP while patients with NE-equivalent CA doses < 15 had a decreased odds of response to AVP (Table 4).
There was a significant difference in CA dosage between responders and non-responders at every time point from AVP initiation through 48 h (Fig. 2a). There was also a significant difference in MAP change from AVP initiation in the responders compared to the non-responders at 3 and 24 h: +5.4 versus +2.6 mmHg (P < 0.001) and +2.0 versus − 2.0 mmHg (P < 0.001) (Fig. 2b). Finally, lactate concentration differed signifi-cantly between responders and non-responders at every time point evaluated from AVP initiation through 48 h (Fig. 2c). There was no difference in ScvO2 at any time point (Fig. 2d).
Discussion
This evaluation identified 938 patients in which 45% had a positive hemodynamic response to AVP which was associated with decreased mortality, increased ICU- and hospital-free days, and decreased CA dosage require-ments. The improvement in outcomes in responders indicates the definition used for hemodynamic response may be an appropriate pharmacodynamic marker of response to AVP therapy and should be further evaluated in future studies. Furthermore, on multivariable analyses, non-medical ICU treatment and decreasing lactate con-centrations were independently associated with a positive response to AVP and AVP response was independently associated with decreased ICU mortality. It is important to understand that the clinical utilization of AVP and its place in therapy relies on imperfect data, clinical expe-rience, and weak guideline recommendations. Regard-less of this, it is commonly used in clinical practice as an adjunct to NE in patients with refractory septic shock [22]. Its proposed mechanism of action is twofold, by causing V1 receptor-mediated vasoconstriction in some vascular smooth muscle beds [23], AVP can be utilized as a vasopressor similar to CAs. Additionally, in patients with septic shock, a relative endogenous vasopressin defi-ciency may exist and fixed, low dose exogenous AVP can be utilized as an endocrine supplement with resultant improvements in hemodynamics [12, 24–27]. Clinicians are often put in challenging situations in which they must determine if AVP should be initiated for an individual patient with few data available to inform the decision. The results of this study identify patient characteristics associated with response to AVP and can assist with deci-sion-making regarding AVP initiation.
Fig. 1 Patient inclusion and exclusion tree. There were 2555 patients screened for inclusion into the study. Of the screened patients, 1506 patients did not meet initial inclusion criteria and 111 met exclusion criteria leaving 938 patients included in the evaluation. AVP arginine vasopressin; CA catecholamine; EMR electronic medical record; OR
Table 1 Baseline characteristics
Characteristic Total (N = 938) Non-responders (N = 512) Responders (N = 426) P value
Characteristics at ICU admission
Age, years 62 ± 14 61 ± 15 62 ± 14 0.17
Male, n (%) 493 (52.6) 272 (53.1) 221 (51.9) 0.70
Race, n (%) 0.10
Caucasian 652 (69.5) 357 (69.7) 295 (69.2)
African American 241 (25.7) 124 (24.2) 117 (27.5)
Other 45 (4.8) 31 (6.1) 14 (3.3)
ICU type, n (%) 0.06
Medical 712 (75.9) 401 (78.3) 311 (73.0)
Neurological 65 (6.9) 27 (5.3) 38 (8.9)
Surgical 161 (17.2) 84 (16.4) 77 (18.1)
Weight, kg 90.5 ± 34.0 92.0 ± 37.1 88.6 ± 29.9 0.13
BMI, kg/m2 31.5
± 11.7 31.9 ± 12.6 31.0 ± 10.4 0.22
ESRD, n (%) 119 (12.7) 58 (11.3) 61 (14.3) 0.17
APACHE III 106 ± 34 107 ± 36 104 ± 30 0.09
APS 90 ± 32 92 ± 35 88 ± 29 0.14
Comorbid conditions, n (%)
Diabetes mellitus 286 (30.5) 152 (29.7) 134 (31.5) 0.56
Hepatic failure 160 (17.1) 99 (19.3) 61 (14.3) 0.04
Immune suppression 196 (20.9) 109 (21.3) 87 (20.4) 0.75
Leukemia/myeloma 65 (6.9) 38 (7.4) 27 (6.3) 0.52
Moderate COPD 13 (1.4) 9 (1.8) 4 (0.9) 0.45
Severe COPD 85 (9.1) 42 (8.2) 43 (10.1) 0.45
No chronic health issues, n (%) 232 (24.7) 118 (23.0) 114 (26.8) 0.19
Characteristics at time of AVP initiation
Appropriate antibiotics, n (%)a 887 (94.6) 487 (95.1) 400 (93.9) 0.41
Fluids prior to AVP, mL/kg 30.7 ± 34.4 30.6 ± 35.1 30.8 ± 33.6 0.95
MAP, mmHg 67 ± 12 65 ± 12 69 ± 12 < 0.001
Lactate, mmol/L 4.8 ± 4.4 5.4 ± 4.8 4.0 ± 3.6 < 0.001
SOFA score 13 ± 4 12 ± 3 13 ± 4 0.49
Total CA dose
mcg/min 28.2 ± 19.9 27.8 ± 21.9 28.6 ± 17.3 0.54
mcg/kg/min 0.34 ± 0.26 0.33 ± 0.27 0.35 ± 0.25 0.18
Catecholamine agent, n (%)
Norepinephrine 937 (99.9) 511 (99.8) 426 (100.0) 0.99
Phenylephrine 66 (7.0) 31 (6.1) 35 (8.2) 0.20
Epinephrine 25 (2.7) 11 (2.1) 14 (3.3) 0.28
Dopamine 4 (0.4) 2 (0.4) 2 (0.5) 0.99
AVP dose
Units/min 0.0314 ± 0.0063 0.0317 ± 0.0064 0.0312 ± 0.0062 0.24
Units/kg/h 0.0226 ± 0.0084 0.0224 ± 0.0084 0.0227 ± 0.0083 0.66
Corticosteroids, n (%) 571 (60.9) 320 (62.5) 251 (58.9) 0.26
AKI, n (%) 0.21
Risk 79 (8.4) 50 (9.8) 29 (6.8)
Injury 32 (3.4) 21 (4.1) 11 (2.6)
Failure 142 (15.1) 75 (14.6) 67 (15.7)
Loss 0 (0) 0 (0) 0 (0)
CRRT, n (%) 159 (17.0) 81 (15.8) 78 (18.3) 0.31
AKI acute kidney injury, AVP arginine vasopressin, APS acute physiology score, BMI body mass index, CA catecholamine, COPD chronic obstructive pulmonary disease, CRRT continuous renal replacement therapy, ESRD end-stage renal dysfunction, MAP mean arterial pressure, SOFA sequential organ failure assessment
a Antibiotics were considered to be appropriate if patients received antibiotics described in the Centers for Medicare & Medicaid Services sepsis measure or received
VASST is the largest trial of AVP in septic shock and randomized patients to either AVP plus NE or NE mono-therapy [2]. While no mortality difference was detected between groups in the main analysis, several subsequent analyses have suggested benefit in specific subgroups of patients. In a priori-defined subgroup analyses, VASST showed improved 28- and 90-day outcomes in patients allocated to AVP with “less severe septic shock” (CA requirements < 15 mcg/min) and patients receiving one vasopressor at baseline (compared to two or more) [2], findings which were not corroborated in the current study. Furthermore, in contrast to VASST, the current study found patients with CA doses < 15 mcg/min had lower odds of response to AVP. The cutoff of 15 mcg/ min was based on the results of VASST; however, it is unknown if an optimal CA dose threshold for achieving hemodynamic response with AVP exists and 15 mcg/min may not be the ideal threshold to evaluate. In fact, in a recent retrospective cohort study, increasing the AVP initiation threshold from a NE dose of 10 mcg/min to 50 mcg/min was not associated with increased mortality [28]. It should be noted that in clinical practice, AVP is frequently initiated in patients with NE dosage require-ments exceed 15 mcg/min. In fact, the average NE dose at AVP initiation was 28 mcg/min in the current study which is similar to VASST (20 mcg/min) [2].
In an additional VASST post hoc subgroup analysis, patients receiving AVP with baseline lactate concen-tration ≤ 1.4 mmol/L had lower 28-day mortality rates
than those receiving NE [2]. A subsequent re-analysis of VASST based on the updated definitions for septic shock also found improved survival in patients initiated on AVP with a lactate concentration ≤ 2 mmol/L [3]. The current study parallels these findings, with lower lactate concen-trations independently associated with higher odds of hemodynamic response. Altogether, low lactate concen-trations appear to be a useful biomarker for initiation of AVP. In comparison with VASST, which found no effect on renal replacement therapy, the current evaluation showed that fewer responders required a new initiation of CRRT compared to non-responders. These findings corroborate those from the Vasopressin versus Norepi-nephrine as Initial Therapy in Septic Shock (VANISH) trial which showed a decreased rate of renal replacement therapy initiation in patients who received vasopressin (when compared to NE) [29].
In addition, this study found no association with corti-costeroid use and hemodynamic response; a combination previously thought to have a positive interaction [13]. The lack of an effect observed in this evaluation compared to previous studies could be due to differences of corticos-teroid use. In the VASST analysis, the use of corticoster-oids was regarded as receipt of at least one dose within the 28-day observation period, whereas the current study ensured corticosteroids were used concomitantly with AVP. However, it is important to note that patients could have received corticosteroids up to 6 h after AVP initia-tion, potentially affecting their ability to detect a response Table 2 Patient outcomes
CA catecholamine, CRRT continuous renal replacement therapy, MV mechanical ventilation, SOFA sequential organ failure assessment a Evaluated at hour 48 after vasopressin initiation
b Evaluated only in patients who survived at least 24 h after vasopressin initiation
c Evaluated at hour 6 after vasopressin initiation
Outcome Total (N = 938) Non-responders (N = 512) Responders (N = 426) P value
In-hospital mortality, n (%) 608 (64.8) 367 (71.7) 241 (56.6) < 0.001
ICU mortality, n (%) 561 (59.8) 347 (67.8) 214 (50.2) < 0.001
ICU-free days at day 14 1.9 ± 3.6 1.6 ± 3.3 2.3 ± 3.8 < 0.001
Hospital-free days at day 28 3.4 ± 6.6 2.8 ± 6.0 4.2 ± 7.2 < 0.001
MV-free days at day 14 2.8 ± 4.9 2.2 ± 4.5 3.6 ± 5.3 < 0.001
SOFA score changea 0.6 ± 2.9 0.8 ± 2.9 0.3 ± 2.9 0.02
Respiration score change 2.3 ± 1.5 2.0 ± 1.5 2.5 ± 1.4 < 0.001
Coagulation score change 0.46 ± 1.0 0.5 ± 0.9 0.4 ± 1.0 0.19
Liver score change 0.1 ± 0.7 0.1 ± 0.8 0.7 ± 0.6 0.90
Neurological score change − 0.1 ± 1.1 0.1 ± 1.1 − 0.2 ± 1.0 < 0.001
Cardiovascular score change − 1.9 ± 1.7 − 1.6 ± 1.7 − 2.1 ± 1.7 < 0.001
CRRT initiation between AVP start and 72 h, n (%)b 190 (25.0) 112 (30.0) 78 (20.2) 0.002
CA dose changec, mcg/min +1.7 ± 40.6 +13.8 ± 51.2 − 12.8 ± 9.6 < 0.001
to corticosteroids in the evaluated time frame. Further-more, the lack of detected benefit with corticosteroids could be due to differences in the outcomes evaluated in the current study (hemodynamic response) versus his-torical studies (mortality) [2, 13–15]. However, the lack of association seen in the current evaluation corroborates the findings seen in VANISH which detected no interac-tion between AVP and corticosteroid use on 28-day mor-tality [29]. Additional studies are needed to determine the relationship between corticosteroid use and hemody-namic response to AVP in patients with septic shock.
An additional finding of the current study was the CA-sparing effect, in that CA dosages decreased in respond-ers at every time point from AVP initiation until 48 h. In fact, because the MAP was > 65 mmHg when AVP was added, a CA-sparing effect was likely the intended goal of AVP initiation. Responders also had more CA-free days at day 14 compared to non-responders, further showing the CA-sparing effect observed in this group. The benefit of sparing CAs in patients with septic shock has recently become more apparent [6–8]. One analysis found that raising MAP values above 70 mmHg with increasing vas-oactive doses resulted in increased organ failure events [6]. Additionally, excess CAs can have a negative effect on the immune system and can cause tachyarrhythmias, hyperglycemia, splanchnic hypoperfusion, and myo-cardial depression. This new perspective emphasizes
the importance of limiting CA doses while maintaining goal MAP, a method that can be achieved through AVP utilization.
Upon multivariable logistic regression, treatment in the medical ICU was associated with lower odds of response to AVP. Patients with sepsis secondary to medi-cal (vs. surgimedi-cal) conditions have higher mortality [30], which may influence AVP response. Additionally, these patient populations can present with a differing mix of comorbidities, which may alter patient outcomes differ-ently [31], and medical patients may have lower frequen-cies of infectious source control (due to the prevalence of in-operable infections, i.e., pneumonia), which could decrease their response to treatment, including vasoac-tive therapies. It is also possible that there were residual confounders between medical ICU and non-medical ICU patients unable to be controlled for in the multi-variable model. This finding of differing AVP response by treatment ICU and the potential mechanisms should be explored further.
This study has important implications for practice and future research. Regardless of the patients’ CA dose, the association between low lactate concentration and hemo-dynamic response with AVP suggests that this marker of “less severe septic shock” is a useful indicator for AVP ini-tiation. Furthermore, because of the improved outcomes in patients who had a positive hemodynamic response to Table 3 Results of multivariable analyses
AKI acute kidney injury, AVP vasopressin, ESRD end-stage renal dysfunction, SOFA sequential organ failure assessment
a Variables entered into the model but without a statistically significant association with vasopressin response include RIFLE-defined AKI category, corticosteroid use, SOFA score, APACHE III score, hepatic failure, race, age, and catecholamine dosage (in mcg/kg/min)
Outcome OR (95% CI) P value
Multivariable analysis and association with response to vasopressina
Non-medical ICU 1.70 (1.18–2.46) 0.005
Lactate at AVP initiation, mmol/L 0.93 (0.89–0.97) < 0.001
Multivariable analysis and association with ICU mortality
Hemodynamic response to AVP 0.51 (0.35–0.76) 0.001
Catecholamine dose, mcg/kg/min 3.14 (1.36–7.28) 0.008
Lactate at AVP initiation, mmol/L 1.10 (1.04–1.18) 0.002
AKI presence
Rifle versus no AKI 3.64 (1.77–7.49) < 0.001
Injury versus no AKI 5.80 (1.13–29.60) 0.035
Failure versus no AKI 2.63 (1.38–5.01) 0.003
ESRD versus no AKI 2.37 (1.27–4.43) 0.007
APACHE III score 1.01 (1.01–1.02) < 0.001
SOFA score 1.16 (1.08–1.25) < 0.001
Medical ICU 1.58 (1.02–2.45) 0.040
Race (Caucasian) 1.72 (1.14–2.60) 0.010
Age 1.01 (1.00–1.03) 0.036
AVP at 6 h, monitoring for the achievement of hemody-namic stability can be an important early warning sign for the bedside clinician. Specifically, in patients who do not achieve hemodynamic stability within 6 h of starting AVP, alternative therapeutic interventions such as epi-nephrine [32], corticosteroids [33, 34], angiotensin II [35] (if available), or increasing AVP dose (especially when NE requirements exceed 0.6 mcg/kg/min) [36] should be considered. The use of this trigger and the next best step should be further investigated. Future trials should incorporate the observed factors associated with AVP response into their design, which may improve their like-lihood of finding a target population for AVP use. Addi-tionally, trials should evaluate when to initiate additional adjunctive agents and also compare efficacy between adjunctive agents.
Strengths of this evaluation include its a priori-defined cohorts for analysis, and evaluation of fixed-dose AVP (which removes the potential confounder of titrated doses on AVP response). Limitations of this evaluation include the fact that it was a single-center, retrospec-tive study with no randomization and relied on medical record charting that may not instantaneously capture exact medication administration timing and hemody-namic change. Secondly, the definition of AVP response was not developed based on previous literature or able to be validated in this current study, but was created in an attempt to reflect hemodynamic response to this agent. However, based on the observed differences between responders and non-responders, it appears to accurately reflect a clinically meaningful response. Albeit, with this definition, patients who were already in the recovery Table 4 Predefined cohorts of interest
AKI acute kidney injury, BMI body mass index, CA catecholamine ^ P < 0.05
a The reference group used for the odds ratio result
Cohort of interest Responders N (%) Non-responders N (%) P value OR (95% CI) hemodynamic response OR (95% CI) ICU mortality
Corticosteroids
Yes 251 (58.9) 320 (62.5) 0.26 0.86 (0.66–1.12) 1.01 (0.77–1.32)
Noa 175 (41.1) 192 (37.5)
Lactate concentration
> 1.4 mmol/La 211 (78.4) 321 (88.7) < 0.001 2.15 (1.39–3.32)^ 0.39 (0.25–0.60)^
≤ 1.4 mmol/L 58 (21.6) 41 (11.3)
BMI classification
Underweighta 18 (4.2) 20 (3.9) 0.98
Normal 94 (22.1) 106 (20.7) 0.99 (0.50–1.97) 1.09 (0.53–2.12)
Overweight 114 (26.8) 140 (27.3) 0.90 (0.46–1.79) 1.02 (0.51–2.05)
Obesity class I 81 (19.0) 101 (19.7) 0.89 (0.44–1.80) 0.91 (0.45–1.86)
Obesity class II 48 (11.3) 53 (10.4) 1.01 (0.48–2.12) 1.13 (0.52–2.43)
Obesity class III 71 (16.7) 92 (18.0) 0.86 (0.42–1.74) 0.77 (0.37–1.57)
CA equivalent dose
≥ 15 mcg/mina 370 (86.9) 424 (82.8) 0.087 0.57 (0.36–0.92)^ 0.62 (0.44–0.89)^
< 15 mcg/min 56 (13.1) 88 (17.2)
Total vasopressor quantity
1 Vasopressora 370 (86.9) 463 (90.4) 0.084 1.43 (0.95–2.15) 1.98 (1.26–3.12)^
> 1 Vasopressor 56 (13.1) 49 (9.6)
Renal insufficiency
Yes 220 (51.6) 268 (52.3) 0.83 0.97 (0.75–1.26) 1.59 (1.23–2.07)^
Noa 206 (48.4) 244 (47.7)
AKI class
No AKI presencea 258 (60.6) 308 (60.2) 0.21
AKI-risk 29 (6.8) 50 (9.8) 0.69 (0.43–1.13) 2.40 (1.43–4.03)^
AKI-injury 11 (2.6) 21 (4.1) 0.63 (0.30–1.32) 3.30 (1.41–7.76)^
AKI-failure 67 (15.7) 75 (14.6) 1.07 (0.74–1.54) 3.06 (2.00–4.66)^
phase of septic shock with decreasing CA dosage at AVP initiation were regarded as “responders.” Additionally, patients classified as “non-responders” may have had decreased overall CA exposure with AVP than if they were not started on AVP, which was not accounted for in our definition of response. This study was also unable to incorporate markers of tissue perfusion (e.g., lactate, urine output, pH) into the definition of hemodynamic response, because these parameters were not consist-ently or frequconsist-ently monitored and documented for every included patient. The importance of markers of tissue perfusion should not be overlooked as patients could potentially be at goal MAP, with reductions in CA doses as a result, but still have tissue hypoperfusion. This study
also classified patients as having septic shock based on the previous definition and not the updated 2016 defini-tion [1] which may result in more patients being included than those who had septic shock per the newest defini-tion. Furthermore, cardiac output data were not available for most patients and therefore not collected. Although ScvO2 values were elevated at baseline and not signifi-cantly different between responders and non-responders, we cannot adequately compare cardiac output between response groups. Additionally, the retrospective nature of this study makes identifying patients with true sep-tic shock difficult, and as such, patients may have been included or excluded inadvertently. Finally, excluding patients who did not receive AVP for at least 6 h may
have influenced the rates of response to therapy, as there may have been patients who responded earlier than 6 h and no longer needed vasoactive support with AVP (true responders) or patients who died within 6 h (true non-responders) and subsequently were excluded from the evaluation.
Conclusion
The current evaluation identified a large cohort of patients receiving fixed-dose AVP in which 45% responded to therapy. AVP response was associated with improved mortality and ICU and hospital-free days, indi-cating the definition used for hemodynamic response may be an appropriate pharmacodynamic marker of AVP therapy that can be used in future trials. In agree-ment with historical trials, patients with less severe forms of septic shock (lower lactate concentrations at baseline) appear to benefit more from AVP in comparison with patients with more severe forms. Future studies should incorporate the observed factors related to AVP response into their subsequent design to definitively identify the most appropriate patient population that would benefit from AVP.
Abbreviations
AKI: acute kidney injury; AVP: arginine vasopressin; CA: catecholamine; CRRT: continuous renal replacement therapy; ICU: intensive care unit; NE: norepi-nephrine; MAP: mean arterial pressure; RIFLE: risk, injury, failure, loss, end-stage kidney disease category; ScVO2: central venous oxygen saturation; SOFA:
sequential organ failure assessment; VASST: vasopressin and septic shock trial.
Authors’ contributions
GLS contributed to study design, acquisition of data, analysis and interpreta-tion of data, statistical analysis, drafting of the manuscript, critical revision of the manuscript for important intellectual content and provided final approval of the version to be published. SWL contributed to study conception and design, acquisition of data, analysis and interpretation of data, critical revi-sion of the manuscript for important intellectual content and provided final approval of the version to be published. AD contributed to study concep-tion, critical revision of the manuscript for important intellectual content and provided final approval of the version to be published. HT, SNB, and SCW contributed to study design, critical revision of the manuscript for important intellectual content and provided final approval of the version to be pub-lished. RSB contributed to statistical analysis and interpretation of data and provided intellectual input to the research and manuscript. SRB contributed to study conception and design, acquisition of data, analysis and interpretation of data, statistical analysis, drafting of the manuscript, critical revision of the manuscript for important intellectual content and provided final approval of the version to be published. All authors agree to be accountable for all aspects of work in ensuring that questions related to the accuracy or integrity of any part of the work are appropriately investigated and resolved. The authors would like to thank Eric Vogan for his assistance with this project. All authors read and approved the final manuscript.
Author details
1 Department of Pharmacy, Cleveland Clinic, 9500 Euclid Avenue (Hb-105),
Cleveland, OH 44195, USA. 2 Respiratory Institute, Cleveland Clinic, Cleveland,
OH, USA. 3 Department of Quantitative Health Sciences, Cleveland Clinic,
Cleveland, OH, USA.
Acknowledgements
The results of this evaluation were presented in abstract form at the Society of Critical Care Medicine’s 2017 Critical Care Congress on January 23rd, 2017 in Honolulu, Hawaii.
Competing interests
The authors declare that they have no competing interests.
Availability of data and materials Not applicable.
Consent for publication All authors consent to publication.
Ethics approval and consent to participate
This manuscript was approved by the Cleveland Clinic’s local IRB and all authors consent to participate.
Funding
No funding was received for this project.
Publisher’s Note
Springer Nature remains neutral with regard to jurisdictional claims in pub-lished maps and institutional affiliations.
Received: 8 November 2017 Accepted: 26 February 2018
References
1. Rhodes A, Evans LE, Alhazzani W, Levy MM, Antonelli M, Ferrer R, et al. Surviving sepsis campaign: international guidelines for management of sepsis and septic shock: 2016. Intensive Care Med. 2017;43(3):304–77. 2. Russell JA, Walley KR, Singer J, Gordon AC, Hebert PC, Cooper DJ, et al.
Vasopressin versus norepinephrine infusion in patients with septic shock. N Engl J Med. 2008;358(9):877–87.
3. Russell JA, Lee T, Singer J, Boyd JH, Walley KR, Vasopressin, et al. The septic shock 3.0 definition and trials: a vasopressin and septic shock trial experi-ence. Crit Care Med. 2017;45(6):940–8.
4. Beck V, Chateau D, Bryson GL, Pisipati A, Zanotti S, Parrillo JE, et al. Timing of vasopressor initiation and mortality in septic shock: a cohort study. Crit Care. 2014;18(3):R97.
5. Bai X, Yu W, Ji W, Lin Z, Tan S, Duan K, et al. Early versus delayed admin-istration of norepinephrine in patients with septic shock. Crit Care. 2014;18(5):532.
6. Dunser MW, Ruokonen E, Pettila V, Ulmer H, Torgersen C, Schmittinger CA, et al. Association of arterial blood pressure and vasopressor load with septic shock mortality: a post hoc analysis of a multicenter trial. Crit Care. 2009;13(6):R181.
7. Rudiger A, Singer M. Decatecholaminisation during sepsis. Crit Care. 2016;20(1):309.
8. Andreis DT, Singer M. Catecholamines for inflammatory shock: a Jekyll-and-Hyde conundrum. Intensive Care Med. 2016;42(9):1387–97. 9. Hammond DA, Cullen J, Painter JT, McCain K, Clem OA, Brotherton
AL, et al. Efficacy and safety of the early addition of vasopressin to norepinephrine in septic shock. J Intensive Care Med. 2017. https://doi. org/10.1177/0885066617725255.
10. Clem OPJ, Cullen J, McCain K, Kakkera K, Meena N, Hammond D. Nor-epinephrine and vasopressin vs norNor-epinephrine alone for septic shock: randomized controlled trial [abstract]. Crit Care Med. 2016;44(12 Suppl 1):1350.
11. Gordon AC, Russell JA, Walley KR, Singer J, Ayers D, Storms MM, et al. The effects of vasopressin on acute kidney injury in septic shock. Intensive Care Med. 2010;36(1):83–91.
13. Russell JA, Walley KR, Gordon AC, Cooper DJ, Hebert PC, Singer J, et al. Interaction of vasopressin infusion, corticosteroid treatment, and mortal-ity of septic shock. Crit Care Med. 2009;37(3):811–8.
14. Bauer SR, Lam SW, Cha SS, Oyen LJ. Effect of corticosteroids on arginine vasopressin-containing vasopressor therapy for septic shock: a case control study. J Crit Care. 2008;23(4):500–6.
15. Torgersen C, Luckner G, Schroder DC, Schmittinger CA, Rex C, Ulmer H, et al. Concomitant arginine-vasopressin and hydrocortisone therapy in severe septic shock: association with mortality. Intensive Care Med. 2011;37(9):1432–7.
16. Varpula M, Tallgren M, Saukkonen K, Voipio-Pulkki LM, Pettila V. Hemody-namic variables related to outcome in septic shock. Intensive Care Med. 2005;31(8):1066–71.
17. Finfer S, Bellomo R, Boyce N, French J, Myburgh J, Norton R, et al. A com-parison of albumin and saline for fluid resuscitation in the intensive care unit. N Engl J Med. 2004;350(22):2247–56.
18. Brunkhorst FM, Engel C, Bloos F, Meier-Hellmann A, Ragaller M, Weiler N, et al. Intensive insulin therapy and pentastarch resuscitation in severe sepsis. N Engl J Med. 2008;358(2):125–39.
19. Wacharasint P, Boyd JH, Russell JA, Walley KR. One size does not fit all in severe infection: obesity alters outcome, susceptibility, treatment, and inflammatory response. Crit Care. 2013;17(3):R122.
20. Miller JT, Welage LS, Kraft MD, Alaniz C. Does body weight impact the efficacy of vasopressin therapy in the management of septic shock? J Crit Care. 2012;27(3):289–93.
21. DA Belsley KE, Welsch RE. Regression diagnostics: identifying influential data and sources of collinearity. Hoboken: Wiley; 1980.
22. Vail EA, Gershengorn HB, Hua M, Walkey AJ, Wunsch H. Epidemiology of vasopressin use for adults with septic shock. Ann Am Thorac Soc. 2016;13(10):1760–7.
23. Russell JA. Bench-to-bedside review: vasopressin in the management of septic shock. Crit Care. 2011;15(4):226.
24. Landry DW, Levin HR, Gallant EM, Ashton RC Jr, Seo S, D’Alessandro D, et al. Vasopressin deficiency contributes to the vasodilation of septic shock. Circulation. 1997;95(5):1122–5.
25. Landry DW, Levin HR, Gallant EM, Seo S, D’Alessandro D, Oz MC, et al. Vasopressin pressor hypersensitivity in vasodilatory septic shock. Crit Care Med. 1997;25(8):1279–82.
26. Holmes CL. Vasopressin in septic shock: does dose matter? Crit Care Med. 2004;32(6):1423–4.
27. Holmes CL, Patel BM, Russell JA, Walley KR. Physiology of vasopressin relevant to management of septic shock. Chest. 2001;120(3):989–1002. 28. Wu JY, Stollings JL, Wheeler AP, Semler MW, Rice TW. Efficacy and
out-comes after vasopressin guideline implementation in septic shock. Ann Pharmacother. 2016. https://doi.org/10.1177/1060028016669163. 29. Gordon AC, Mason AJ, Thirunavukkarasu N, Perkins GD, Cecconi M,
Cepkova M, et al. Effect of early vasopressin vs norepinephrine on kidney failure in patients with septic shock: the VANISH randomized clinical trial. JAMA. 2016;316(5):509–18.
30. Angus DC, Linde-Zwirble WT, Lidicker J, Clermont G, Carcillo J, Pinsky MR. Epidemiology of severe sepsis in the United States: analysis of incidence, outcome, and associated costs of care. Crit Care Med. 2001;29(7):1303–10. 31. Esper AM, Martin GS. The impact of comorbid [corrected] conditions on
critical illness. Crit Care Med. 2011;39(12):2728–35.
32. Annane D, Vignon P, Renault A, Bollaert PE, Charpentier C, Martin C, et al. Norepinephrine plus dobutamine versus epinephrine alone for manage-ment of septic shock: a randomised trial. Lancet. 2007;370(9588):676–84. 33. Sligl WI, Milner DA Jr, Sundar S, Mphatswe W, Majumdar SR. Safety and
efficacy of corticosteroids for the treatment of septic shock: a systematic review and meta-analysis. Clin Infect Dis. 2009;49(1):93–101.
34. Annane D, Sebille V, Charpentier C, Bollaert PE, Francois B, Korach JM, et al. Effect of treatment with low doses of hydrocortisone and fludrocortisone on mortality in patients with septic shock. JAMA. 2002;288(7):862–71.
35. Khanna A, English SW, Wang XS, Ham K, Tumlin J, Szerlip H, et al. Angiotensin II for the treatment of vasodilatory shock. N Engl J Med. 2017;377(5):419–30.