BRIEF COMMUNICATION
Analysis of Alternatively Spliced Rice Transcripts Using
Microarray Data
Ki-Hong Jung&Laura E. Bartley&Peijian Cao& Patrick E. Canlas&Pamela C. Ronald
Received: 15 July 2008 / Accepted: 4 November 2008 / Published online: 24 December 2008 #Springer Science + Business Media, LLC 2008
Abstract Alternative splicing creates a diversity of gene products in higher eukaryotes. Twenty-five percent (1,583/ 6,371) of predicted alternatively spliced transcripts can be detected using the NSF45K rice whole-genome oligonucle-otide array. We used the NSF45K array to assess differen-tial expression patterns of 507 loci showing at least a twofold change in expression between light- and dark-grown seedlings. At least 42% of these loci show evidence of alternative splicing in aerial seedling tissue of Oryza sativassp.japonicacv. Nipponbare. Most alternative splice forms display the same pattern of regulation as the primary, or most highly expressed, transcript; however, splice forms for ten loci, represented by 35 oligos, display opposite expression patterns in the light vs. dark. We found similar evidence of alternative splicing events in Affymetrix microarray data for Nipponbare rice treated with the causative agent of fungal rice blast,Magnaporthe grisea. This strategy for analyzing alternative splicing in micro-array data will enable delineation of the diversity of splicing in rice.
Keywords Rice . Transcription . Microarray .
Alternative splicing . Light response .Magnaporthe grisea
Introduction
Rice (Oryza sativa) is a staple food for more than 50% of the human population and a model organism for study of grass species [12, 16]. The rice genome is estimated to encode more than 40,000 genes [9,12, 35]. Furthermore, recent analyses of expressed sequence tags and full-length cDNA sequences provides evidence that 21.2% of the predicted rice genes are alternatively spliced, similar to the percent of alternatively spliced transcripts in Arabidopsis
[34]. Alternative splicing generates different forms of mature messenger RNA (mRNA) from the same genetic locus and contributes to expanding diversity of gene function in most eukaryotes [24,34]. For example, relative to each other, different splice forms may have altered mRNA stability or translational efficiency or encode proteins with modified localization or function [6,19,36]. Significantly, around 15% of disease-causing mutations in human genes are point mutations in the vicinity of mRNA splice junctions, supporting the hypothesis that alternative splicing can have major effects on gene function [10,18]. Understanding the function of all rice genes, including alternative splice forms, will be invaluable toward improv-ing rice and other grass species to meet human needs.
A first step to characterize rice mRNA splicing is to identify alternative splice forms and determine when and where each form is expressed. Alternatively, spliced tran-scripts have been experimentally identified in large numb-ers through de novo sequencing methods such as conventional expressed sequence tag (EST) sequencing and massively parallel signature sequencing [17, 20, 21, 25]. Oligonucleotide microarray analysis of expression patterns associated with alternatively spliced transcripts has often been used in studies of human disease but has not been widely applied in plants [10, 19, 31]. Genome-wide Electronic supplementary material The online version of this article
(doi:10.1007/s12284-008-9020-9) contains supplementary material, which is available to authorized users.
K.-H. Jung
:
L. E. Bartley:
P. Cao:
P. E. Canlas:
P. C. Ronald (*)Department of Plant Pathology, University of California, Davis, CA, USA
surveys of human alternative pre-mRNA splicing with exon junction microarrays have quickly increased understanding of the population of alternatively spliced transcripts and revealed that at least 74% of human genes express multiple mRNAs via alternative splicing [10]. At this time, micro-arrays composed of exon junctions are not available for rice. Information on rice splicing may be extracted from tiling array data [21, 22], which provides complete information regarding alternatively spliced transcripts, or next generation sequencing methods. However, the high cost of such experiments is a deterrent to assaying expression in various tissues or under various conditions. As most alternative splice forms are expressed at low levels across various tissues, researchers need to develop an efficient strategy to characterize alternative splicing [26,34].
Recently, we have developed a rice oligonucleotide (oligo) near-whole genome array called the NSF45K array (http://www.ricearray.org/) based on the genome sequence of the Nipponbare cultivar [13]. Out of approximately 17,000 predicted alternative splice forms, the NSF45K array was designed to detect 3,430 alternative forms. We find that at least 42% of those transcripts show evidence of alternative splicing in young leaves as indicated by different levels of expression among splice forms. We find that most alternative splice forms show similar changes in expression due to light or fungal pathogen treatments relative to the most highly expressed splice form. Light- and dark-regulated gene expression patterns of alternatively spliced transcripts for four loci were validated by reverse transcrip-tase polymerase chain reaction (RT-PCR).
Results
Distinguishing alternatively spliced transcripts with the rice NSF45K oligo array
The recent The Institute for Genomic Research/Rice Genome Annotation Project (TIGR/RGAP) version 5 annotation suggests that 6,371 (∼16%) of the 41,046 nontransposable element-related gene loci in rice produce 10,113 additional alternatively spliced transcripts resulting in a total of 51,286 nontransposable element rice gene models (http://rice.plantbiology.msu.edu/pseudomolecules/ info.shtml). Whole genome oligonucleotide arrays have been extensively used to examine mRNAs expressed in many tissues with different developmental stages or treat-ments. More than four whole genome oligonucleotide array platforms have been used in rice for transcriptome analysis [12]. Oligonucleotide array design algorithms are often unable to design oligos specific for all transcripts in a genome, especially for each alternatively spliced transcript. Instead, oligos designed with the sequences shared among
alternatively spliced transcripts have been generated to expand the coverage of transcriptomes by whole genome oligo arrays [23,33]. In the NSF45K array, 6,544 oligos are shared by 15,003 gene models, i.e., transcripts. As possible, to distinguish among the common targets, the NSF45K array and other publicly available rice arrays contain other oligos that probe unique regions of alternative splice forms. The NSF45K array was designed with the oligo identifica-tion tool PICKY 2.0 to distinguish 1,583 alternatively spliced transcripts through a combination of 3,430 shared and unique oligonucleotides [5, 14]. By utilizing a combination of NSF45K array probe sets, we were able to explore the existence of alternative transcripts on a large scale and examine or deduce their expression patterns.
Transcription patterns of alternatively spliced transcripts in light- vs. dark-grown rice seedlings
We performed expression-profiling experiments with the NSF45K microarray on 2-week-old rice leaf tissue grown under light and dark conditions harvested from four rice varieties, O. sativa ssp. japonica cultivars Kitaake, Nipponbare, and Tapei309 and the O. sativa ssp. indica
cultivar IR24 [13]. While splicing patterns may be conserved among the rice cultivars, it is also possible that exon nucleotide sequence differences among rice varieties might reduce annealing of transcripts to NSF45K array oligos, which were designed to recognize Nipponbare sequences. Reduced annealing of some exons relative to others from different cultivars might complicate analysis of alternative splicing based on absolute target signal values. Thus, to avoid this potential problem, we focused the analysis on the Nipponbare NSF45K array data.
fraction of alternative splice forms. Simultaneously, this analysis implies that many alternative splice forms may accumulate to different levels, possibly resulting in accu-mulation of varying amounts of protein products with different functions.
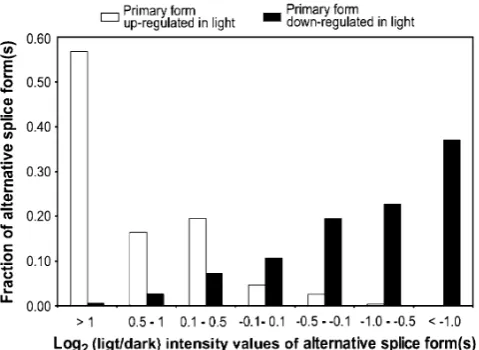
We also analyzed whether alternative splice forms show quantitatively different changes in accumulation under light vs. dark conditions. For example, one splice form may increase in abundance due to dark treatment while another from the same locus may decrease in abundance in the dark. For this analysis, we selected differentially expressed loci with log2light/dark ratios greater than 1 or less than−1 (i.e., twofold changes in light vs. dark) from among the 1,583 alternatively spliced loci, represented by 3,430 oligos. We assigned the oligos associated with the highest expression as the primary splice form for each locus. Of these primary splice forms, 243 showed increased expres-sion in the light and 264 in the dark. Next, we compared the differential expression patterns of the primary splice forms with the expression patterns of other oligos for the same loci, i.e., alternative splice forms (Fig. 1; Table 1). The distribution of log2 ratios of oligos corresponding to alternative splice forms shows that transcripts of most loci undergo similar changes in expression (Fig. 1; Table 1). Specifically, almost 85% (206/243) of alternative splice forms accumulate more than 1.4-fold in the light compared
to the dark (log2>0.5) if the primary splice forms also accumulates over twofold in the light (Fig.1). Similarly, if the primary splice form accumulates more in the dark (log2<−1.0), the alternative splice forms are also more likely to accumulate in the dark. Thus, transcripts have similar tendencies of differential expression despite differ-ent absolute levels of most of the splice forms.
Oppositely regulated alternative transcripts in light- vs. dark-grown rice in the NSF45K data
According to the NSF45K array data, 1.2% (13/1,124) of the transcripts clearly show opposite regulation compared to the primary transcript in light vs. dark. The loci included in this analysis are associated with at least two oligos that give a normalized spot intensity of over 120. From among the 507 loci for which the primary transcript shows at least a twofold change in expression, we identified ten such
“oppositely differentially regulated”loci in Nipponbare. Of these, the alternative transcript(s) of nine loci show at least 1.4-fold induction (log2≥0.5) in the light while the primary transcript shows more than twofold induction in the dark (log2<−1.0). On the other hand, the alternative transcript of one locus (LOC_Os03g01750) revealed 1.5-fold induction in the dark (log2=−0.6), while the primary transcript exhibited 2.8-fold induction in the light (log2=1.5).
Figure 2 shows NSF45K microarray data for the 35 oligos that represent the ten “oppositely differentially regulated” loci in Nipponbare. All array data displayed in Fig. 2 are in Table S2. Figure S1 displays the primary structure of and the oligos that map to these loci. The primary transcripts are positioned at the top of each locus entry. As is typical for heat map displays of array data, each row in Fig.2represents the signal associated with a single oligo. However, rather than probing a single target gene model, many of the oligos were designed to recognize more than one target transcript. The locus identifiers of the targets are listed in the far right column (TIGR_gene_ model). When we deduce, based on the absolute and differential intensities of all the oligos for each locus that a given probe is likely to be reporting primarily on one or more gene models, those identifiers are listed in bold. We deduce that individual transcripts of the first six listed loci (Os07g47100, Os05g28960, Os03g63074, Os08g13630,
Os03g17980, and Os07g05610) can be distinguished by comparing the differential expression patterns of two–four probes for each locus, whereas for the four loci at the bottom of the Fig. 2 (Os02g26700, Os04g41100,
Os10g40934, andOs03g01750), we deduce that the signal for some of the oligos represent the merged expression patterns of two–six transcripts (Fig. 2). The validity of comparing absolute intensities of different probes to deduce the abundance of which transcripts are predominantly Fig. 1 Distribution of alternative splice forms for primary transcripts
represented by a particular probe is supported by RT-PCR analysis for a few loci in the next section.
Here, we discuss two examples of loci, the transcripts of which exhibit simply distinguished striking opposite regu-lation in Nipponbare. At the top of Fig.2,Os07g47100 is predicted to encode a sodium hydrogen exchanger 3 family protein. The primary oligo, TR071793, which shows the highest signal intensity, anneals to the 3′-untranslated region (UTR) of both predicted transcripts (-.1 and -.2), whereas the secondary probe, TR050429, recognizes only the 5′-UTR of the second transcript (-.2). For this gene, the second transcript (Os07g47100.2) is highly induced in the dark, so we deduce thatOs07g47100.1is highly expressed in the light (Fig. 2). Another alternatively spliced locus,
Os06g28960, encodes an acyltransferase family protein, and is predicted to have alternatively spliced 3′-UTRs. In this case, opposite differential expression patterns of the alternative splicing forms are easily distinguished because each transcript is recognized by a single oligo. Further, analysis of these alterative transcripts may reveal important functional differences in their light-regulated functions.
In Fig.2, we have included the microarray data for the other varieties tested in the NSF45K light vs. dark experiment to facilitate evaluation of whether opposite differential expression patterns are maintained across varieties. Similar expression pattern across varieties improves both technical and biological confidence in the data. Because any sequence variation among varieties that affects hybridization efficiency is constant within each cultivar, the differential expression analysis of each indi-vidual oligo is relatively accurate as opposed to comparing absolute expression between oligos. We observe that in the three diverse rice varieties, the primary transcripts showed consistent differential expression patterns compared with Nipponbarre (Fig. 2). Further, qualitatively, most of the patterns of opposite differential expression of the ten transcripts are maintained in most of the cultivars. There are a few exceptions. Despite both belonging to the O. sativa ssp. japonica, the Nipponbare data are most often contradicted by the Taipei309 for these oppositely differ-entially regulated transcripts. The O. sativa ssp. indica
cultivar IR24 also does not share the same pattern of differential expression as Nipponbare. Rather than the opposite differential regulation observed in Nipponbare, the following probes show similar differential regulation for TP309: TR071609 (targeting Os07g05610.2 and -.3) and
TR071454 (targetingOs04g41100.1through -.5), for TP309
and IR24: TR039213 (targetingOs03g01750.3and-.7), and for IR24: TR036809 (targeting Os02g26700.3). In the
absence of other data, inconsistencies between cultivars reduce interest in these particular splicing events. On the other hand, it is also possible that as with all microarray experiments, inconsistencies may be due to slight differences in experimental conditions or processes of preparing cDNA for the array experiments.
Validation of alternative splicing indicated by the NSF45K array
To verify that alternative splicing can be accurately detected with the NSF45K array, we selected four loci with a false discovery rate (FDR; adjusted p value) of the primary transcripts that was less than 0.01 and with consistent differential expression patterns among the four analyzed rice varieties. We conducted a more in-depth analysis using RT-PCR to validate the differential expression of these four loci. Figures 4a and 5a show results for light-induced transcripts. Figure 3a shows results for Os01g63270.1
and -.2, which code for the H isozyme of alpha-glucan
phosphorylase, which phosphorylates α-glucan substrates such as maltodextrin and starch into glucose-1-phosphate [30]. Probe TR070452 reveals light-induced gene expres-sion of the sum of Os01g63270.1 and -.2, whereas probe
TR034207 shows only moderate light induction of the lowly expressed Os01g63270.2. This implies more
signif-icant light induction of Os01g63270.1. We also examined the expression patterns of the two splice forms with RT-PCR assays on the RNA isolated from the four varieties of rice. RT-PCR results confirm that Os01g63270.1 is the dominant transcript of this locus in the light. Moreover, both splice forms accumulate to higher levels in the light vs. dark, in support of the array data. As shown in Fig.4a, Table 1 Signal Distribution of Alternative Transcripts in the NSF45K Light vs. Dark Experiment
Primary oligoa Number of alternative oligos in each log2-valueb
Conditions of upregulation
# of loci # of alternative oligos
>1.0 0.5 to 1 0.1 to 0.5 0.1 to−0.1 (−0.1) to (−0.5) −0.5 to (−1.0) <(−1.0)
Light (log2>1) 243 282 160 46 55 13 7 1 0
Dark (log2<−1) 264 349 2 9 25 37 68 79 129
Analysis of potential alternatively spliced loci for which at least one oligo (i.e., transcript) showed a twofold change in expression (|log2(light/ dark)|≥1)
a
The primary oligo was set as the probe for each locus that showed the highest absolute fluorescence on the array
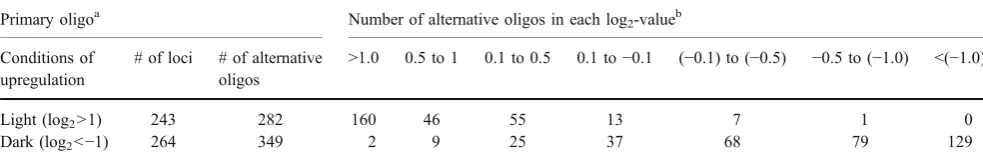
RT-PCR also provides independent experimental support of light-induced gene expression of alternatively spliced tran-scripts for locus Os02g41860, which encodes the aqua-porin, PIP2.2.
Figures 4b and 5b show results for transcripts with higher expression in the dark compared with the light. Figure 3b shows results for the three predicted splice variants of Os01g14100, which code for a protein in the folate/biopterin transporter family [2]. Probe TR070173 hybridizes to all three transcripts (Os01g14100.1,-.2, and-.3),
whereas probe TR030998 identifies only one transcript (Os01g14100.3; Fig. 3B). The first two putative forms differ only in the positions of their translation start codon but have the same RNA structure. Probe TR070173 indicates that there is differential expression of the sum of the three transcripts. However, probe TR030998 suggests that Os01g14100.3 is expressed at low levels and not significantly differentially regulated (Fig. 3b). These data suggest that dark induction of this locus is due to increased accumulation of Os01g14100.1 and -.2. Our RT-PCR
Fig. 2 Alternatively spliced transcripts that show opposite differential regulation compared to the primary transcript when treated by light compared with dark. Expression patterns of alternatively spliced transcripts for ten loci as indicated by 35 oligos. Log2 (light/dark) indicates the average ratio of log2transformed spot intensities in the light divided by intensities in the dark for two technical replicates from four varieties (Nipponbare, IR24, Kitaake, and Taipei 309). Intensity in light_andIntensity in dark_followed by the cultivar name indicates the average normalized spot intensity for each cultivar in the light or dark, respectively (see“Methods”).Red boxesdemarcate the data generated for Nipponbare.Light blue linesseparate different gene
results corroborate that the sum of the splice forms is significantly induced in the dark, except in IR24 in which it may be only slightly dark induced. With a high number of PCR cycles, we were able to observe that the third splice form (Os01g14100.3) also shows slight induction in the
dark, except in IR24, in which we could not detect expression. Dark-induced expression of two alternative transcripts ofOs01g15020, which encodes a lissencephaly type-1-like homology motif containing protein, was also validated by RT-PCR (Fig.4b).
Our in-depth analysis for four loci, two shown in Fig.3 and two in Fig.4, indicates that the differential regulation of alternatively spliced transcripts can be revealed with the NSF45K array with the specifically designed oligos included on the array, especially for moderate to highly expressed loci. These analyses provide independent
exper-imental support for the strategy of examining alternative splicing in rice microarray data.
Oppositely regulated alternative transcripts in rice treated with Magnaporthe griseameasured by Affymetrix microarray
We have also used Affymetrix rice array data to find evidence of and examine trends in rice alternative splicing. That array platform was designed to increase genome coverage by targeting multiple gene models from single loci based on TIGR/RGAP annotation. We identified 994 loci the alternative splicing of which can be examined with 2,519 probes on the rice Affymetrix microarray (data not shown). Thus, 16% (994/6,371) of predicted alternative splice forms can be detected using the Affymetrix array. Fig. 3 Examples of alternatively spliced transcripts represented by
two oligos on the NSF45K array.aExample of alternative splicing for light-induced transcripts,Os01g63270.1andOs01g63270.2.b Exam-ple of alternative splicing for dark-induced transcripts,Os01g14100.1, Os01g14100.2, andOs01g14100.3. Theleft panelsofaandbshow the primary structures of the TIGR/RGAP version 5 gene models for the two tested loci. The positions of the NSF45K array oligos, TR070452 (a), TR034207 (a), TR030998 (b), and TR070173 (b), are indicated as dark triangles. Arrows indicate the positions and directions of primers used,light blue boxes indicate exons, and the lines between the boxes indicate introns.Scale bar is 0.5 kb. The center panels display light vs. dark NSF45K microarray data. Oligo_idon thex-axis indicates the name of NSF45K oligo;transcript
Due to the importance of abiotic and biotic stresses for rice production, we decided to focus on stress response data sets. With the Affymetrix array a single study, that of Ribot and colleagues, examines the response of Nipponbare to treatment by the fungal pathogen, M. grisea [28]. This study compares Nipponbare leaf gene expression 3 or 4 days after inoculation withM. griseacompared to a mock inoculation with a gelatin solution. Within this dataset, 560 loci (56% of 994) exhibit evidence of alternative splicing. For this analysis, we have included only transcripts with log2(spot intensity)-values >6 (i.e., >64 spot intensity), as rice Affymetrix array data with lower intensities are not consistent with other measures of gene expression [4]. For the 560 loci, the signal associated with the alternative splice forms is greater than or equal to twofold different from the primary transcript.
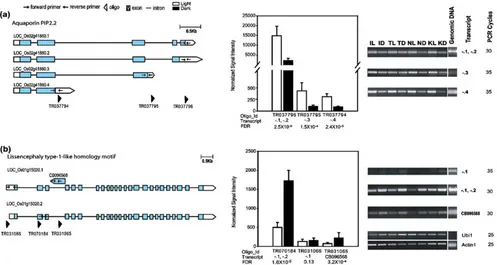
When challenged by fungal pathogen, alternative tran-scripts for nine of 560 loci (1.6% of loci with ≥64 spot intensity) clearly display opposite differential regulation relative to the primary transcript (Fig. 5). Array data for Fig.5are in Table S3. Of the nine oppositely differentially regulated loci, primary transcripts for five loci are induced at least twofold (log2>1.0) at 3 or 4 days postinoculation (dpi) while secondary transcripts for these loci are repressed more than twofold (log2<−1.0; Fig. 5). Primary transcripts in four other loci exhibit at least twofold (log2<−1.0) repression at 3 or 4 dpi, while secondary transcripts for
these loci are more than twofold induced (log2<−1.0; Fig. 5). One of the most striking examples of opposite differential regulation at 3 and 4 dpi is represented by the two alternative splice forms of Os08g34580.1 and -.2,
which encode trehalose-6-phosphate synthase (Fig.5). Understanding transcriptional regulation of alternatively spliced transcripts carrying opposite expression patterns may elucidate mechanisms of the rice defense response. Of the alternatively spliced transcripts displayed in Fig. 5, there is a transcription factor (Os08g43334) that displays opposite expression patterns in M. grisea treatments.
Os08g43334.1 and -.2 are predicted to encode an HSF-type DNA-binding domain containing protein. Of these,
Os08g43334.2 showed induced expression patterns in leaves treated with M. grisea, and the expression of
Os08g43334.1 increased in control leaves in gelatin solution (Fig. 5; Table S3). These data indicate that the responses of rice exposed to pathogen treatment such asM. grisea may be oppositely transcriptionally regulated by alternatively spliced transcripts of the Os08g43334gene.
In addition, we identified one locus, Os05g28960, the two splice variants of which exhibit opposite differential expression both in the NSF45K light vs. dark data, and the AffymetrixM. griseavs. mock data (Figs. 2and3). In the light vs. dark NSF45K array data,Os05g28960.2is induced in light and Os05g28960.1 is repressed in light (Fig. 2). Similarly in the Affymetrix M. grisea treatment data, Fig. 4 Examples of alternatively spliced transcripts represented by
three oligos on the NSF45K array.aAlternatively spliced transcripts for aquaporin PIP2.2 (Os02g41860). b Alternatively spliced
Os05g28960.2 is induced at 4 dpi and Os05g28960.1 is reduced relative to mock. The identification of opposite differential expression patterns in the same locus from both NSF45K and Affymetrix array platforms emphasizes the utility of current rice array data for studying alternative splicing events and provides independent experimental verification of both data sets.
Discussion
We have analyzed two Nipponbare rice microarray data sets for evidence of alternative splicing. Our analysis of NSF45K rice array data generated for seedlings treated by light vs. dark andM. griseavs. mock Affymetrix array data suggests that a large fraction, about half, of predicted splice variants are supported by microarray expression studies of leaf tissue. However, in the datasets that we examined, only a small fraction, approximately 1–2%, of expressed alternative splice forms are regulated oppositely compared
to the primary splice form for the locus. For comparison, an examination of alternative splicing in a leukemia-derived human T-cell line revealed that 10–15% of assayed genes exhibit >10% change in inclusion of alternative exons during activation [8]. Thus, differential accumulation of alternative splice forms may be more common in humans than rice (and likely other grasses) but is still infrequent. Due to the incomplete and complex nature of the rice microarray data, experiments with plant exon arrays would be necessary to thoroughly explore this comparison.
Within the two datasets, we identified a total of 18 loci, the transcripts of which show opposite differential accu-mulation due to pathogen vs. control or dark vs. light treatments. What might be the function of these alternative splicing events? Alternative splicing has been shown to modulate protein function in plants. For example, alterna-tive splicing of theArabidopsis Rubisco activasetranscripts affects the activity of the resulting proteins in regulating Rubisco in vitro [6, 36]. Function-changing alternative splicing has also been observed in rice. TheOsPex5pgene Fig. 5 Identification of alternatively spliced transcripts that show
opposite differential regulation relative to the primary transcript when inoculated by M. grisea from Affymetrix rice array data [29]. Expression patterns of alternatively spliced transcripts for nine loci as indicated by 18 oligo probe sets. Thered–green columnsindicate the differential expression of each oligo set for treatment with M. griseaover control.Log2_FR13/MOCK_3d_Nipponbareindicates the log2 transformed ratio of spot intensity in FR13 3 dpi over spot intensity in Mock 3 dpi, and Log2_FR13/MOCK_4d_Nipponbare indicates the log2transformed ratio of spot intensity in FR13 4 dpi over spot intensity in Mock 4 dpi. Theblue–yellow columnsindicate
codes for a rice peroxisomal protein receptor and has two alternatively spliced isoforms (OsPex5pL and OsPex5pS) with slightly different functions [19]. In addition, studies in plants have shown that variation in UTR length or structure lead to changes in mRNA accumulation as well as the association of mRNAs with ribosomes [15]. Of the ten oppositely differentially expressed loci identified in the light vs. dark study, five are predicted to have relatively major effects on the amino acid sequence of the encoded protein, including or excluding large proteins segments, while four have more moderate effects on protein structure, changing small protein-coding exons toward the ends of the genes (Figure S1). Two of the five loci with major changes in protein coding sequence due to alternative splicing are predicted to have entirely different protein coding sequen-ces; thus, these might actually represent misannotation of separate genes. On the other hand, all of these splicing events modify the encoded UTRs, with major differences in mRNA UTRs resulting from alternative splicing of the transcripts for eight of ten loci. Though experimental verification is certainly called for, we speculate that for plants, the major function of alternative splicing may be to change UTR sequence to modify mRNA stability and/or translational efficiency. Two examples are explored to greater depth below.
We found that one of the rare loci exhibiting opposite differential expression between splice forms was common between the two data sets. The locus, Os05g28960, is predicted to encode anacyltransferase gene(Os05g28960). The two predicted splice forms differ in the 3′-most protein coding sequence (NNSLPRALHQKDD vs. LLCQS, re-spectively) as well as having entirely different 3′-UTRs (Figure S1). Thus, alternative splicing may modify the stability of the transcript but is unlikely to significantly affect the function of the encoded protein. AnArabidopsis
glycerol-3-phophate acyltransferase, with homology to this rice acyltransferase, has recently been shown to be important for generating the culticular ledge between guard cells, which consist mostly of cutin [22]. Based on this homology and the induction of the primary, more highly expressed Os05g28960.1 in the dark, we hypothesize that this putative acyltransferase also has a role in developing the cuticular ledge for stomatal closure.M. griseais known to target stomata as a site for plant entry or break the formidable physical barrier of the host plant cuticle [32]. Suppression ofOs05g28960.1 at 4 dpi might indicate that this gene is a target of the pathogenic fungus (Fig.5). The alternative splice form may avoid fungal repression.
In addition, we identified that two transcripts of
Os07g47100, which encodes a putative sodium hydrogen exchanger 3 family protein, show opposite differential expression in response to light. Members of this gene family have roles in maintaining low concentrations of Na+
in the cytoplasm [27].Os07g47100.2does not splice out an intron that is present in the 5′UTR of Os07g47100.1.
Recentlystress-responsive NAC 2(SNAC2)-overexpressing rice plants have been found to possess enhanced tolerances to drought and cold. Affymetrix microarray data show that
Os07g47100 accumulates in SNAC2-overexpressing rice plants under both normal and cold stress conditions [7]. To our knowledge, the role and regulation of alternatively spliced forms for this gene have not been explored. We hypothesize that alternative splicing of the 5′UTRs of this gene may modulate differential expression patterns. Further characterization of these and other identified oppositely regulated alternative transcripts is likely to reveal new mechanisms of plant responses to light and biotic stress.
In conclusion, our results indicate that alternatively spliced transcripts can be effectively identified using publicly available rice microarray data. At the time of this study, 16 hybridizations for eight treatments using the rice NSF45K array (http://www.ncbi.nlm.nih.gov/projects/geo/ query/acc.cgi?acc=GSE8261) and 230 hybridizations for 90 treatments using the rice Affymetrix array were publicly available (http://www.ncbi.nlm.nih.gov/geo/query/acc.cgi? acc=GPL2025), representing an abundant data source for analysis of alternative splicing under various conditions. Exploration of the oppositely regulated alternative transcripts may reveal significant posttranscriptional modulation of mRNA accumulation and/or protein abundance and the function of the encoded proteins. Such studies will help to address fundamental questions as to the evolutionary selective basis for alternative splicing in rice and other plants.
Methods
Design of the NSF45K microarray
the design of 43,311 oligonucleotide probes that target 45,116 gene models out of a total of 61,420 target transcript sequences in the TIGR/RGAP V3 rice gene set release. These oligos were recently mapped to 37,828 loci and target 46,303 gene models in the TIGR/RGAP V5 rice gene set release. There are 10,113 annotated alternative splice forms (gene models) for 41,046 nontransposable element-related gene loci in rice and 3,430 of these from 1,583 loci can be differentiated by combining unique and shared oligos. Of these 1,583 loci, only four loci lack expression evidence, such as one or more FL-cDNA or EST. For 219 loci, one or more of the predicted gene models lack expression evidence. Gene expression data for these loci are collected in the sheet“incomplete expression evidence” of Table S1. Information about the array platform design has been deposited at the NCBI Gene Expression Omnibus (GEO,http://www.ncbi.nlm.nih.gov/geo/) under the acces-sion numbers GPL4105 and GPL4106.
Microarray data processing and normalization
Spot intensities were quantified using Axon GenePix Pro 4.0 image analysis software. Afterwards, GenePix Pro 4.0 result data files (.gpr files) were generated using high photomultiplier tube (PMT) and low PMT settings. For high PMT, we normalized replicated data to minimize the variations caused by experimental procedures using the Lowess normalization method in the LMGene Package in R [3, 29]. We further normalized for signal intensity among different experiments using averages of all the gene signals obtained during individual experiments. In addition, we estimated the background “expression”level based on the signal associated with the hygromycin resistance gene from the binary vector pCAMBIA-1305, hph (GenBank acces-sion no. AF354045), included on the array as a negative control and evenly spotted throughout the slides. From eight hybridizations of four biological replicates, we detected an average normalized spot intensity for thehph
oligos of 220±30. We then generated average normalized spot intensities following a common strategy by subtracting average hph intensity (220) and adding 2 standard devia-tions (60) of the average normalized hph intensity. A normalized spot intensity value of ≥120 was considered to be a meaningful expression level in Table S1. To identify differentially expressed genes, we used the method in LMGene [13, 14]. FDRs and fold changes of light over dark were generated and the data within 10−4 FDR are represented in Table S1. The expression data from these experiments are available through GEO (accession no. GSE8261) [13,14].
The Affymetrix raw data was downloaded from NCBI GEO (platform accession number is GPL2025; series accession number is GSE7256) [28]. We used the MAS 5.0 method provided by R package for Affymetrix rice array to convert probe level data to expression values [1]. The trimmed mean target intensity of each array was arbitrarily set to 500, and the data were log2transformed. Analysis of alternative splicing evidence in Affymetrix array data required mapping of Affymetrix probes to the current rice genome annotation. This work was conducted by the NSF Rice Oligonucleotide Array Project team, which developed detailed oligo mapping information for the Affymetrix, BGI/Yale, Agilent, and NSF45K arrays in the Rice Multi-platform Microarrary Search (http://www. ricearray.org/matrix.search.shtml) [12,13].
Analysis of alternatively spliced transcript
We identified gene loci with at lest two oligos and then excluded oligos that target the same gene model (i.e., a single transcript). The list of 1,583 gene loci and related gene expression data are presented in Table S1. Then, we selected genes showing at least a twofold change in expression in the light or dark and further analyzed the distribution of log2 fold change for the other oligo(s) for each gene locus, as shown in Table 1.
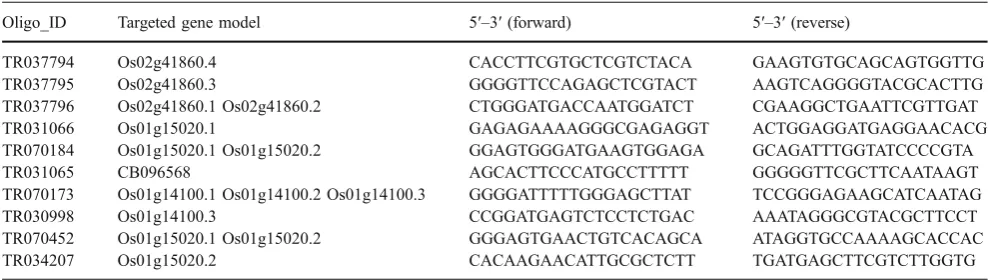
Table 2 Primers for Alternative Transcripts Represented in Figs.3and4
Oligo_ID Targeted gene model 5′–3′(forward) 5′–3′(reverse)
TR037794 Os02g41860.4 CACCTTCGTGCTCGTCTACA GAAGTGTGCAGCAGTGGTTG
TR037795 Os02g41860.3 GGGGTTCCAGAGCTCGTACT AAGTCAGGGGTACGCACTTG
TR037796 Os02g41860.1 Os02g41860.2 CTGGGATGACCAATGGATCT CGAAGGCTGAATTCGTTGAT
TR031066 Os01g15020.1 GAGAGAAAAGGGCGAGAGGT ACTGGAGGATGAGGAACACG
TR070184 Os01g15020.1 Os01g15020.2 GGAGTGGGATGAAGTGGAGA GCAGATTTGGTATCCCCGTA
TR031065 CB096568 AGCACTTCCCATGCCTTTTT GGGGGTTCGCTTCAATAAGT
TR070173 Os01g14100.1 Os01g14100.2 Os01g14100.3 GGGGATTTTTGGGAGCTTAT TCCGGGAGAAGCATCAATAG
TR030998 Os01g14100.3 CCGGATGAGTCTCCTCTGAC AAATAGGGCGTACGCTTCCT
TR070452 Os01g15020.1 Os01g15020.2 GGGAGTGAACTGTCACAGCA ATAGGTGCCAAAAGCACCAC
Validation of expression patterns of candidate genes using RT-PCR
For the first-strand cDNA synthesis, 100 ng of mRNAs from the same RNA samples used for the microarray experiments was reverse-transcribed in a total volume of 50 μl that contained 10 ng of oligo (dT)12–18 primer, 2.5 mM dNTP, and 100 units of SuperScript™III reverse transcriptase (Invitrogen, Carlsbad, CA, USA) in reaction buffer supplied by the manufacturer. PCR reactions were performed in 50 μl volumes in solutions containing 1 μl aliquots of the respective cDNA reaction mixture, 0.2μM of gene-specific primers, 10 mM dNTPs, one unit of Taq DNA polymerase (Invitrogen), and 10× Taq buffer supplied by the manufacturer. PCR amplifications with genomic DNAs were carried out as a means of checking the functionality of primers. Each reaction included an initial 5-min denaturation at 94°C, followed by 21 to 38 cycles of PCR (94°C, 45 min; 60°C, 45 min; 72°C, 1 min), and a final 10 min at 72°C. Afterward, 20μl of each reaction mixture was separated on a 1.2% agarose gel. The primers used for RT-PCR are described in Table 2. Actin 1 (Os03g50890; NCBI accession number OSJNBa0078A17.12) and Ubq1
(Os03g13170; NCBI accession number OJ1175C11.2) were used as controls for RT-PCR [11].
Acknowledgments We thank Dr. Shu Ouyang, Dr. Hui-Hsien Chou, and Dr. C. Robin Buell for designing NSF45K oligo array and developing a database for this array. We also thank Dr. Gynheung An for helpful discussions. This research was funded in part by a competitive grant from the National Science Foundation Plant Genome Program (award: #DBI0313887 to P.C.R.), a USDA grant (# 2004-35604-14226 to P.C.R.), an NIH grant (#5R01GM055962-0 to P.C.R.), a Korea Research Foundation grant (KRF-2005-C00155 to K.H.J.), and the Hatch Act and State of Iowa funds to P.C.R. L.E.B. was supported in part by a University of California President’s Postdoctoral Fellowship.
References
1. Affymetrix. Statistical algorithms description document. Santa Clara, CA: Affymetrix; 2002.
2. Bedhomme M, Hoffmann M, McCarthy EA, Gambonnet B, Moran RG, Rebeille F, Ravanel S. Folate metabolism in plants: an Arabidopsis homolog of the mammalian mitochondrial folate transporter mediates folate import into chloroplasts. J Biol Chem 2005;280:34823–31.
3. Berger JA, Hautaniemi S, Jarvinen AK, Edgren H, Mitra SK, Astola J. Optimized LOWESS normalization parameter selection for DNA microarray data. BMC Bioinformatics 2004;5:194. 4. Cao PJ, Bartley LE, Jung KH, Ronald PC. Construction of a rice
glycosyltransferase phylogenomic database and identification of rice-diverged glycosyltransferases. Mol Plant 2008;1:858–77. 5. Chou HH, Hsia AP, Mooney DL, Schnable PS. Picky: oligo
microarray design for large genomes. Bioinformatics 2004;20: 2893–902.
6. Eckardt NA. Alternative splicing and the control of flowering time. Plant Cell 2002;14:743–7.
7. Hu H, You J, Fang Y, Zhu X, Qi Z, Xiong L. Characterization of transcription factor gene SNAC2 conferring cold and salt tolerance in rice. Plant Mol Biol 2008;67:169–81.
8. Ip JY, Tong A, Pan Q, Topp JD, Blencowe BJ, Lynch KW. Global analysis of alternative splicing during T-cell activation. Rna 2007;13:563–72.
9. IRGSP. The map-based sequence of the rice genome. Nature 2005;436:793–800.
10. Johnson JM, Castle J, Garrett-Engele P, Kan Z, Loerch PM, Armour CD, Santos R, Schadt EE, Stoughton R, Shoemaker DD. Genome-wide survey of human alternative pre-mRNA splicing with exon junction microarrays. Science 2003;302:2141–4. 11. Jung KH, Han MJ, Lee DY, Lee YS, Schreiber L, Franke R, Faust
A, Yephremov A, Saedler H, Kim YW, Hwang I, An G. Wax-deficient anther1 is involved in cuticle and wax production in rice anther walls and is required for pollen development. Plant Cell 2006;18:3015–32.
12. Jung KH, An G, Ronald PC. Towards a better bowl of rice: assigning function to tens of thousands of rice genes. Nat Rev Genet 2008;9:91–101.
13. Jung KH, Dardick C, Bartley LE, Cao P, Phetsom J, Canlas P, Seo YS, Shultz M, Ouyang S, Yuan Q, Frank BC, Ly E, Zheng L, Jia Y, Hsia AP, An K, Chou HH, Rocke D, Lee GC, Schnable PS, An G, Buell CR, Ronald PC. Refinement of light-responsive transcript lists using rice oligonucleotide arrays: evaluation of gene-redundancy. PLoS ONE 2008;3:e3337.
14. Jung KH, Lee J, Dardick C, Seo YS, Cao P, Canlas P, Phetsom J, Xu X, Ouyang S, An K, Cho YJ, Lee GC, Lee Y, An G, Ronald PC. Identification and functional analysis of light-responsive unique genes and gene family members in rice. PLoS Genet 2008;4:e1000164.
15. Kawaguchi R, Bailey-Serres J. mRNA sequence features that contribute to translational regulation in Arabidopsis. Nucleic Acids Res 2005;33:955–65.
16. Kellogg EA. Evolutionary history of the grasses. Plant Physiol 2001;125:1198–205.
17. Kikuchi S, Satoh K, Nagata T, Kawagashira N, Doi K, Kishimoto N, Yazaki J, Ishikawa M, Yamada H, Ooka H, Hotta I, Kojima K, Namiki T, Ohneda E, Yahagi W, Suzuki K, Li CJ, Ohtsuki K, Shishiki T, Otomo Y, Murakami K, Iida Y, Sugano S, Fujimura T, Suzuki Y, Tsunoda Y, Kurosaki T, Kodama T, Masuda H, Kobayashi M, Xie Q, Lu M, Narikawa R, Sugiyama A, Mizuno K, Yokomizo S, Niikura J, Ikeda R, Ishibiki J, Kawamata M, Yoshimura A, Miura J, Kusumegi T, Oka M, Ryu R, Ueda M, Matsubara K, Kawai J, Carninci P, Adachi J, Aizawa K, Arakawa T, Fukuda S, Hara A, Hashizume W, Hayatsu N, Imotani K, Ishii Y, Itoh M, Kagawa I, Kondo S, Konno H, Miyazaki A, Osato N, Ota Y, Saito R, Sasaki D, Sato K, Shibata K, Shinagawa A, Shiraki T, Yoshino M, Hayashizaki Y, Yasunishi A. Collection, mapping, and annotation of over 28,000 cDNA clones from japonica rice. Science 2003;301:376–9.
18. Krawczak M, Reiss J, Cooper DN. The mutational spectrum of single base-pair substitutions in mRNA splice junctions of human genes: causes and consequences. Hum Genet 1992;90:41–54. 19. Lee JR, Park SC, Kim MH, Jung JH, Shin MR, Lee DH, Cheon
MG, Park Y, Hahm KS, Lee SY. Antifungal activity of rice Pex5p, a receptor for peroxisomal matrix proteins. Biochem Biophys Res Commun 2007;359:941–6.
20. Li L, Wang X, Stolc V, Li X, Zhang D, Su N, Tongprasit W, Li S, Cheng Z, Wang J, Deng XW. Genome-wide transcription analyses in rice using tiling microarrays. Nat Genet 2006;38:124–9. 21. Li L, Wang X, Sasidharan R, Stolc V, Deng W, He H, Korbel J,
X. Global identification and characterization of transcriptionally active regions in the rice genome. PLoS ONE 2007;2:e294. 22. Li Y, Beisson F, Koo AJ, Molina I, Pollard M, Ohlrogge J.
Identification of acyltransferases required for cutin biosynthesis and production of cutin with suberin-like monomers. Proc Natl Acad Sci USA 2007;104:18339–44.
23. Ma L, Chen C, Liu X, Jiao Y, Su N, Li L, Wang X, Cao M, Sun N, Zhang X, Bao J, Li J, Pedersen S, Bolund L, Zhao H, Yuan L, Wong GK, Wang J, Deng XW, Wang J. A microarray analysis of the rice transcriptome and its comparison toArabidopsis. Genome Res 2005;15:1274–83.
24. Ner-Gaon H, Fluhr R. Whole-genome microarray inArabidopsis facilitates global analysis of retained introns. DNA Res 2006;13:111–21.
25. Nobuta K, Venu RC, Lu C, Belo A, Vemaraju K, Kulkarni K, Wang W, Pillay M, Green PJ, Wang GL, Meyers BC. An expression atlas of rice mRNAs and small RNAs. Nat Biotechnol 2007;25:473–7.
26. Pan Q, Saltzman AL, Kim YK, Misquitta C, Shai O, Maquat LE, Frey BJ, Blencowe BJ. Quantitative microarray profiling provides evidence against widespread coupling of alternative splicing with nonsense-mediated mRNA decay to control gene expression. Genes Dev 2006;20:153–8.
27. Pardo JM, Cubero B, Leidi EO, Quintero FJ. Alkali cation exchangers: roles in cellular homeostasis and stress tolerance. J Exp Bot 2006;57:1181–99.
28. Ribot C, Hirsch J, Balzergue S, Tharreau D, Notteghem JL, Lebrun MH, Morel JB. Susceptibility of rice to the blast fungus, Magnaporthe grisea. J Plant Physiol 2008;165:114–24.
29. Rocke DM. Design and analysis of experiments with high throughput biological assay data. Semin Cell Dev Biol 2004;15:703–13.
30. Schwarz A, Pierfederici FM, Nidetzky B. Catalytic mechanism of alpha-retaining glucosyl transfer by Corynebacterium callunae starch phosphorylase: the role of histidine-334 examined through kinetic characterization of site-directed mutants. Biochem J 2005;387:437–45.
31. Shoemaker DD, Schadt EE, Armour CD, He YD, Garrett-Engele P, McDonagh PD, Loerch PM, Leonardson A, Lum PY, Cavet G, Wu LF, Altschuler SJ, Edwards S, King J, Tsang JS, Schimmack G, Schelter JM, Koch J, Ziman M, Marton MJ, Li B, Cundiff P, Ward T, Castle J, Krolewski M, Meyer MR, Mao M, Burchard J, Kidd MJ, Dai H, Phillips JW, Linsley PS, Stoughton R, Scherer S, Boguski MS. Experimental annotation of the human genome using microarray technology. Nature 2001; 409:922–7.
32. Thines E, Anke H, Weber RW. Fungal secondary metabolites as inhibitors of infection-related morphogenesis in phytopathogenic fungi. Mycol Res 2004;108:14–25.
33. Walia H, Wilson C, Condamine P, Liu X, Ismail AM, Zeng L, Wanamaker SI, Mandal J, Xu J, Cui X, Close TJ. Comparative transcriptional profiling of two contrasting rice genotypes under salinity stress during the vegetative growth stage. Plant Physiol 2005;139:822–35.
34. Wang BB, Brendel V. Genomewide comparative analysis of alterna-tive splicing in plants. Proc Natl Acad Sci USA 2006;103:7175–80. 35. Yuan Q, Ouyang S, Wang A, Zhu W, Maiti R, Lin H, Hamilton J,
Haas B, Sultana R, Cheung F, Wortman J, Buell CR. The institute for genomic research Osa1 rice genome annotation database. Plant Physiol 2005;138:18–26.