O R I G I N A L A R T I C L E
Solute diffusion into cell walls in solution-impregnated wood
under conditioning process II: effect of solution concentration
on solute diffusion
Soichi Tanaka1•Masako Seki2•Tsunehisa Miki2•Ichinori Shigematsu2• Kozo Kanayama1
Received: 7 August 2015 / Accepted: 13 January 2016 / Published online: 22 February 2016
The Japan Wood Research Society 2016
Abstract This study focused on solute diffusing into cell walls in solution-impregnated wood during conditioning, process of moderate drying of solvent. To clarify the effect of solution concentration on the diffusion during the con-ditioning, weight percent gain (WPG) and relative swelling of the wood sample impregnated with an aqueous solution of polyethylene glycol (PEG) polymers at a concentration of 10, 20, 30, 40, or 50 mass% were examined during the conditioning and subsequent drying processes. The relation between the concentration and the relative swelling after all processes, an indicator of the amount of the polymers in cell walls, exhibited a concave-downward curve with a maximum value at 20 mass%. The estimated mass of the polymers in cell walls just before conditioning increased with the concentration. This indicates that the distribution of the polymers changed during conditioning. The esti-mated mass just before conditioning and the relative swelling after all processes were normalized to the packing ratios of the polymers in cell walls. The ratio after all processes subtracted by that just before conditioning was larger than the ratio just before conditioning, and increased with the concentration up to 20 mass%; after which it decreased. This indicates that the majority of the polymers in cell walls increased during conditioning, and that the
amount of the polymers that diffused into cell walls was at the maximum at concentration of 20 mass%. This was explained by two factors: the decrease in the diffusivity into cell walls and in the concentration difference of the polymers between cell walls and cell cavity with the con-centration, based on the behavior of WPG during condi-tioning; and the estimated minimum concentration at which the solution contains the least amount of polymers to fill the cell walls.
Keywords Impregnated woodConditioning Relative humiditySolute diffusion Solution concentration
Introduction
Wood is chemically treated to control its physical proper-ties, such as its dimensional stability and mechanical properties [1]. The chemical treatment here refers to treatment that does not destroy the crystalline structure of the cellulosic microfibrils in wood cell walls [2]. In such a treatment, the physical properties of wood are controlled by manipulation of the hydroxyl groups and surrounding chemical bonds. The treatment is classified into several types, including heat treatment, acetalization, esterification, etherification, formations of wood-plastic composite (WPC) and wood-inorganic composite (WIC), and treat-ments with phenol formaldehyde resin, polyethylene glycol (PEG), etc. [2]. All these types of treatments involve either effect of crosslinking, hydrophobic, or bulking, or the combination of these effects. The bulking effect is espe-cially important because it contributes to the majority of chemical treatments, except heat treatment and formalization.
Part of this report was presented at the International Symposium on Wood Science and Technology 2015, Tokyo, March 2015.
& Soichi Tanaka
1 Research Institute for Sustainable Humanosphere, Kyoto
University, Uji 611-0011, Japan
2 Structural Materials Research Institute, National Institute of
Advanced Industrial Science and Technology, Nagoya 463-8560, Japan
The bulking effect prevents intrusion of water into the amorphous region by introducing the bulking agent into the region and swelling it. When the chemical substance is hydrophobic, solid, has high viscosity, or has high molec-ular weight, however, the substance itself may not easily impregnate into the amorphous region. In such cases, the chemicals are often dissolved in a solvent with a high ability to swell the amorphous region. The solvent is usu-ally removed once the impregnation is completed. Both the solvent and the substance are present in the amorphous region, and thus after the solvent is removed, the region contains space that can absorb water. To treat wood com-pletely with the chemical substance, this space has to be also filled with the substance. Therefore, we focused on the mechanism whereby a non-volatile substance diffuses into cell walls during the conditioning, or process of moderate drying of solvent, of wood impregnated with a solution of the substance, as suggested by Stamm [3].
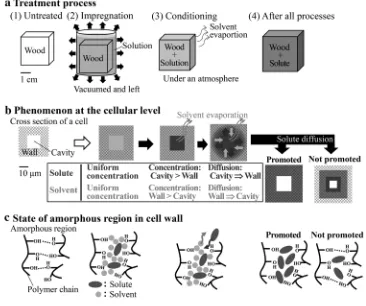
Figure1a–c show the treatment process including impregnation and conditioning, the phenomena at the cel-lular level during the process [3], and the state of the amorphous region during the process, respectively. For impregnation (Fig.1a), the wood is soaked in a solution of a non-volatile chemical substance (solute), then placed under a vacuum (or subjected to pressure) while in contact with the treatment solution. For conditioning (Fig.1a), the
impregnated wood is placed under an atmosphere. For both processes, migration of the solute and solvent occurs at the cellular level (Fig.1b):
• During impregnation, the solution uniformly permeates the cell walls and cell cavities.
• During conditioning, a greater amount of solvent evaporates from the cell cavities than from the cell walls, which increases the concentration of solute in the cavities compared to the walls. This concentration difference causes the solute to diffuse from the cavities to the walls [3].
The solute permeability during impregnation has been studied by many researchers using PEG polymer as a solute [3–14], which was summarized in our previous paper [15]. The mechanism of a solute diffusing into cell walls during conditioning has, however, never been verified. The amount of the solute in the cell walls will increase if the diffusion of the solute is promoted during the conditioning, but will not increase if the diffusion is not promoted (Fig.1b). The solute will fill the amorphous regions in the former case, while in the latter it will be present in only part of the regions (Fig. 1c). Therefore, there exists the possibility of maximizing the amount of the solute in the cell walls, or of filling the amorphous region with the solute more rapidly by optimizing the conditioning.
Fig. 1 aTreatment process,
The objective of this study is to determine the conditions that maximize the amount of the solute diffusing into the cell walls of solution-impregnated wood during the con-ditioning process in a short time. First, it is necessary to choose a method to evaluate the amount of the solute in the cell walls. Previous studies have shown that the mass and dimensions of wood samples impregnated with solution are related to the amount of the solute and solvent, if PEG and water are employed as the solute and solvent, respectively [3,4,9–13]. The solution is able to permeate the permanent pores, or cell cavities, and the transient pores in the amorphous region in the cell walls. The mass and dimen-sions of wood under treatment may increase with the total mass of the solution in the treated wood and the volume of solution in its transient pores, respectively. After the sol-vent is completely removed from the treated wood, its mass and dimensions increase with the mass of the solute in it and the volume of solute in its transient pores, respectively. Assuming that the solute itself has a constant density, the amount of the solute in the cell walls is estimated by the dimensions of the treated wood. The variation in mass of the impregnated wood under conditioning indicates evap-oration of the solvent. Second, it is necessary to predict the condition that affects the amount of the solute diffusing into the cell walls. This amount is directly determined by: • Concentration difference of the solute between the cell
walls and cell cavities. • Solute diffusivity.
These two factors are affected mainly by solution condi-tions such as concentration and type of solute and solvent, material conditions such as wood species and dimension, and atmospheric conditions such as temperature and vapor pressure of the solvent [or relative humidity (RH) when the solvent is water].
In our previous papers [15,16], focusing on the RH in the atmospheric conditions, the mass and dimensions of wood impregnated with an aqueous solution of PEG polymers with 30 mass% concentration were measured during conditioning at different RHs and after subsequent drying in a vacuum. It was verified that the polymers dif-fused into the cell walls and substituted water there during the conditioning, and that the amount of the diffused polymers was controlled by the RH, and was maximum at approximately RH=80 %. In this paper, we focused on the concentration in the solution condition. Previous stud-ies [3, 17] have reported that the amount of the PEG polymers increased with the concentration after all treat-ment processes. In these studies, however, the RH was not controlled [17] or the concentration was lower than 18 mass% [3], and there was no consideration regarding the effect of the concentration on the polymer diffusing into cell walls during conditioning. Since our previous study
[15, 16] showed that the concentration of the solution present in wood affected the diffusivity and concentration difference of the polymers, the amount of diffusion during conditioning may depend on the concentration of impreg-nated solution.
The purpose of this paper was to clarify the effect of concentration of impregnated solution on solute diffusing into cell walls during the conditioning process of impreg-nated wood. The PEG polymers and water were employed as the solute and solvent, respectively, because the dimensions and mass of the impregnated wood in this case reflect the amount of the polymers and water in it. The mass and dimensions of wood samples impregnated with aqueous solutions of PEG polymers at different concen-trations were examined during the conditioning and sub-sequent drying processes, and are discussed with respect to the water evaporation and the amount of the polymers in the cell walls. The mass and volume of the polymers in the cell walls just before conditioning and after all processes, respectively, were estimated and normalized to analyze the amount of the polymers diffusing into the cell walls during conditioning.
Materials and methods
Fifteen cross-cut wood samples, with dimensions of 5 mm925 mm925 mm in longitudinal (L), radial (R), and tangential (T) directions, respectively, were subse-quently prepared from a block of hinoki (Chamaecyparis obtusa). The samples were impregnated with deionized water and left in it for more than 2 weeks, and their mass and area in RT cross section (mAandsA, respectively) were
measured. They were then dried at 105C to relatively constant mass mO, their RT-cross-sectional area (sO) and
volume (vO) were measured, and their average oven-dry
density was estimated to be 0.289 g/cm3. The three dried samples were impregnated with an aqueous solution of PEG polymers (PEG1540, E.P., Wako) with density
qC =1.13 g/cm3and concentrationU=10, 20, 30, 40, or
50 mass%, and left in the solution to reach relatively constant mass and dimensions.
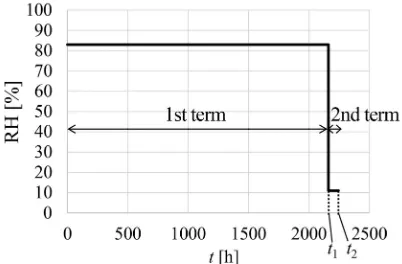
The impregnated samples were conditioned under an atmosphere at 35C with the RH controlled according to the two-term conditioning schedule (Fig. 2). The RH was controlled at 83 % during the 1st term for 2161 h (=t1)
using a supersaturated solution of potassium chloride (KCl) [18], and subsequently controlled at 11 % during the 2nd term for 84 h (=t2-t1) using a supersaturated solution of
swelling as a function of the time t (W(t), a(t), and r(t), respectively) were calculated as follows:
WðtÞ ¼100fmðtÞ mOg mO
½%; ð1Þ
aðtÞ ¼sðtÞ sO sO
; ð2Þ
rðtÞ ¼sðtÞ sO sAsO
: ð3Þ
The conditioned samples were dried at 35C in a vac-uum chamber with phosphorous pentoxide (P2O5), and then
the mass and RT-cross-sectional area (mVandsV,
respec-tively) were measured, and the swelling coefficient and relative swelling (aVandrV, respectively) were calculated
as follows:
aV¼ sVsO
sO
; ð4Þ
rV¼ sVsO sAsO
: ð5Þ
The data employed in the estimation in the Results and discussion section are summarized in Table1.
Results and discussion
WPG and relative swelling during conditioning
Figure3a shows the temporal variability of WPG (W) during conditioning with RH schedule according to Fig.2for the samples impregnated with different solution concentrations. In the 1st term, the value of W for each concentration decreased during 0–100 h reaching each constant value. In the 2nd term, the value decreased rapidly to be constant soon after the term begun. The decrease in WPG is due to the evaporation of water from the samples. Our previous studies [15,16] showed that water evaporates from the cell cavities much more readily than from the cell walls, which results in a higher concentration of the PEG polymers in the cell cavities than in the cell walls. Thus, the water evaporation shown in Fig.3a was thought to cause the concentration difference, which is the driving force behind the diffusion of the polymers into the cell walls. The values ofWat the equilibrium points of the 1st and 2nd terms increased with the solution concentration (U) (Fig.3a), which indicates that the samples impregnated with the solution with lower concentration had higher moisture content at the early stage of the conditioning.
Figure3b shows the temporal variability of relative swelling (r) during conditioning for different solution concentrations. At all concentrations, the samples swelled during the 1st term, while they shrunk during the 2nd term. The swelling and shrinkage are caused by the PEG poly-mers diffusing into the cell walls and the water exuding from the cell walls, respectively [15,16]. Thus, the diffu-sion of the polymers into the cell walls was promoted, especially during the 1st term.
Relative swelling at each stage of processes
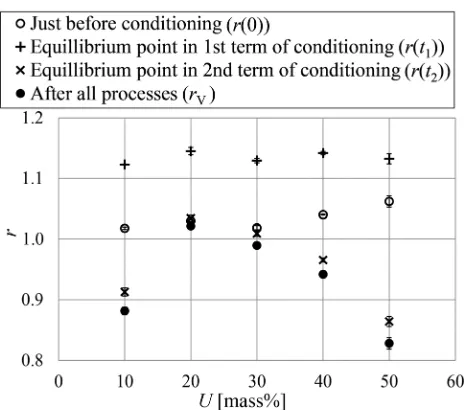
Figure4 shows the relation ofrtoUat each stage of the processes. The value of r increased slightly with U just
Fig. 2 Conditioning schedule for relative humidity (RH).t condition-ing time
Table 1 Data for the estimation Concentration of impregnated solution
Oven-dried samples before treatment
Samples just before conditioning Samples after all processes
U(mass%) MassmO(g) VolumevO(cm3) Swelling coefficient for RTbcross section a(0) (%)
MassmV(g)
10 0.859±0.002a 2.972±0.021 6.979±0.149 1.070±0.005
20 0.857±0.001 2.985±0.003 6.850±0.071 1.319±0.001
30 0.856±0.012 2.952±0.033 6.900±0.033 1.577±0.023
40 0.862±0.006 2.989±0.019 6.953±0.062 1.886±0.015
50 0.858±0.008 2.968±0.022 7.191±0.111 2.187±0.012
a Standard deviation
before the conditioning, and was constant for all values of Ujust after the 1st term. The relation ofrtoUexhibited a concave-downward curve with a maximum value of r at U=20 mass% just after the 2nd term and after all pro-cesses. The value ofrafter all processes is considered to be proportional to the amount of the PEG polymers in the cell walls, because the samples do not contain any water after drying in a vacuum with P2O5. These findings indicate that
the relation between the concentrationUand the amount of the polymers in the cell walls exhibits a concave-down-ward curve, with the maximum point at U=20 mass% after all processes. It was, however, unclear when the trend betweenUand the amount of the polymers in the cell walls develops. The contribution of drying in a vacuum with P2O5 to the diffusion of the polymers into cell walls
seemed to be small, because the relation ofrtoUafter all processes was similar to that just after the 2nd term (Fig.4). Thus, this trend was considered to occur during the impregnation and/or conditioning processes. To clarify which processes contributed to this trend, it was necessary to evaluate the amount of polymers in the cell walls just before conditioning.
Estimated amount of polymers in cell walls just before conditioning
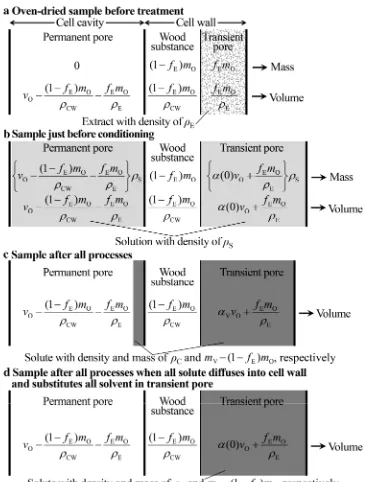
The mass of the PEG polymers in cell walls just before the conditioning [mW(0)] was estimated using the following
steps. Figure5a–c show the distribution of solution in wood for the untreated samples in the oven-dry condition, just before conditioning, and after all processes, respectively. The estimation was based on the following assumptions. 1. None of the polymers migrate between the sample and
surrounding atmosphere in the processes except during impregnation.
2. The extract with density of qEmigrates from the cell
walls into the solution during the impregnation, and the mass ratio of the migrated extract to the untreated sample in the oven-dry condition isfE. The values of qE and fE are equal to 1 g/cm
3
and 0.055 [19], respectively.
3. The concentration of the solution present in the cell cavity just before the conditioning is equal to that of the impregnated solution (U/100).
4. The densities of the water, PEG polymers, and extract remain constant regardless of their state or location. 5. The densities of the wood substance and water,qCWand
qM, are equal to 1.5 [20] and 1.0 g/cm3, respectively.
6. The volume of the cell cavity has a constant value of vOð1fEÞmO=qCWfEmO=qE over all processes (Fig.5a–c).
The mass of the PEG polymers in the sample was formu-lated as mVð1fEÞmO, based on assumptions 1 and 2.
Fig. 3 Temporal variability during conditioning inaweight percent gain (W) and b relative swelling (r) of samples impregnated with different concentrations of solution (U).Barsstandard deviations
Based on assumptions 3, 4, and 6, the mass of the poly-mers in the cell cavities was formulated as
vOð1fEÞmO=qCWfEmO=qE
f gqSU=100, where qS
represents the density of the solution. Using these formu-lae, mW(0) was formulated as mVð1fEÞmO
vOð1fEÞmO=qCWfEmO=qE
f gqSU=100. The
density qS was formulated as Eq. (10) (see ‘‘Appendix’’
section); accordingly, mW(0) was formulated as
follows:
mWð0Þ ¼mV ð1fEÞmO vO
ð1fEÞmO
qCW
fEmO
qE
UqCqM ð100UÞqCþUqM
:
ð6Þ
The value ofmW(0) for each solution concentrationUwas
estimated using Eq. (6), the values in Table1 and assumptions 2 and 5.
Figure6shows the relation betweenUandmW(0). The
value ofmW(0) increased withU, whose trend was clearly
different from that for the relation between U and the amount of the polymers in cell walls after all processes (shown by closed circle in Fig.4). This difference indicates the distribution of the polymers changed during condi-tioning, which was considered to be caused by the poly-mers diffusing into the cell walls during the conditioning. The amount of the polymers that diffused during the con-ditioning, however, remains unclear. To clarify this amount, a normalized indicator is required that represents the amount of the polymers in the cell walls just before conditioning and after all processes.
Amount of diffused polymers during conditioning
As the normalized indicator, the packing ratio of the PEG polymers in cell walls (p) was defined as ‘‘the volume ratio of the transient pore filled with the polymers to that created by the solution just before conditioning’’. The packing ratios of the polymers in cell walls just before the condi-tioning and after all processes (p(0) andpV, respectively)
were estimated using the following steps. The estimation was based on the following assumptions in addition to assumptions 1–6.
7. The transient pore filled with the extract with volume offEmO/qEbefore impregnation (Fig.5a) is filled with
the impregnated solution just before conditioning (Fig.5b).
8. The deformation of the sample in the longitudinal direction is negligible.
9. The swelling of the sample caused by the solution or PEG polymers is sufficiently larger than that caused by the extract.
The mass of the PEG polymers that can theoretically fill the transient pore created by the solution just before condi-tioning was qCfað Þ0 vOþfEmO=qEg (Fig.5b) based on assumptions 2–4, 7, and 8. ThemW(0) was just before the
conditioning. The volume ratio is equal to the mass ratio when the pore is filled with the same substance (Assump-tion 4); therebyp(0) was formulated as follows:
pð0Þ ¼ mWð0Þ
qC að0ÞvOþfEqmO
E
n o: ð7Þ
Based on assumptions 1, 2, 4, and 8, the packing ratio after all processes (pV) was the volume ratio of the transient pore
after all processes, aVvOþfEmO=qE (Fig.5c), to that just before conditioning, að Þ0 vOþfEmO=qE (Fig.5b), resulting in the relation pV¼faVþfEmO=ðqEvOÞg=
að Þ þ0 fEmO=ðqEvOÞ
f g. In this relation, the term
fEmO=ðqEvOÞ was negligible compared to aV and a(0)
based on assumption 9, and the ratio of aV to a(0) was
equal to that ofrVtor(0). Therefore,pVwas formulated as
follows:
pV
aV
að0Þ¼ rV
rð0Þ: ð8Þ
The values ofp(0) andpVfor eachUwere estimated using
Eqs. (7) and (8), respectively, with the values in Table1, Figs. 4and6, and assumption 2.
Figure7 shows the relations of p(0) and pV toU. This
figure also shows the relation betweenUand the difference of the two packing ratios, pV-p(0), which is
approxi-mately equal to the normalized amount of the PEG poly-mers that diffused during conditioning. The difference, pV-p(0), was much larger than and similar to p(0) at
U=10–40 mass% and 50 mass%, respectively, which
Fig. 6 Relation between impregnated-solution concentration (U) and mass of the polymers in cell walls just before conditioning [mW(0)].
Barsstandard deviations
indicates that the majority of the polymers diffusing into cell walls during conditioning if solution concentration was not so high. The relation of pV-p(0) to U exhibited a
concave-downward curve with a maximum value at U=20 mass%. This indicates that the amount of the polymers diffusing into cell walls during conditioning decreased with a more than 20 mass% increase in solution concentration, and that the amount of the polymers in the sample impregnated with the solution with concentration less than 20 mass% might be smaller than the minimum concentration needed for polymers to fill the cell walls. The cause of the former indication and verification of the latter are described in the following sections.
Cause of negative correlation between concentration and amount of polymers diffusing into cell walls
It was verified in our previous studies that the amount of the PEG polymers diffusing into cell walls increased with the diffusivity [15] and the concentration difference [16] of the polymers. From the perspective of these two factors, the effect of the solution concentration on the amount of the diffused polymers is explained as follows.
The diffusivity of the PEG polymers into cell walls is known to increase with the moisture content of the sample [13]. At an early stage of the conditioning, the sample impregnated with the solution with lower concentration was indicated to have higher moisture content (Fig.3a). This was considered to contribute to the increase in the amount of the diffused polymers with the decrease in the concentration.
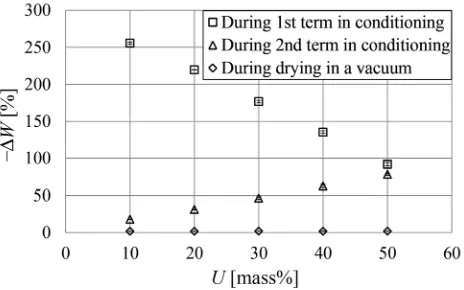
The concentration difference between the PEG polymers in cell cavities and cell walls was verified to increase with the amount of water evaporated from the sample in pre-vious studies [15, 16]. The relation between U and the decrease in WPG (-DW) during each term is shown in Fig.8. The value of -DW, representing the amount of water evaporated from the samples, during the 1st term was larger than that during the 2nd term and drying in a vac-uum. The value during the 1st term decreased as U in-creased. These findings indicate that the concentration difference occurred especially during the 1st term and decreased with the increase in the solution concentration, which was considered to contribute to the increase in the amount of diffused polymers with the decrease in the concentration.
Estimation of minimum concentration for filling cell walls with polymers
The minimum concentration at which the solution contains the least amount of the polymers required to fill the cell walls was estimated using the following steps. The
estimation was based on the following assumptions in addition to assumptions 1–8.
10. The volume of transient pores in cell walls just before conditioning is equal to that after all processes (Fig.5b, d).
11. All the PEG polymers in cell cavities diffuse into transient pores in the cell walls during conditioning (Fig.5d).
The mass of the solution filling both cell cavities and transient pores with volumes of vOð1fEÞmO=qCW fEmO=qE and að Þ0 vOþfEmO=qE, respectively, was
vOð1fEÞmO=qCWþað Þ0 vO
f gqS (Fig.5b), based on
assumptions 1–4, 6–8, and 10. Based on assumption 4, this solution contained the PEG polymers whose mass was
vOð1fEÞmO=qCWþað Þ0 vO
f gqSU=100, which is
equal to the mass of the polymers present in the sample just before conditioning. The mass of the polymers that filled the transient pores after all processes was
qCfað Þ0 vOþfEmO=qEg (Fig.5d). Based on assumption 11, the mass of the polymers present in the sample just before conditioning was equal to the mass of the polymers that filled the transient pores after all processes, resulting in the relation fvOð1fEÞmO=qCWþað Þ0 vOgqSU=100¼
qCfað Þ0 vOþ fEmO=qEg. By substituting Eq. (10) (see ‘‘Appendix’’ section) for theqS in this relation and then
solving forU, the following equation was obtained:
U¼ 100
að0ÞvOþfEqEmO
n o
qC
vOð1qCWfEÞmOfEqEmO
n o
qMþ að0ÞvOþfEqEmO
n o
qC
[mass%:
ð9Þ
The minimum concentration was estimated using Eq. (9) with the values in Table1 and based on assump-tions 2 and 5.
The estimated minimum concentration was 10.7±0.2 mass%, which was lower thanU=20 mass% at which the
amount of the PEG polymers diffusing into cell walls was at the maximum. This indicates that the polymers remained in the cell walls after all processes if the conditioning processes were controlled. This was because the chemical potential reached the equilibrium point only when some polymers were present in the cell cavity.
Conclusion
To clarify the effect of the concentration of the impregnated solution on the solute diffusing into the cell walls during conditioning, WPG (W), and relative swel-ling (r), of the wood sample impregnated with an aqueous solution of PEG polymers withU=10, 20, 30, 40, or 50 mass%, were examined during the conditioning and subsequent drying processes. The relation of r to U after all processes, the indicator of the amount of polymers in cell walls, exhibited a concave-downward curve with a maximum value at U=20 mass%. The estimated mass of polymers in cell walls just before conditioning [mW(0)] increased with U. This indicates
that the distribution of the polymers changed during conditioning. The value of mW(0) just before
condition-ing and the value of r after all processes were normal-ized to the packing ratios of the polymers in cell walls, p(0) and pV, respectively. The difference pV-p(0) was
larger than p(0) and increased with U up to 20 mass% and then decreased. This indicates that the majority of the polymers in cell walls increased during conditioning, and that the amount of the polymers that diffused into cell walls was at a maximum at U=20 mass%. This was explained by two factors: the decrease in the dif-fusivity into cell walls and in the concentration differ-ence between cell walls and cell cavity of the polymers with the concentration, based on the behavior of W dur-ing conditiondur-ing; and the estimated minimum concen-tration at which the solution contains the least amount of the polymers required to fill the cell walls.
Appendix
The relation between the density and concentration of the solution was estimated as follows. Based on assumption 4, the volume of the solution was equal to the sum of the volumes of the solvent and solute,mM=qMþmC=qC, where mM andmC represent the mass of the solvent and solute,
respectively, in the solution. The mass of the solution was mM?mC; thereby the concentration and density of the
solution (UandqS, respectively) were formulated asU¼
100mC=ðmMþmCÞ and qS¼ðmMþmCÞ= ðmM=qMþ
mC=qCÞ. From these formulae, the following equation was obtained.
qS¼
100qCqM ð100UÞqCþUqM
: ð10Þ
References
1. Stamm AJ (1964) Dimensional stabilization. Wood and cellulose science. Ronald Press, New York, pp 312–342
2. Norimoto M, Grill J (1993) Structure and properties of chemi-cally treated wood. In: Shiraishi N, Kajita H, Norimoto M (eds) Recent research on wood and wood-based materials, current Japanese materials research, vol 11. Elsevier Applied Science, London and New York, pp 135–154
3. Stamm AJ (1956) Dimensional stabilization of wood with car-bonwaxes. For Prod J 6:201–204
4. Ishimaru Y (1993) PEG To Mokuzai No Hanashi (in Japanese). Mokuzaihozon 19:204–218
5. Jeremic D, Cooper P, Heyd D (2007) PEG bulking of wood cell walls as affected by moisture content and nature of solvent. Wood Sci Technol 41:597–606
6. Jeremic D, Cooper P (2009) PEG quantification and examination of molecular weight distribution in wood cell walls. Wood Sci Technol 43:317–329
7. Jeremic D, Quijano-Solis C, Cooper P (2009) Diffusion rate of polyethylene glycol into cell walls of red pine following vacuum impregnation. Cellulose 16:339–348
8. Kitani Y, Ohsawa J, Nakato K (1970) Adsorption of polyethylene glycol on water-swollen wood versus molecular weight (in Japanese). Mokuzai Gakkaishi 16:326–333
9. Sadoh T, Hashihira M (1973) A note on the swelling of wood with polyethylene glycols (in Japanese). Bull Kyoto Univ For 45:227–237 10. Schneider VA (1969) Contribution on the dimensional stabi-lization of wood with polyethylene glycol. Part 1: Basic inves-tigation on the dimensional stabilization of wood with polyethylene glycol (in German). Holz Roh Werkst 27:209–224 11. Schneider VA (1970) Contribution on the dimensional stabi-lization of wood with polyethylene glycol. Part 2: Investigation of changes of wood properties by PEG impregnation and on the effectiveness of various impregnation processes (in German). Holz Roh Werkst 28:20–34
12. Stamm AJ (1959) The dimensional stability of wood. For Prod J 9:375–381
13. Stamm AJ (1964) Factors affecting the bulking and dimensional stabilization of wood with polyethylene glycols. For Prod J 14:403–408
14. Tarkow H, Feist WC, Southerland CF (1966) Interaction of wood with polymeric materials penetration versus molecular size. For Prod J 16:61–65
15. Tanaka S, Seki M, Miki T, Shigematsu I, Kanayama K (2015) Solute diffusion into cell walls in solution-impregnated wood under conditioning process I: effect of relative humidity on solute diffusivity. J Wood Sci 61:543–551
16. Tanaka S, Miki T, Seki M, Shigematsu I, Kanayama K (2015) Mechanism verification of solute diffusion into cell walls in solution impregnated wood under conditioning process: effect of relative humidity on swelling and shrinkage behavior of wood impregnated with an aqueous solution of polyethylene glycol (in Japanese). J Soc Mater Sci Japan 64:369–374
18. Greenspan L (1977) Humidity fixed points of binary saturated aqueous solutions. J Res Natl Bur Stand Sec A Phys Chem 81A:89–96
19. Society Japan Wood Research (ed) (2010) Mokuzai No Sosei To Seisei, Mokushitsu No Kagaku (in Japanese). Buneido, Tokyo, pp 3–4
![Fig. 6 Relation between impregnated-solution concentration (U) andmass of the polymers in cell walls just before conditioning [mW(0)].Bars standard deviations](https://thumb-us.123doks.com/thumbv2/123dok_us/914949.1589352/7.595.53.289.56.234/relation-impregnated-solution-concentration-polymers-conditioning-standard-deviations.webp)