Neuropsychiatric Disease and Treatment
Reduced prefrontal cortex activation using the
Trail Making Test in schizophrenia
Ryo Fujiki1,2 Kiichiro Morita1,2
Mamoru Sato1,2
Yuji Kamada1,2
Yusuke Kato1,2
Masayuki Inoue2
Yoshihisa Shoji1,2
Naohisa Uchimura1
1Department of Neuropsychiatry, Kurume University School of Medicine, Kurume-City, Japan; 2Cognitive and Molecular Research Institute of Brain Diseases, Kurume University School of Medicine, Kurume-City, Japan
Correspondence: Ryo Fujiki Department of Neuropsychiatry and Cognitive and Molecular Research Institute of Brain Diseases, Kurume University School of Medicine 67, Asahi-Machi, Kurume-City, Japan Tel +81 942 317 564
Fax +81 942 356 041
Email [email protected]
Kiichiro Morita
Department of Neuropsychiatry and Cognitive and Molecular Research Institute of Brain Diseases, Kurume University School of Medicine 67, Asahi-Machi, Kurume-City, Japan Tel +81 942 317 564
Fax +81 942 356 041
Email [email protected]
Abstract: Schizophrenia has been associated with a deficit of the prefrontal cortex, which is involved in attention, executive processes, and working memory. The Trail Making Test (TMT) is administered in two parts, TMT-A and TMT-B. It is suggested that the difference in performance between part A and part B reflects executive processes. In this study, we compared the characteristics of hemodynamic changes during TMT tasks between 14 outpatients with schizophrenia and 14 age- and gender-matched healthy control subjects. Using multichannel near-infrared spectroscopy, we measured relative changes in oxygenated hemoglobin concentra-tion, which reflects brain activity of the prefrontal cortex during this task. In both tasks, patients showed significantly smaller activation than controls and, in an assessment of executive functions, a subtraction of oxygenated hemoglobin (oxy-Hb) changes during TMT-A from those of TMT-B showed a decrease in cerebral lateralization and hypoactivity in patients. There was a significant negative correlation between oxy-Hb changes and the severity of psychiatric symptoms. These findings may characterize disease-related features, suggesting the usefulness of oxy-Hb change measurement during TMT tasks for assessing functional outcomes in schizophrenic patients.
Keywords: Trail Making Test, multichannel near-infrared spectroscopy, schizophrenia, prefrontal cortex, executive function
Introduction
Schizophrenia has been associated with a deficit of the prefrontal cortex (PFC),1–3
which is involved in attention, executive processes, and working memory.4 It is
suggested that the PFC is highly evolved in humans and its function is essential for activities in daily life.5 Previous studies attempted to identify distinctions between
prefrontal functions, such as those of the dorsolateral and frontopolar regions.6–8 The
dorsolateral region is involved in executive function and the frontopolar region has a high level of control coordinating the ventrolateral and dorsolateral functions to maximize task performance.9,10 A number of studies using neurocognitive tasks have
reported frontal disability, hypofrontality, and reduced lateralization of patients with schizophrenia compared with healthy subjects.11–16 Henseler et al17 showed the
differ-ent cortical activation patterns of patidiffer-ents with schizophrenia compared with controls using functional magnetic resonance imaging (f-MRI) during a working memory task, and it was found that more severely affected patients had stronger prefrontal activation and poorer performance.
The Trail Making Test (TMT) is a group of easy and inexpensive neuropsychologi-cal tests that evaluate several cognitive functions. The test is generally administered in two parts, TMT-A and TMT-B. TMT-A requires that subjects draw lines sequentially
Dove
press
O R I g I N A L R E S E A R C h
open access to scientific and medical research
Open Access Full Text Article
Neuropsychiatric Disease and Treatment downloaded from https://www.dovepress.com/ by 118.70.13.36 on 25-Aug-2020
For personal use only.
Number of times this article has been viewed
This article was published in the following Dove Press journal: Neuropsychiatric Disease and Treatment
connecting circles marked with numbers, which are randomly distributed on a sheet of paper (numbers ranging from 1 to 25), and TMT-B requires subjects to perform the same task as in TMT-A, except the subjects have to draw lines that alternate between numbers and letters (for example, 1-A, 2-B … 12-L-13). In both parts, subjects are asked to complete the task as rapidly as possible using a pencil. It has been proposed that TMT-A involves attention, visual search, motor functioning, and working memory and TMT-B addi-tionally involves executive function.18,19 Thus, the difference
in performance between part A and part B reflects executive processes such as cognitive set shifting.20,21
In the TMT tasks, patients with schizophrenia have demonstrated poor response times in comparison with healthy subjects. In general, neuroimaging studies in healthy subjects have shown several cortical activation patterns; one reported study using f-MRI during an advanced TMT (ATMT) task demonstrated bilateral dorsolateral PFC acti-vation in the ATMT task F, which was involved in process-ing speed and visuospatial workprocess-ing memory, while another study using near-infrared spectroscopy (NIRS) during an actual TMT task demonstrated bilateral prefrontal activity in more than 65% of all subjects, with left dominancy in 7.3% and right dominancy in 4.9%.22,23 A study of patients
with schizophrenia using positron emission tomography (PET) revealed that hypometabolism in the bilateral frontal lobe, including a large part of the PFC, was associated with task performance.24 It is suggested that these results showed
that the load of this task necessitated bilateral functioning in the prefrontal region.
NIRS is a practical, noninvasive imaging method employ-ing scattered near-infrared light to measure changes in oxy-genated blood hemoglobin at the surface of the brain, and this machine has enabled a functional mapping of the cerebral cortex. The underlying principle is that relative changes in oxygenated hemoglobin (oxy-Hb) concentration reflect regional cerebral blood volume, which is associated with brain activity. NIRS has been increasingly used to investigate schizophrenia because the apparatus is relatively small and portable, is easily set up, and imposes minimal limitation of movement.12,13,22,23,25,26 Therefore, NIRS instruments could be
useful in evaluating cortical activation patterns of patients with schizophrenia during TMT performance using a pen-cil. To our knowledge, however, NIRS has not been used to investigate the characteristics of frontal activation directly in patients with schizophrenia versus healthy subjects during the TMT task, but there have been analogous f-MRI and PET studies using this task.22,23
In this study, we measured the change in prefrontal activation during TMT performance in patients with schizophrenia and healthy subjects by using a 22-channel NIRS instrument.
The primary aim was to identify a dissociated activity pattern in patients with schizophrenia compared with that in healthy subjects. We hypothesized that there would be reduced activity in the PFC area in patients, as in previous studies. An additional aim was to investigate the relationship between functional brain activity and psychiatric symptoms or TMT performance. We hypothesized an association of these factors, as in previous studies, which could be an indicator of clinical outcomes.
Methods
Participants
The patients included 14 Japanese outpatients with schizophrenia (nine males and five females; mean age, 29.9 ± 6.4 years) and 14 age- and gender-matched healthy control subjects (nine males and five females; mean age, 30.9 ± 8.6 years). Two attending psychiatrists diagnosed patients using the International Classification of Disease-10.27
All subjects were right-handed according to the Edinburgh Inventory.28 Their mean intelligence quotient values were
evaluated by the Japanese version of the National Adult Reading Test.29 No subject had any history of neurologic
disorders, substance abuse, alcohol abuse, seizures, or head injuries. Healthy control subjects had no history of psychiat-ric illness or familial history of psychosis. All patients were taking atypical antipsychotic medications (ie, olanzapine [n = 5], risperidone [n = 9]). The mean daily antipsychotic dose in terms of haloperidol equivalent was 7.8 ± 3.0 mg.30
Psychopathology was assessed using the Positive and Negative Syndrome Scale (PANSS).31 Neither patients nor
control subjects showed visual disabilities. The ethics com-mittee of Kurume University approved the present study. Written informed consent was obtained from all subjects prior to participation in the study. Demographic and clinical characteristics of all subjects are shown in Table 1.
Measures
NIRS measurement
Oxy-Hb changes, which were calculated from the difference in absorbance based on the modified Beer–Lambert law, were measured during the tasks using a 22-channel NIRS machine (ETG4000; Hitachi Ltd, Tokyo, Japan) covering the prefrontal region. Distances between the injector and the detector probe were 3 cm. We defined each measurement area between Dovepress
Fujiki et al
Neuropsychiatric Disease and Treatment downloaded from https://www.dovepress.com/ by 118.70.13.36 on 25-Aug-2020
to be ch 1, ch 5, ch 6 and ch 10 (left sites); ch 4, ch 8, ch 9 and ch 13 (right sites).
Activation task
Brain activation was measured during the TMT execution. NIRS study during the TMT task can be carried out at various places, such as at the bedside, unlike with a virtual TMT task using magnetic resonance imaging and PET, and can obtain more direct assessments by performing TMT with a pencil and paper; thus, the task is thought to reflect daily life activity. For the activation task, each subject sat on a comfortable chair and had to perform the pencil–paper TMT tasks on a table. The subjects were instructed to use only their right hand. One session consisted of two contrasting Table 1 Subject characteristics
Patients Controls P-value
Age (years) 29.9 ± 6.4 30.9 ± 8.6 0.73
gender (F/M) 5/9 5/9
Education (years) 13.7 ± 2.1 15.1 ± 1.5 ,0.05
IQ 99.2 ± 9.0 104.2 ± 5.2 ,0.05
Illness duration (years) 5.1 ± 3.7 PANSS score
Positive subscale 23.3 ± 3.5 Negative subscale 22.7 ± 4.9
Total 45.0 ± 4.4
Medication
hPD equivalent (mg/day) 7.8 ± 3.0
Notes: Data are presented as means ± standard deviation. P, 0.05, comparing patients with controls.
Abbreviations: F, females; M, males; IQ, intelligence quotient; PANSS, Positive and Negative Syndrome Scale; hPD, haloperidol.
22 21 20 19
14 15 16 17 18
13 12 11 10
9 8 7 6 5
4 3 2 1
Fp2 Fp1
22 18
17 16 15 14
10
5
1 2 3 4
6 7 8
9 12 11
13
21 20 19
A
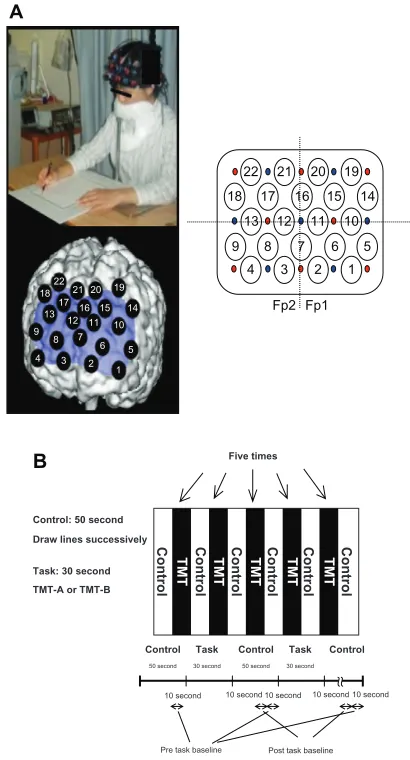
Figure 1 Studydesign. (A) Location of channels; (B) protocol.
Notes: Eachsubject performed one session, which consisted of five blocks, and had
to complete the task to the best of their ability within the 30 second task period. They performed TMT-A/B with a pencil and paper on a table. When the control period was over, we put the sheets of paper on the table for the task. There was a start signal provided when we put the new sheets of paper on the table for the task.
Abbreviation: TMT,Trail Making Test.
Pre task baseline Post task baseline 10 second
50 second 50 second 30 second 30 second
10 second 10 second 10 second 10 second
Control Task Control Task Control Five times
Control: 50 second Draw lines successively
Task: 30 second TMT-A or TMT-B
Control Control Control Control Control Control TMT TMT TMT TMT TMT B
probes as a channel (ch). The NIRS machine is thought to measure changes at points 2 cm to 3 cm beneath the scalp; that is, the cerebral cortical surface.32,33 The lowest anterior
probes, ch 2 and ch 3, were positioned along the Fp1–Fp2 line according to the International 10–20 system used in electroencephalography (Figure 1A). In the present study, all subjects were instructed to minimize their movements, and jaw fixation was used during the task to avoid movement artifacts. NIRS data were calculated from the mean waves of oxy-Hb changes at each channel and region of interest (ROI). The pretask baseline was determined as the mean during the 10 seconds preceding the task period, while the posttask baseline was determined as the mean during the 10 seconds from 30 seconds to 40 seconds after the task period. Linear fitting was applied to the data between these two baselines. For the relationship between each channel and anatomic region, NIRS data were converted to a normalized brain image template (three-dimensional composition indication unit; Hitachi Ltd). We divided all recording sites into left sites (ch 1, ch 2, ch 5, ch 6, ch 10, ch 11, ch 14, ch 15, ch 19, ch 20) and right sites (ch 3, ch 4, ch 8, ch 9, ch 12, ch 13, ch 17, ch 18, ch 21, ch 22) to assess the lateralization of activation.
According to the ROI, we determined regions reflecting executive function after analysis at each channel. ROIs evalu-ated to determine physiologic significance were selected for channels reflecting the midfrontal area and frontopolar area. The midfrontal area has been reported to reflect executive function, and the frontopolar area to reflect coordination of the ventrolateral and dorsolateral functions.9,10 The midfrontal
area was speculated to be ch 14 and ch 19 (left sites); ch 18 and ch 22 (right sites). The frontopolar area was speculated
Dovepress Trail Making Test and schizophrenia
Neuropsychiatric Disease and Treatment downloaded from https://www.dovepress.com/ by 118.70.13.36 on 25-Aug-2020
conditions (TMT-A or TMT-B task: 30 seconds; control condition: 50 seconds), and all subjects alternated between these conditions. In addition, we counterbalanced by having the TMT tasks being performed alternately by each subject. The TMT-A or TMT-B task was performed as five blocks in one session. In the TMT task, subjects were required to draw lines sequentially, connecting circles marked with numbers or alternating between numbers and letters, which were randomly distributed on a sheet of paper. In both tasks, numbers or letters were pseudorandomly arranged on each page. In the control condition, subjects were required to draw lines sequentially from one end of the page to the other on a piece of paper. According to the different time windows for the control and task conditions, the control period took more than 30 seconds until recovery of activation. Therefore, we set the control period to 50 seconds in order to ensure sufficient recovery time.
Averaged waveforms for the five task blocks were analyzed as one session using the “Integral mode” of the machine. Oxy-Hb changes between activation and control periods were expressed numerically for each 100 ms. The area of the task period (30 seconds) was calculated (Figure 1B). We used values of this area as our NIRS data. In this study, we anticipated different reaction times between groups. Since we aimed to measure hemodynamic changes throughout performance of the task, the total TMT score for each block was used as the performance for a session.
Statistical analysis
We compared the performance of patients and healthy subjects in each task using an unpaired t-test. In only ROIs, NIRS data were examined using three-way analysis of variance (ANOVA) (group × hemisphere × task). Two-way ANOVA (group × hemisphere) was evaluated for each task in each channel and ROI. Then, one-way ANOVA (group/ hemisphere) was evaluated in each channel and ROI. The difference in performance between part A and part B reflects executive processes. Previous studies suggested that this value removed bias due to several functions such as speed element, visual search, and motor functioning,19,34 and that
part B – part A performance was the best index of executive function.20 Thus, NIRS data were also examined regarding
values that were obtained by subtracting oxy-Hb changes during TMT-A from those of TMT-B (B–A activation), using the same analysis in each channel and ROI. According to ch 7 and ch 16, oxy-Hb changes and the value of B–A activation in controls were compared with those of patients using an unpaired t-test. Fisher’s protected least significant difference
was then applied as a post hoc test between sites or groups. The correlation between the oxy-Hb changes and the PANSS score/profile is expressed as Pearson’s product-moment correlation coefficient; Bartlett’s test was used to evaluate statistical significance, and correlation coefficients were accepted as significant at more than 0.4 and less than −0.4. A value of P , 0.05 was accepted as statistically significant. Values are expressed as the mean ± standard deviation. We used the oxy-Hb changes as data in this study because these changes correlate more strongly with blood oxygen level-dependent signals of f-MRI than do changes in deoxy-Hb.35
Results
Performance of TMT tasks
TMT-A performance was 58.2 ± 17.6 in patients and 83.5 ± 15.3 in controls, showing a significant difference between the groups (unpaired t-test: t= −4.0, P , 0.01). TMT-B performance was 46.1 ± 16.2 in patients and 73.4 ± 14.4 in controls, also showing a signif icant difference between the groups (unpaired t-test: t = −4.5, P , 0.01).
The value obtained by subtracting the TMT-A from the TMT-B score (B–A performance) was −12.2 ± 8.8 in patients and −10.0 ± 15.6 in controls, showing no significant difference between groups (unpaired t-test: t = −0.43, P= 0.67).
Activation of TMT tasks at each channel
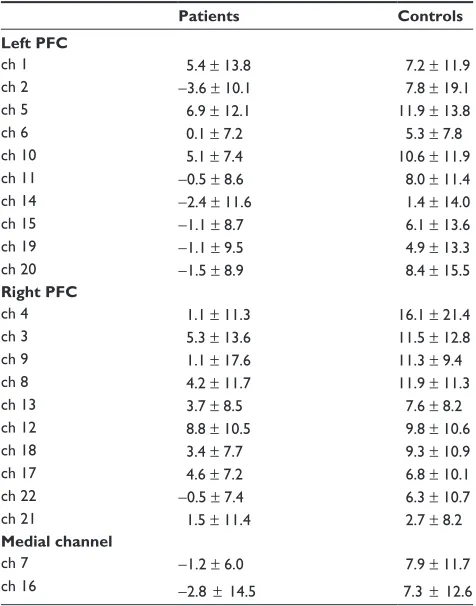
The activation of every channel for each condition in both groups is shown in Tables 2–4. In TMT-A, two-way ANOVA revealed a significant main effect of “group” at ch 3, ch 11, and ch 20 (F = 9.3, P , 0.01: F = 6.2, P , 0.05: F = 8.0, P , 0.01, respectively), but not significant interactions. The patients with schizophrenia showed significantly smaller activation than the healthy controls at four channels (F = 4.3, P , 0.05; ch 7, unpaired t-test, t=−2.6, P , 0.05) (Figure 2). In TMT-B, two-way ANOVA revealed a significant main effect of “group” at eleven channels (ch 1, F = 6.6, P , 0.05; ch 2, F = 12.2, P , 0.01; ch 5, F = 14.6, P , 0.01; ch 6, F = 14.1, P , 0.01; ch 9, F = 14.6, P , 0.01; ch 10, F = 10.7, P , 0.01; ch 11, F = 21.4, P , 0.01; ch 12, F = 21.4, P , 0.01; ch 14, F = 8.7, P , 0.01; ch 15, F = 6.1, P , 0.05; ch 20, F = 10.3, P , 0.01), but not significant interactions. The patients with schizophrenia showed significantly smaller activation than the healthy controls at 12 channels (ch 1, F = 4.5, P , 0.05; ch 2, F = 10.0, P , 0.01; ch 5, F = 7.3, P , 0.05; ch 6, F = 17.5, P , 0.01; ch 9, F = 7.6, P , 0.05; ch 10, F = 11.3, P , 0.01; ch 11, F = 14.7, P , 0.01; ch 12, F = 6.9, P , 0.05; ch 14, Dovepress
Fujiki et al
Neuropsychiatric Disease and Treatment downloaded from https://www.dovepress.com/ by 118.70.13.36 on 25-Aug-2020
and ch 10 (F = 13.3, P , 0.01; F = 13.3, P , 0.01; F = 10.5, P , 0.01, respectively), but not significant interactions. The patients with schizophrenia showed significantly smaller activation than the healthy controls at six channels (ch 1, F = 5.2, P , 0.05; ch 5, F = 16.0, P , 0.01; ch 6, F = 8.3, P , 0.01; ch 8, F = 5.0, P , 0.0 5; ch 10, F = 10.2, P , 0.01; ch 14, F = 9.2, P, 0.01) (Figure 2). Significant lateralization of oxy-Hb changes at ch 1, ch 5, and ch 14 was observed in controls (ch 1, F = 5.6, P , 0.05; ch 5, F = 9.2, P , 0.01; ch 14, F = 4.9, P , 0.05), but not in patients.
Activation of TMT tasks at ROI
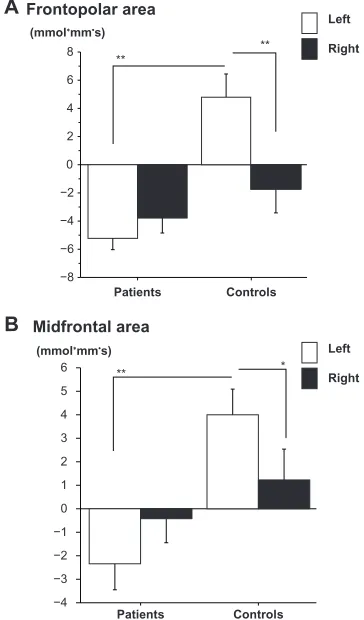
In the frontopolar area, three-way ANOVA revealed a significant main effect of “group” (F = 65.8, P, 0.01), as well as significant interactions of “group × hemisphere × task” (F = 3.9, P , 0.05). Two-way ANOVA revealed a significant main effect of “group” in both TMT-A and TMT-B (F = 17.7, P , 0.01; F = 50.1, P , 0.01, respectively), but no significant interactions in either task were found. In TMT-A, oxy-Hb changes at both sides in controls were significantly larger than in patients (left, F = 4.4, P , 0.05; right, F = 14.0, P , 0.01), while in TMT-B, similar findings were revealed (left, F = 31.5, P , 0.01; right, F = 18.8, P , 0.01). In controls, significant lateralization was observed in TMT-B (TMT-A: F = 1.6, P= 0.21; TMT-B: F = 4.3, P , 0.05), but not among patients in both conditions (Figure 3).
In the midfrontal area, three-way ANOVA revealed a significant main effect of “group” (F = 20.4, P , 0.01), but not significant interactions of “group × hemisphere × task” (F = 1.7, P= 0.20). Two-way ANOVA (group × hemisphere) revealed a significant main effect of “group” in both TMT-A and TMT-B (F = 7.6, P , 0.01; F = 12.8, P , 0.01, respectively), but not significant interactions in both tasks. Table 2 Activation at each channel during TMT-A
Patients Controls
Left PFC
ch 1 5.4 ± 13.8 7.2 ± 11.9
ch 2 −3.6 ± 10.1 7.8 ± 19.1
ch 5 6.9 ± 12.1 11.9 ± 13.8
ch 6 0.1 ± 7.2 5.3 ± 7.8
ch 10 5.1 ± 7.4 10.6 ± 11.9
ch 11 −0.5 ± 8.6 8.0 ± 11.4
ch 14 −2.4 ± 11.6 1.4 ± 14.0
ch 15 −1.1 ± 8.7 6.1 ± 13.6
ch 19 −1.1 ± 9.5 4.9 ± 13.3
ch 20 −1.5 ± 8.9 8.4 ± 15.5
Right PFC
ch 4 1.1 ± 11.3 16.1 ± 21.4
ch 3 5.3 ± 13.6 11.5 ± 12.8
ch 9 1.1 ± 17.6 11.3 ± 9.4
ch 8 4.2 ± 11.7 11.9 ± 11.3
ch 13 3.7 ± 8.5 7.6 ± 8.2
ch 12 8.8 ± 10.5 9.8 ± 10.6
ch 18 3.4 ± 7.7 9.3 ± 10.9
ch 17 4.6 ± 7.2 6.8 ± 10.1
ch 22 −0.5 ± 7.4 6.3 ± 10.7
ch 21 1.5 ± 11.4 2.7 ± 8.2
Medial channel
ch 7 −1.2 ± 6.0 7.9 ± 11.7
ch 16 −2.8±14.5 7.3±12.6
Abbreviations: TMT-A, Trail Making Test-A; PFC, prefrontal cortex.
Figure 2 Mapsof cortical distribution of channels that were significantly smaller in patients than in healthy subjects during TMT-A, TMT-B, and B–A activation. (A) TMT-A; (B) TMT-B; (C) B–A activation.
Note: Statistically significant channels are colored white. Abbreviation: TMT,Trail Making Test.
F = 7.2, P , 0.05; ch 15, F = 4.9, P , 0.05; ch 20, F = 11.0, P , 0.01; ch 7, unpaired t-test t=−2.8, P , 0.01) (Figure 2). Both groups did not exhibit significant lateralization at each channel in TMT-A and TMT-B.
In B–A activation, two-way ANOVA revealed significant interactions at ch 1, ch 5, and ch 14 (F = 4.3, P, 0.05; F = 6.6, P , 0.05; F = 4.4, P , 0.05, respectively). Two-way ANOVA revealed a significant main effect of “group” at ch 6, ch 8,
Dovepress Trail Making Test and schizophrenia
Neuropsychiatric Disease and Treatment downloaded from https://www.dovepress.com/ by 118.70.13.36 on 25-Aug-2020
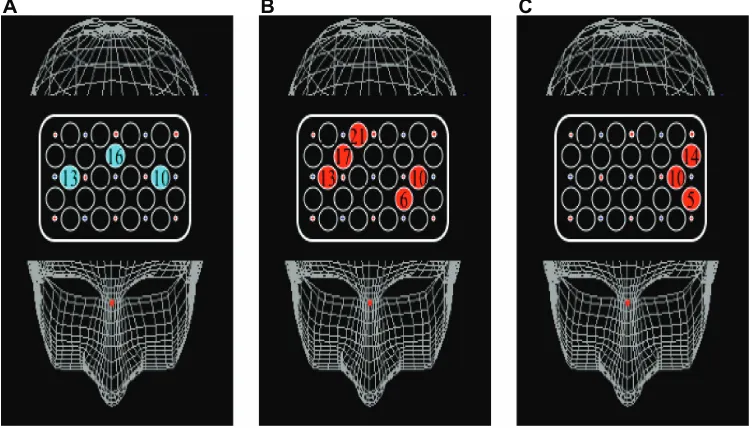
were significantly smaller than those of controls, but not for the right sites (left, F = 35.0, P , 0.01; right, F = 0.58, P= 0.45). In controls, significant lateralization of oxy-Hb changes was observed, but this was not the case in patients (controls: F = 12.2, P , 0.01; patients: F = 0.43, P= 0.52) (Figure 4).
In the midfrontal area, two-way ANOVA revealed significant interactions (F = 5.3, P , 0.05). The values at left sites in patients were significantly smaller than controls, but not in the right sites (left, F = 8.97, P , 0.01; right: F = 0.11, P= 0.74). In controls, significant lateralization of oxy-Hb changes was observed, but this was not the case in patients (controls: F = 5.11, P , 0.05; patients: F = 0.80, P= 0.37) (Figure 4).
Relationship between oxy-hb changes
and PANSS scores or performance
In healthy subjects, oxy-Hb changes at ch 6, ch 10, ch 13, ch 17, and ch 21 showed a significant correlation
∗ ∗∗
∗∗ ∗∗ ∗
TMT-A TMT-B TMT-A TMT-B
Patients Controls
−5 −2.5 0 2.5 5 7.5 10 12.5 15 17.5 20
(mmol∗mm•s)
AFrontopolar area
Left
Right
∗
∗ ∗∗
TMT-A TMT-B TMT-A TMT-B
Patients Controls
−6 −4 −2 0 2 4 6 8 10 12 14
(mmol∗mm•s)
BMidfrontal area
Left
Right
Figure 3 Activationof TMT-A and TMT-B. Oxy-hb changes appear along the ordinate and groups along the abscissa. (A) Oxy-hb change at the frontopolar area in patients and healthy controls. (B) Oxy-hb change at the midfrontal area in patients and healthy controls.
Notes: Statistical significance, P, 0.05. *P, 0.05; **P, 0.01.
Abbreviations: TMT,Trail Making Test; Oxy-hb, oxygenated hemoglobin. Patients Controls
Patients Controls
−8
−3 −2 −1 0 1 2 3 4 5 6
−4 −6 −4 −2 0 2 4 6 8
(mmol∗mm•s)
(mmol∗mm•s)
A Frontopolar area
B Midfrontal area
Left
Right
Left
Right
**
** **
*
Figure 4 The value obtained by subtracting oxy-hb changes during TMT-A from those of TMT-B. Oxy-hb change appears along the ordinate and groups along the abscissa. (A) Oxy-hb change at the frontopolar area in patients and healthy controls. (B) Oxy-hb change at the midfrontal area in patients and healthy controls.
Notes: Statisticalsignificance, P, 0.05. *P, 0.05; **P, 0.01.
Abbreviations: oxy-hb,oxygenated hemoglobin; TMT, Trail Making Test.
In TMT-A, oxy-Hb changes at right sites in controls were significantly larger than in patients, but this was not the case in left sites (left, F = 2.3, P= 0.13; right: F = 6.5, P , 0.05). In addition, the results from TMT-B revealed that oxy-Hb changes at left sites in controls were significantly larger than in patients, but this was not the case in right sites (left, F = 10.7, P , 0.01; right, F = 2.8, P = 0.10). In patients, significant lateralization was observed in TMT-B (TMT-A: F = 1.7, P= 0.19; TMT-B: F = 4.3, P , 0.05), but it was not found in controls in both tasks (TMT-A: F = 2.1, P= 0.16; TMT-B: F = 0.13, P= 0.72) (Figure 3).
According to B–A activation, in the frontopolar area, two-way ANOVA revealed a significant main effect of “group” (F = 20.1, P , 0.01), as well as significant interactions (F = 11.3, P , 0.01). The values at left sites in patients
Dovepress
Fujiki et al
Neuropsychiatric Disease and Treatment downloaded from https://www.dovepress.com/ by 118.70.13.36 on 25-Aug-2020
with performance in TMT-B (ch 6, r = 0.64, P , 0.05; ch 10, r = 0.62, P , 0.05; ch 13, r = 0.61, P , 0.05; ch 17, r = 0.59, P , 0.05; ch 21, r = 0.56, P , 0.05), but not in TMT-A at each channel. In patients, oxy-Hb changes at ch 10, ch 13, and ch 16 showed a significant correlation with performance in TMT-A (ch 10, r = 0.57, P , 0.05; ch 13, r = 0.57, P , 0.05; ch 16, r = 0.57, P , 0.05), but not in TMT-B at each channel (Figure 5).
In TMT-A, oxy-Hb changes at ch 1, ch 3, ch 4, ch 5, ch 8, and ch 13 showed a significant negative correlation with positive symptom scores in patients (ch 1, r =−0.57, P, 0.05; ch 3, r =−0.56, P , 0.05; ch 4, r =−0.69, P , 0.01; ch 5, r =−0.70, P , 0.01; ch 8, r =−0.67, P , 0.05; ch 13, r =−0.67, P , 0.05), but not with negative symptom scores.
In TMT-B, oxy-Hb changes at ch 1, ch 4, ch 5, ch 8, ch 9, and ch 13 showed a significant negative correlation with positive symptom scores in patients (ch 1, r =−0.60, P , 0.05; ch 4, r =−0.79, P , 0.01; ch 5, r =−0.63, P , 0.05; ch 8, r =−0.81, P , 0.01; ch 9, r =−0.72, P , 0.01; ch 13, r =−0.67, P , 0.05). Oxy-Hb changes at ch 10 showed a significant negative correlation with negative symptom scores (r =−0.68, P , 0.01) (Figure 6).
In B–A activation in healthy subjects, the values at ch 5, ch 10, and ch 14 showed a significant correlation with B–A performance (ch 5, r = 0.70, P , 0.01; ch 10, r = 0.74, P , 0.01; ch 14, r = 0.74, P , 0.01), but not in patients at each channel. In patients, the values at ch 3 and ch 8 showed a
significant negative correlation with positive symptom scores (ch 3, r =−0.68, P , 0.05; ch 8, r =−0.63, P , 0.05), but not with negative symptom scores at each channel. In both TMT-A and TMT-B, oxy-Hb at each channel showed no significant correlation with illness duration and antipsychotic drug dose in patients.
Discussion
This study compared PFC oxy-Hb changes between patients with schizophrenia and healthy control subjects during TMT tasks. These tasks require attention, visual search, motor functioning, working memory, and executive function, reflecting set shifting. Patients with schizophrenia had worse performance in both tasks compared with controls, as in previous studies.24,36,37 Several neuroimaging studies
suggested hyper/hypofrontality, aberrant lateralization, and ineff iciency during neurocognitive tasks in schizophrenia.16,38,39 The issue of hyper/hypofrontality
has been controversial; however, Manoach39 suggested
that these findings reflect PFC dysfunction in patients with schizophrenia. In this study, patients showed hypoactivity compared with controls at the bilateral medial PFC area in TMT-A, and at a large part of the left area, right medial and right frontopolar channel in TMT-B. According to B–A activation, patients showed hypoactivity compared with controls at the left midfrontal and bilateral frontopolar channels. We suggest that these results reflect attentional
A
*
B
*
C
Figure 5 Corticaldistribution of significant correlations between activation and performance. (A) In TMT-A, oxy-Hb changes at three channels showed a significant
correlation with performance in patients, but not in controls. (B) In TMT-B, oxy-Hb changes at five channels showed a significant correlation with performance in controls,
but not in patients. (C) In B–A activation, the values at three channels showed a significant correlation with performance in controls, but not in patients. Note: Statisticallysignificant channels in patients are colored blue and those in controls are colored red.
Abbreviations: TMT,Trail Making Test; oxy-hb, oxygenated hemoglobin.
Dovepress Trail Making Test and schizophrenia
Neuropsychiatric Disease and Treatment downloaded from https://www.dovepress.com/ by 118.70.13.36 on 25-Aug-2020
processing in TMT-A, and additionally involve executive function in TMT-B.
According to ROIs, in the frontopolar area, controls showed increased bilateral oxy-Hb changes compared with patients in both tasks. In the midfrontal area, controls showed increased right-side oxy-Hb changes compared with patients
in task A and left side oxy-Hb changes compared with patients in task B. There were tendencies but no significant differences in left-side oxy-Hb changes compared with those of patients in task A and right side oxy-Hb changes compared with those of patients in task B. There was no significant correlation between brain activation during TMT tasks and illness duration.
Other neuroimaging studies demonstrated the activation of aberrant lateralization in schizophrenia compared with that in controls. Yurgelun-Todd et al40 showed left frontal and
temporal activation during a word production task in patients, and Buchsbaum et al41 showed a lack of right hemisphere
activation during a CPT task in patients. In healthy subjects, ATMT task F, which is similar to TMT-B, demonstrated bilateral dorsolateral prefrontal cortex activation, and a TMT task with a pencil and paper demonstrated bilateral prefrontal activity in more than 65% of all subjects, although no activation was found in 22%.22,23 Our study showed no
significant lateralization at each channel in both groups during both tasks. According to ROIs, in the frontopolar area, there was significant lateralization in controls only during TMT-B. In the midfrontal area, there was significant lateralization in patients only during TMT-B. These findings revealed bilateral activity in controls over a wide range of PFC regions, as in previous TMT reports, but heterogeneous findings at ROIs. In addition, B–A activation, which reflects executive processes such as set shifting, cognitive flexibility, and involvement of a general attention component,34 showed significant left
dominancy in controls at both ROIs, frontopolar channels, and the midfrontal channel, but this was not the case in patients.
A B C
Figure 6 Corticaldistribution of significant correlations between activation and PANSS scores. (A) In TMT-A, oxy-Hb changes at six channels showed a significant negative
correlation with positive symptom scores. (B) In TMT-B, oxy-Hb changes at six channels showed a significant negative correlation with positive symptom scores. Oxy-Hb changes at ch 10 showed a significant negative correlation with negative symptom scores. (C) In B–A activation, the values at two channels showed a significant correlation
with positive symptom scores.
Note: Statisticallysignificant channels correlated with positive symptom scores are colored yellow and those with negative symptom scores are colored green. Abbreviations: PANSS,Positive and Negative Syndrome Scale; oxy-hb, oxygenated hemoglobin; ch, channel.
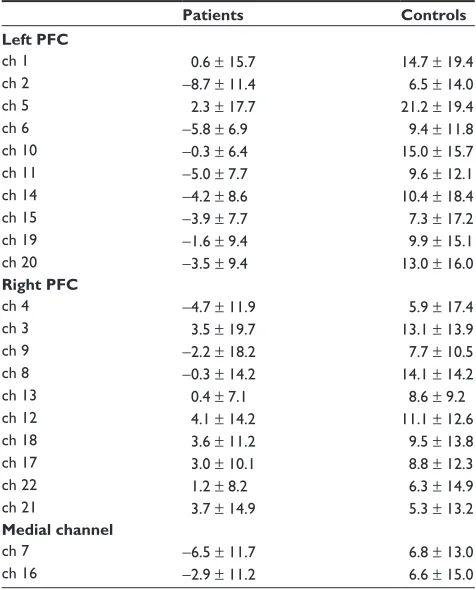
Table 3 Activation at each channel during TMT-B
Patients Controls
Left PFC
ch 1 0.6 ± 15.7 14.7 ± 19.4
ch 2 −8.7 ± 11.4 6.5 ± 14.0
ch 5 2.3 ± 17.7 21.2 ± 19.4
ch 6 −5.8 ± 6.9 9.4 ± 11.8
ch 10 −0.3 ± 6.4 15.0 ± 15.7
ch 11 −5.0 ± 7.7 9.6 ± 12.1
ch 14 −4.2 ± 8.6 10.4 ± 18.4
ch 15 −3.9 ± 7.7 7.3 ± 17.2
ch 19 −1.6 ± 9.4 9.9 ± 15.1
ch 20 −3.5 ± 9.4 13.0 ± 16.0
Right PFC
ch 4 −4.7 ± 11.9 5.9 ± 17.4
ch 3 3.5 ± 19.7 13.1 ± 13.9
ch 9 −2.2 ± 18.2 7.7 ± 10.5
ch 8 −0.3 ± 14.2 14.1 ± 14.2
ch 13 0.4 ± 7.1 8.6 ± 9.2
ch 12 4.1 ± 14.2 11.1 ± 12.6
ch 18 3.6 ± 11.2 9.5 ± 13.8
ch 17 3.0 ± 10.1 8.8 ± 12.3
ch 22 1.2 ± 8.2 6.3 ± 14.9
ch 21 3.7 ± 14.9 5.3 ± 13.2
Medial channel
ch 7 −6.5 ± 11.7 6.8 ± 13.0
ch 16 −2.9 ± 11.2 6.6 ± 15.0
Abbreviations: TMT-B, Trail Making Test-B; PFC, prefrontal cortex.
Dovepress
Fujiki et al
Neuropsychiatric Disease and Treatment downloaded from https://www.dovepress.com/ by 118.70.13.36 on 25-Aug-2020
These results of TMT-B versus part A in controls, as well as the findings of Moll et al42 suggest that executive function
requires left PFC dominancy,34 while lack of lateralization in
patients may reflect compensation for cortical dysfunction or inefficiency, as suggested in a previous report.14
In this study, we attempted to investigate the relationship between psychiatric symptoms, performance, and functional brain activity during TMT tasks. Several reports demonstrated a significant correlation between activation during a task and performance/psychiatric symptoms.17,24,43 In patients with
schizophrenia, a PET study during TMT tasks reported that hypometabolism in the bilateral frontal area involved in the PFC was associated with poor task performance in TMT-B, but not in TMT-A. However, in patients, we showed that activation at ch 10, ch 13, and ch 16 was associated with performance in TMT-A. In TMT-B, activation at each channel was not associated with performance. These different findings may be due to different task methodologies in the different studies in terms of the apparatus used.24 In addition, a previous NIRS
study during performance of TMT tasks in healthy subjects revealed no correlation between performance and cortical activity at the PFC during TMT-B.23 In our study, cortical
activation in controls showed a significant positive correlation to performance during TMT-B, but not in TMT-A. This finding
may be a result of fivefold repeated task performance for a session to obtain stable data and to reduce artifacts in our study, in contrast to performing one task for a session in the previous study.23 We considered that the difference between our results
and the findings of other studies, as mentioned above, might have been influenced by functions such as attention and working memory load in order to repeat task execution for a session and a task procedure involving actually performing TMT.
Our results showed correlations between activation and performance in patients during TMT-A, but in controls during TMT-B. These findings suggested that patients and healthy subjects were suited to different tasks, and that an increase or decrease in the task load indicated inefficiency in perform-ing tasks. Actually, even in healthy subjects, more difficult performance demonstrated aberrant activation patterns, as in patients, as a result of compensation. However, in the case of an easy task, activation at the usual activation area may not be needed for an intermediate load task. B–A activation, which reflects executive processes, showed a significant correla-tion with B–A performance in controls, but not in patients. Ikezawa et al43 demonstrated that bilateral PFC activation was
negatively associated with positive and negative symptoms during the tower of Hanoi task used to assess PFC function. Our finding suggests that bilateral frontopolar regions predict the functional outcome in patients, as suggested by a previ-ous study.43 This finding may serve as a biological marker of
schizophrenia, which suggests that reduced lateralization of B–A activation and hypoactivity in patients compared with those in healthy subjects can be used as a trait marker, and that relationship between cortical activation during a TMT task and psychiatric symptom scores can be used as a state marker. Although further studies are necessary, these markers might serve as a simple, objective evaluation tool, providing a useful way to decide when to introduce rehabilitation and to predict social functions.
However, our study had several limitations: (1) Anatomic region. It is assumed that the spatial resolution of the NIRS is poor. For the relationship between the recording site and anatomic region, NIRS data were converted to a normalized brain image template, although our data were not analyzed in terms of individual MRI brain scans. (2) Body movement. NIRS does not restrict body movement and can be applied in a natural posture, but artifacts are likely to be produced by nodding and rotation of the head. We therefore employed jaw fixation and data averaging to reduce artifacts as much as possible. (3) Influences of medications. All patients received atypical antipsychotic drugs, with which cognitive impairment has been associated.44,45 However, cognitive impairment has
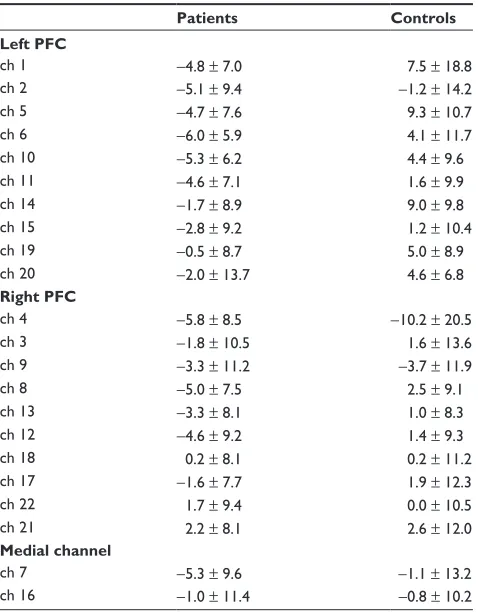
been reported in untreated patients with schizophrenia, in Table 4 Activation at each channel during TMT B–A
Patients Controls
Left PFC
ch 1 −4.8 ± 7.0 7.5 ± 18.8
ch 2 −5.1 ± 9.4 −1.2 ± 14.2
ch 5 −4.7 ± 7.6 9.3 ± 10.7
ch 6 −6.0 ± 5.9 4.1 ± 11.7
ch 10 −5.3 ± 6.2 4.4 ± 9.6
ch 11 −4.6 ± 7.1 1.6 ± 9.9
ch 14 −1.7 ± 8.9 9.0 ± 9.8
ch 15 −2.8 ± 9.2 1.2 ± 10.4
ch 19 −0.5 ± 8.7 5.0 ± 8.9
ch 20 −2.0 ± 13.7 4.6 ± 6.8
Right PFC
ch 4 −5.8 ± 8.5 −10.2 ± 20.5
ch 3 −1.8 ± 10.5 1.6 ± 13.6
ch 9 −3.3 ± 11.2 −3.7 ± 11.9
ch 8 −5.0 ± 7.5 2.5 ± 9.1
ch 13 −3.3 ± 8.1 1.0 ± 8.3
ch 12 −4.6 ± 9.2 1.4 ± 9.3
ch 18 0.2 ± 8.1 0.2 ± 11.2
ch 17 −1.6 ± 7.7 1.9 ± 12.3
ch 22 1.7 ± 9.4 0.0 ± 10.5
ch 21 2.2 ± 8.1 2.6 ± 12.0
Medial channel
ch 7 −5.3 ± 9.6 −1.1 ± 13.2
ch 16 −1.0 ± 11.4 −0.8 ± 10.2
Abbreviations: TMT, Trail Making Test; PFC, prefrontal cortex.
Dovepress Trail Making Test and schizophrenia
Neuropsychiatric Disease and Treatment downloaded from https://www.dovepress.com/ by 118.70.13.36 on 25-Aug-2020
patients about to begin treatment, in patients at the clinical onset of schizophrenia, as well as in healthy first-degree relatives of patients with schizophrenia.46–49 Future studies
should investigate drug-naive patients. (4) TMT performance and gender. Although not all participants had an endocrine disease, it should be investigated in each gender in the future.
Conclusion
To our knowledge, this is the first study to perform NIRS during actual TMT tasks in patients with schizophrenia versus healthy subjects. This study showed reduced lateralization of B–A activation, which reflects executive processes at the PFC area and hypoactivity in patients with schizophrenia. We suggest that these findings may be disease-related features. In addition, an observed relationship between oxy-Hb changes and psychiatric symptom scores may be of help in measuring and predicting functional outcome in patients.
Acknowledgment
This research was supported in part by a grant (20591425) from the Japanese Grant-in-Aid for Science Research.
Disclosure
The authors report no conflicts of interest in this work.
References
1. Laurens KR, Kiehl KA, Ngan ET, Liddle PF. Attention orienting dys-function during salient novel stimulus processing in schizophrenia.
Schizophr Res. 2005;75(2–3):159–171.
2. Harrison P. Neuropathology of schizophrenia. Psychiatry. 2005;4: 18–21.
3. Torrey EF. Schizophrenia and the inferior parietal lobule. Schizophr
Res. 2007;97(1–3):215–225.
4. Baddeley A, Wilson B. Frontal amnesia and the dysexecutive syndrome.
Brain Cogn. 1988;7(2):212–230.
5. Stuss DT, Levine B. Adult clinical neuropsychology: lessons
from studies of the frontal lobes. Annu Rev Psychol. 2002;53:
401–433.
6. Fletcher PC, Henson RN. Frontal lobes and human memory: insights
from functional neuroimaging. Brain. 2001;124(Pt 5):849–881.
7. Petrides M. Lateral prefrontal cortex: architectonic and functional organization. Philos Trans R Soc Lond B Biol Sci. 2005;360(1456): 781–795.
8. Ramnani N, Owen AM. Anterior prefrontal cortex: insights into
function from anatomy and neuroimaging. Nat Rev Neurosci. 2004;
5(3):184–194.
9. D’Esposito M, Detre JA, Alsop DC, Shin RK, Atlas S, Grossman M. The neural basis of the central executive system of working memory.
Nature. 1995;378(6554):279–281.
10. Bisconti S, Di Sante G, Ferrari M, Quaresima V. Functional near-infrared spectroscopy reveals heterogeneous patterns of language lateralization
over frontopolar cortex. Neurosci Res. 2012;73(4):328–332.
11. Fallgatter AJ, Strik WK. Reduced frontal functional asymmetry in schizophrenia during a cued continuous performance test assessed with
near-infrared spectroscopy. Schizophr Bull. 2000;26(4):913–919.
12. Watanabe A, Kato T. Cerebrovascular response to cognitive tasks in patients with schizophrenia measured by near-infrared spectroscopy.
Schizophr Bull. 2004;30(2):435–444.
13. Ehlis AC, Herrmann MJ, Plichta MM, Fallgatter AJ. Cortical activation during two verbal fluency tasks in schizophrenic patients and healthy controls as assessed by multi-channel near-infrared spectroscopy.
Psychiatry Res. 2007;156(1):1–13.
14. Lee J, Folley BS, Gore J, Park S. Origins of spatial working memory deficits in schizophrenia: an event-related FMRI and near-infrared
spectroscopy study. PLoS One. 2008;3(3):e1760.
15. Menon V, Anagnoson RT, Mathalon DH, Glover GH, Pfefferbaum A. Functional neuroanatomy of auditory working memory in schizophrenia:
relation to positive and negative symptoms. Neuroimage. 2001;13(3):
433–446.
16. Walter H, Wunderlich AP, Blankenhorn M, et al. No hypofrontality, but absence of prefrontal lateralization comparing verbal and spatial working
memory in schizophrenia. Schizophr Res. 2003;61(2–3):175–184.
17. Henseler I, Falkai P, Gruber O. A systematic fMRI investigation of the brain systems subserving different working memory components
in schizophrenia. Eur J Neurosci. 2009;30(4):693–702.
18. Crowe SF. The differential contribution of mental tracking, cognitive flexibility, visual search, and motor speed to performance of part A and B
of the Trail Making Test. J Clin Psychol. 1998;54(5):585–591.
19. Lezak MD. Executive functions and motor performance. In Lezak MD,
editor. Neuropsychological Assessment. New York, NY: Oxford
University Press; 1995:650–685.
20. Sánchez-Cubillo I, Periáñez JA, Adrover-Roig D, et al. Construct validity of the Trail Making Test: role of task-switching, working memory, inhibition/interference control, and visuomotor abilities. J Int Neuropsychol Soc. 2009;15(3):438–450.
21. Jacobson SC, Blanchard M, Connolly CC, Cannon M, Garavan H. An
fMRI investigation of a novel analogue to the Trail-Making Test. Brain
Cogn. 2011;77(1):60–70.
22. Nakahachi T, Ishii R, Iwase M, et al. Frontal cortex activation associated with speeded processing of visuospatial working memory revealed by multichannel near-infared spectroscopy during Advanced Trail Making
Test performance. Behav Brain Res. 2010;215(1):21–27.
23. Shibuya-Tayoshi S, Sumitani S, Kikuchi K, et al. Activation of the prefrontal cortex during the Trail-Making Test detected with multichannel near-infrared spectroscopy. Psychiatry Clin Neurosci. 2007;61(6):616–621.
24. Horacek J, Dockery C, Kopecek M, et al. Regional brain metabolism as the predictor of performance on the Trail Making Test in schizophrenia.
A 18 FDG PET covariation study. Neuro Endocrinol Lett. 2006;
27(5):587–594.
25. Sumitani S, Tanaka T, Tayoshi T, et al. Hemodynamic changes in the prefrontal cortex during mental works as measured by multi channel
near-infrared spectroscopy (NIRS). J Med Invest. 2005;52 Suppl:302–303.
26. Suto T, Fukuda M, Ito M, Uehara T, Mikuni M. Multichannel near-infrared spectroscopy in depression and schizophrenia: cognitive brain
activation study. Biol Psychiatry. 2004;55(5):501–511.
27. World Health Organization. The ICD-10 Classification of Mental and
Behavioural Disorders:Diagnostic Criteria for Research. Geneva: World Health Organization; 1993.
28. Oldfield RC. The assessment and analysis of handedness: the Edinburgh
inventory. Neuropsychologia. 1971;9(1):97–113.
29. Uetsuki M, Matsuoka K, Kim Y, et al. [Estimation of premorbid IQ by
JART in schizophrenia]. Seishinigaku. 2006;48:15–22. Japanese.
30. Kane JM, Leucht S, Carpenter D, Docherty J. The expert consensus guideline series optimizing pharmacologic treatment of psychotic
disorders. J Clin Psychiatry. 2003;64(12):1–100.
31. Key SR, Opler LA, Fiszbein A. (translated by Yamada H , Matsui K, Kikumoto K). [Positive and Negative Syndrome Scale (PANSS) Rating Manual]. Seiwa Shoten Publishers, Tokyo, Japan; 1991. Japanese. 32. Okada E, Delpy DT. Near-infrared light propagation in an adult head
model. I. Modeling of low-level scattering in the cerebrospinal fluid
layer. Appl Opt. 2003;42(16):2906–2914.
Dovepress
Fujiki et al
Neuropsychiatric Disease and Treatment downloaded from https://www.dovepress.com/ by 118.70.13.36 on 25-Aug-2020
Neuropsychiatric Disease and Treatment
Publish your work in this journal
Submit your manuscript here: http://www.dovepress.com/neuropsychiatric-disease-and-treatment-journal
Neuropsychiatric Disease and Treatment is an international, peer-reviewed journal of clinical therapeutics and pharmacology focusing on concise rapid reporting of clinical or pre-clinical studies on a range of neuropsychiatric and neurological disorders. This journal is indexed on PubMed Central, the ‘PsycINFO’ database and CAS.
The manuscript management system is completely online and includes a very quick and fair peer-review system, which is all easy to use. Visit http://www.dovepress.com/testimonials.php to read real quotes from published authors.
33. Okada E, Delpy DT. Near-infrared light propagation in an adult head model. II. Effect of superficial tissue thickness on the sensitivity of the near-infrared spectroscopy signal. Appl Opt. 2003;42(16): 2915–2922.
34. Zakzanis KK, Mraz R, Grahamn SJ. An fMRI study of the Trail Making
Test. Neuropsychologia. 2005;43(13):1878–1886.
35. Strangman G, Culver JP, Thompson JH, Boas DA. A quantitative comparison of simultaneous BOLD fMRI and NIRS recordings during
functional brain activation. Neuroimage. 2002;17(2):719–731.
36. Heinrichs RW, Zakzanis KK. Neurocognitive deficit in schizophrenia:
a quantitative review of the evidence. Neuropsychology. 1998;12(3):
426–445.
37. Aleman A, Hijman R, Haan EH, Kahn RS. Memory impairment in
schizo-phrenia: a meta-analysis. Am J Psychiatry. 1999;156(9):1358–1366.
38. Carter CS, Perlstein W, Ganguli R, Brar J, Mintun M, Cohen JD. Functional hypofrontality and working memory dysfunction in
s chizophrenia. Am J Psychiatry. 1998;155(9):1285–1287.
39. Manoach DS. Prefrontal cortex dysfunction during working memory performance in schizophrenia: reconciling discrepant findings.
Schizophr Res. 2003;60(2–3):285–298.
40. Yurgelun-Todd DA, Waternaux CM, Cohen BM, Gruber SA, English CD, Renshaw PF. Functional magnetic resonance imaging of schizophrenic patients and comparison subjects during word production.
Am J Psychiatry. 1996;153(2):200–205.
41. Buchsbaum MS, Nuechterlein KH, Haier RJ, et al. Glucose metabolic rate in normals and schizophrenics during the Continuous Performance Test assessed by positron tomography. Br J Psychiatry. 1990;156: 216–227.
42. Moll J, Oliveira-Souza R, Moll FT, Bramati IE, Andreiuolo PA. The cerebral correlates of set-shifting: an fMRI study of the trail making
test. Arq Neuropsiquiatr. 2002;60(4):900–905.
43. Ikezawa K, Iwase M, Ishii R, et al. Impaired regional hemodynamic response in schizophrenia during multiple prefrontal activation tasks:
a two-channel near-infrared spectroscopy study. Schizophr Res. 2009;
108(1–3):93–103.
44. McGurk SR, Carter C, Goldman R, et al. The effects of clozapine and risperidone on spatial working memory in schizophrenia. Am J Psychiatry. 2005;162(5):1013–1016.
45. Reilly JL, Harris MS, Keshavan MS, Sweeney JA. Adverse effects of risperidone on spatial working memory in first-episode schizophrenia.
Arch Gen Psychiatry. 2006;63(11):1189–1197.
46. Zabala A, Rapado M, Arango C, et al. Neuropsychological functioning in early-onset first-episode psychosis: comparison of diagnostic subgroups.
Eur Arch Psychiatry Clin Neurosci. 2010;260(3):225–233.
47. Park S, Holzman PS, Goldman-Rakic PS. Spatial working memory deficits in the relatives of schizophrenic patients. Arch Gen Psychiatry. 1995;52(10):821–828.
48. Myles-Worsley M, Park S. Spatial working memory deficits in schizophrenia patients and their first degree relatives from Palau,
Micronesia. Am J Med Genet. 2002;114(6):609–615.
49. Bowie CR, Harvey PD. Cognitive deficits and functional outcome in
schizophrenia. Neuropsychiatr Dis Treat. 2006;2(4):531–536.
Dovepress
Dove
press
Trail Making Test and schizophrenia
Neuropsychiatric Disease and Treatment downloaded from https://www.dovepress.com/ by 118.70.13.36 on 25-Aug-2020